

Translate this page into:
Landslide susceptibility assessment and their disastrous impact on Makkah Al-Mukarramah urban Expansion, Saudi Arabia, using microtremor measurements
⁎Corresponding author. 438106752@student.ksu.edu.sa (Abdullah Binsadoon)
-
Received: ,
Accepted: ,
This article was originally published by Elsevier and was migrated to Scientific Scholar after the change of Publisher.
Peer review under responsibility of King Saud University.
Abstract
Landslide susceptibility of Makkah Al-Mukarramah has been assessed by collecting microtremor measurements at 277 sites covering the whole area. These data were then processed and analyzed using the horizontal–vertical spectral ratio (HVSR) method to obtain the resonance frequency and H/V amplification factor. The results display that the predominant frequency values range between 0.26 and 17.27 Hz, and the amplification factor varies from 0.87 to 14.68. Then, 34 sites were selected to assess the frequency, amplitude and azimuthal site response where frequency ranges from 0.26 to 13.67 Hz while amplitude varies from 2.0 to 12.2. Moreover, the site response direction was parallel to the landslide directional response in the sliding areas which indicates that the site response direction followed the landslide direction. The results of this study have been approved practically at several sites through field measurements at some of recent landslide occurrence locations in Makkah urban area. These results signifying that microtremor measurements are effective technique in locating the sites suffering landslides, which, in turn, reduce their hazardous impact on either human-life and their beings. Therefore, it is highly recommended to apply this approach in places prone to landslides in southwestern Saudi Arabia.
Keywords
Microtremors
Landslide
Resonance frequency
Directional resonance
Makkah Al-Mukarramah
Saudi Arabia

1 Introduction
The Makkah Al-Mukarramah urban area is bounded by rugged topography and steep-slope mountainous heights in the southwest of Saudi Arabia (Fig. 1). This mountainous location has defined the city’s contemporary expansion. The urban communities and facilities are extended through low-land zones, where the Al-Haram area is lower than most of the city. The area around the mosque consists of old structures and is built on the edges of steep-slope hilly blocks. Traditional homes are built from local rock. Rainfall in Makkah flows from the higher edges along the natural slopes. If these slopes are close to the main roads, it will be more vulnerable. The density of population is high, where permanent residents living along the natural slopes of the Old City. Moreover, the huge visitors of the city for the yearly-round pilgrimage.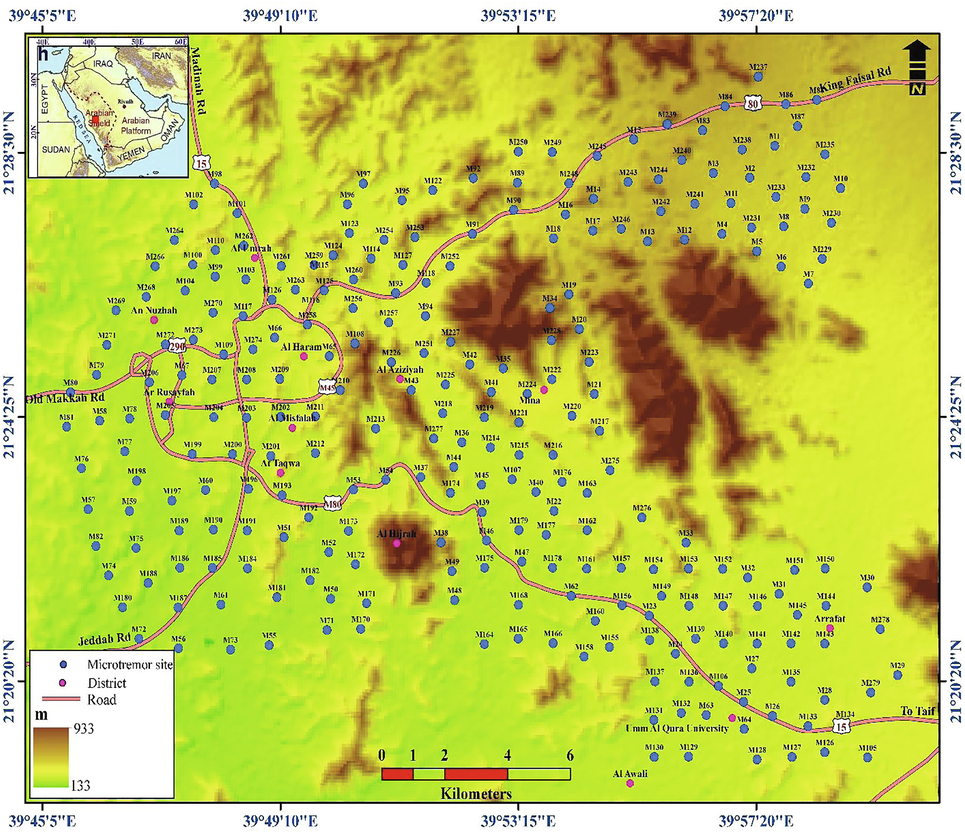
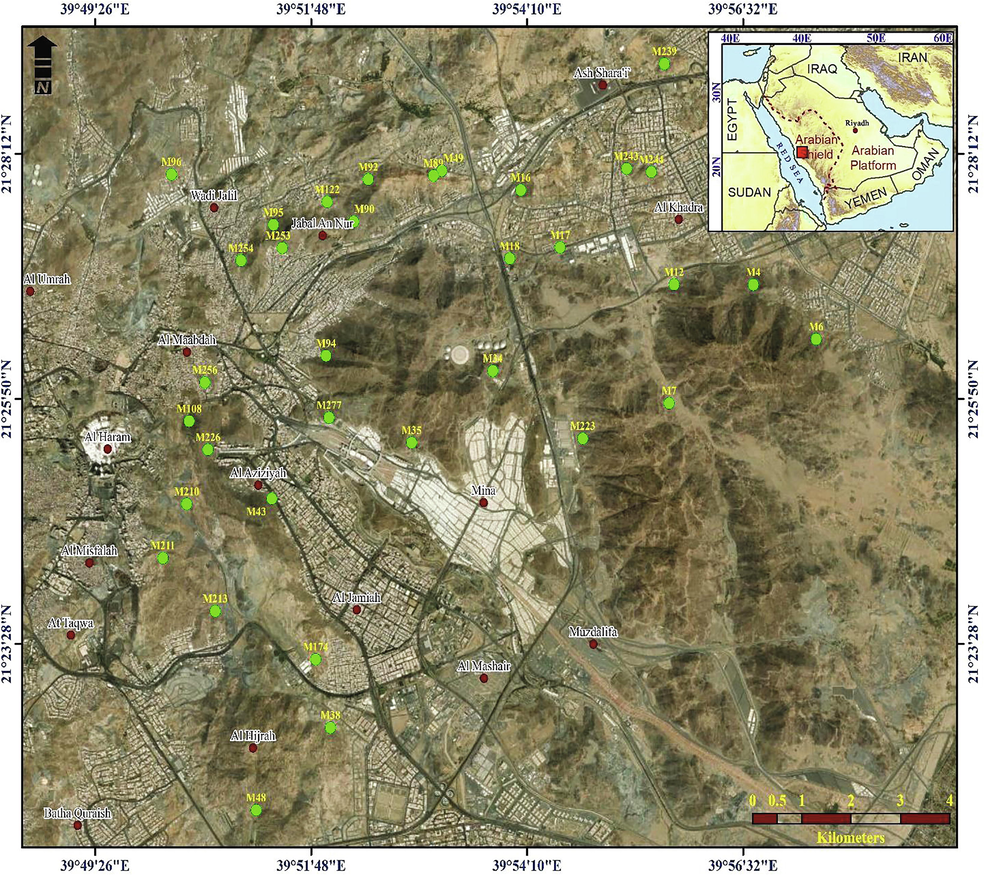
Location of ambient noise measurements of the study area.
Number of major earthquakes affected Makkah on the October 8, 1992, Al-Sharai’a earthquake; the September 12, 2005, non-tectonic seismic shock; and recently, the November 28, 2019 earthquake. These earthquakes affected most of the area, with great ground motion and a hazardous impact (Abdelrahman et al., 2019a, 2019b). In addition, the potentially active tectonic structures that surround the city will increase the susceptibility of landslide phenomenon where it acts as more vulnerable locations.
The disastrous impacts of landslide are readily acknowledged and intensively investigated by several authors worldwide (Saputra et al., 2016; Shanmugam and Wang, 2015; Aleotti and Chowdhury, 1999; Al-Saud, 2015; Youssef et al., 2015a, 2015b, 2015c; Mora and Vahrson, 1994; Mora-Castro et al., 2012; Valenzuela et al., 2018; Berov et al., 2016). Microtremor measurements have been approved at some sites globally by Gaudio and Wasowski (2007), Rezaei et al. (2018), and Zul Bahrum and Sugianto (2018).
Soil response effects, such as resonance frequency and amplification characteristics, are critical for the city of Makkah, where soft soil, even with small thickness, will accelerate the landslide occurrences, causing huge damage to the population. The closest location of Makkah with an earthquake source zone in the Red Sea permits the efficient transmission of earthquake ground shaking through Makkah. Soft sediments and weathered and cracked blocks will increase the landslide susceptibility. Thus, because of the increasing population, construction, and remarkable economic activities in the area, evaluating the landslide susceptibility of Makkah becomes crucial.
2 Geological settings of Makkah
Geologically, Makkah area comprises Precambrian–Cambrian basement complex, Cretaceous–Tertiary sedimentary sequence, Tertiary–Quaternary basaltic lava flows, and Quaternary–Recent alluvial deposits (Fig. 2). The Precambrian rock units in Makkah have been studied by different authors (e.g. Al-Shanti 1966; Brown et al., 1963; Spincer and Vincent, 1984). The igneous rocks intruded within the metamorphic units, predominantly amphibolite and volcano-sedimentary rocks. Moore and Al-Rehaili (1989) classified the Precambrian rocks into Late-Proterozoic basaltic to rhyolitic volcanic and volcanoclastic, that have been vaccinated by intrusive bodies of various ages and compositions. Furthermore, intrusions of gabbroic rocks exist. Besides Precambrian dikes related to individual plutons, two types of dikes exist. Mafic dikes consist of gabbroic rocks and ore, dominantly trending east and north-northwest. Moreover, basaltic lava flows covering the upper levels of both the basement complex and the sedimentary rocks. Quaternary deposits distribute in low-land wadies of Makkah area in the form of gravel, alluvial sands of wadi beds with eolian edifices.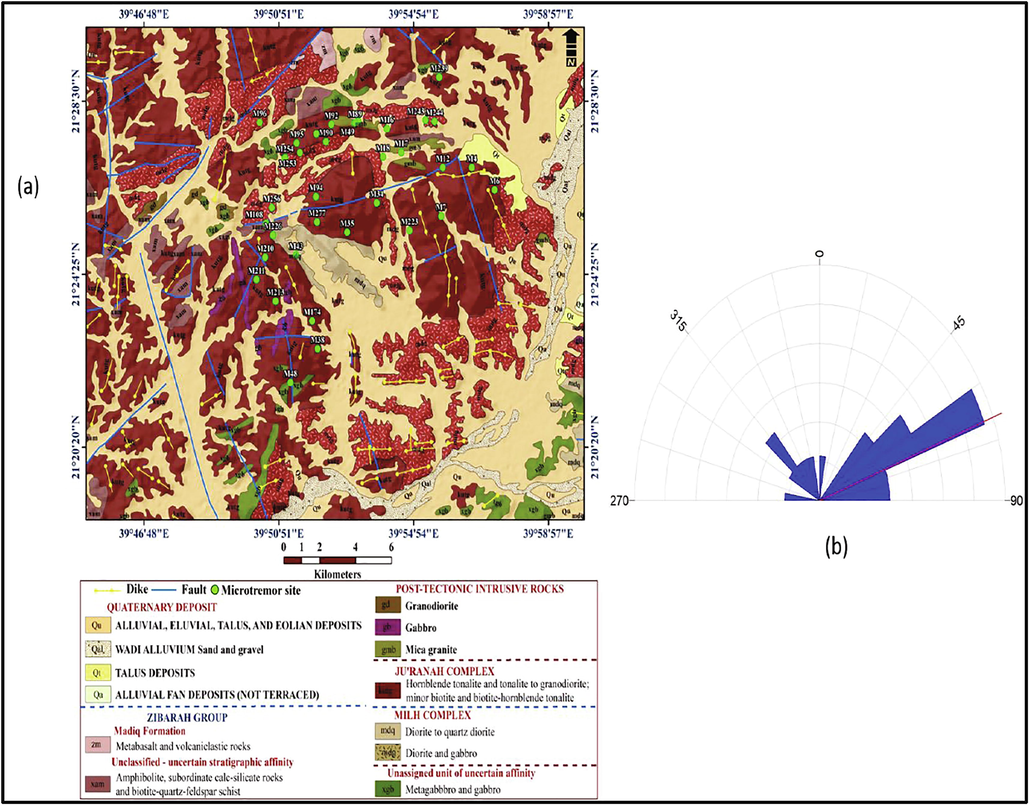
Geologic setting of Makkah Al-Mukarramah area.
Tectonically, Makkah area affected greatly by the Red Sea faulting structures that affected geologic units from the Precambrian to the Quaternary (Sharaf, 2010). Three major fracture trends represent conspicuous geologic structural elements in the region. These fault trends oriented into NW-SE, NE-SW and N-S however, the NW faulting trend is the oldest and represented by normal faults. While, the NE-SW faults dislocate the NW-SE faulting trend forming the second group of faulting. Moreover, the N-S fault trend behave as shear faults with lateral movement for NW-SE and NE-SW faulting trends.
3 Seismicity and seismotectonic setting of Makkah region
Makkah Al-Mukarramah is near the seismically active tectonic environment of the Red Sea (Fig. 3), with potentially active tectonic structures, for example, the Ad-Damm fault zone south of Makkah (Merghelani and Gallanthine 1981). Historical and instrumental earthquake events have occurred in or around the city. Ambraseys et al. (2005) reported several earthquakes occurring in 873, 1121, 1269, 1408, and 1426 CE. Some of these earthquakes caused low to moderate damage to high-rise buildings, for example, minarets and pillars, near the Holy Mosque of Makkah. A detailed earthquake survey of the study area allowed Merghelani and Gallanthine (1981) to detect a series of microearthquakes near Arafat Mountain. Although the location accuracy of these events was small, as they happened outside the survey network, their epicenter could have been in Makkah.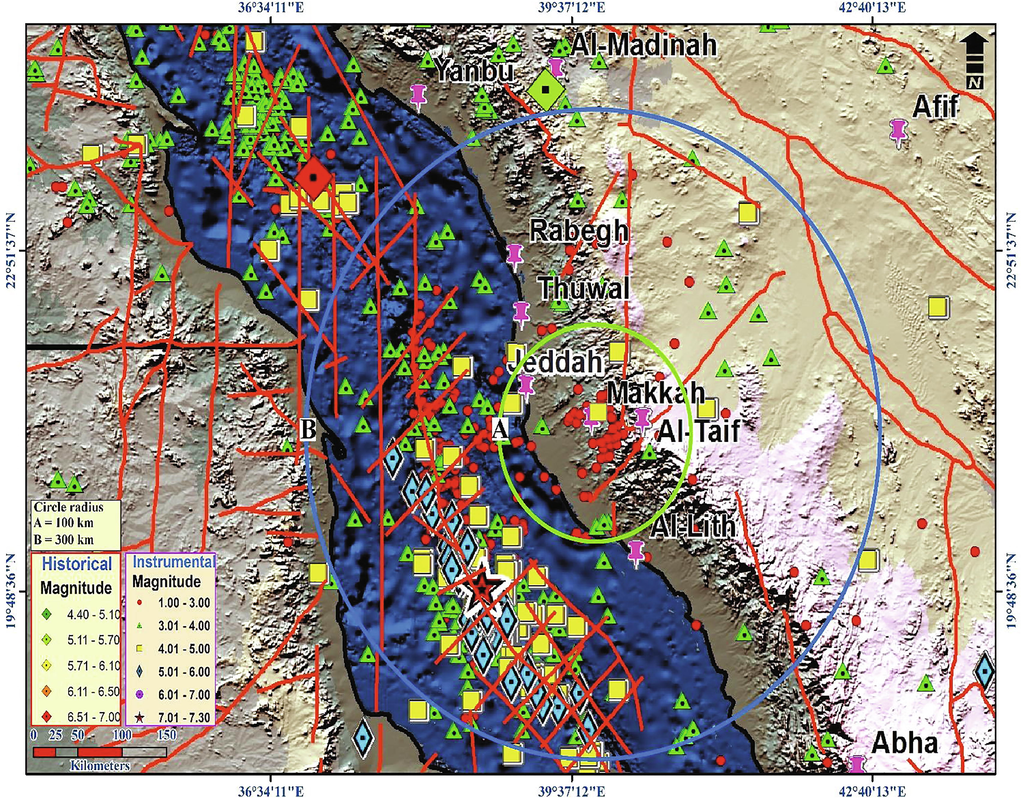
Seismicity and seismotectonic setting of the Makkah area.
An event that happened on September 28, 1993 (12/4/1413H), confirmed the earthquake vulnerability of Makkah Al-Mukarramah, where the whole city was shaken through earthquake occurring in the Al-Sharai’a district, 30 km northeast of the Holy Mosque. The shock has a magnitude of 3.6 and followed by sequence of small earthquakes that recorded by seismic network of Saudi Geological Survey. An earthquake swarm has been occurred at Al-Sharai’a on October 3, 1993, a major event with a magnitude of 4.1 Ml (Al-Furaih et al., 1994; Swolfs, 1994). An event with a magnitude of 3.6 was logged close to the same area on June 18, 1994, occurring at the Al Utaibiyya District on 8/8/1426H. This earthquake was predictable and shallow, as suggested by the localized effect.
Fnais et al. (2015) deliberate the seismicity and seismotectonic setting of the Jeddah–Makkah area. They collected historical and instrumentally documented data of earthquakes that affected the Jeddah–Makkah area from various sources and categorized them into a unified earthquake catalog. Five seismotectonic source zones affecting the Makkah region were identified (Fig. 3). Three zones locating in the Red Sea axial trend (northwestern Jeddah, western Jeddah, and southwestern Jeddah zones), whereas two zones lie inland (Thuwal–Rebigh and Jeddah–Makkah zones). It can be stated that the source zone of Jeddah–Makkah is the most susceptible source of the studied area wherever the zone includes tectonic trends. The first one is Wadi Fatima, representing the main fault-bounded graben, 50 km long and 10 km wide. The principle graben of NE-SW has a preexisting faulting trend which separated by NW-SE several faults resulted from the Red Sea major tectonics (Al-Garni, 2009). The NNE fractures indicate that the area belongs to a conjugate set of tertiary ruptures. The path of Wadi Fatima spreads ENE-WSW to the south of the city of Jeddah. It abruptly diverts northward, possibly because of active faults (Azzedine et al., 1998). The secondary trend is the Ad-Damm active fault, a major fault trend positioned in the Jeddah–Makkah area.
4 Microtremor measurements
The study area comprised 277 sites for microtremor measurements (Fig. 1). The data collection experimental parameters followed the recommendations of the SESAME team (SESAME 2004). Microtremors were measured for at least 1 h at each site to guarantee long records free from transient conflicts (e.g., moving vehicles and wind gusts) using STA/LTA anti-trigger algorithm. Data were monitored by a sampling rate of 100 sps and filtered using a 0.2–20 Hz bandpass filter. The seismometers were calibrated before recording, installed in good coupling with the surficial soil, oriented horizontally (N–S and E–W), and leveled vertically. The quality and precision of the results attained using this method depend on the processing sequence. In this research, Geopsy software was used to process the records (Wathelet, 2006). The results of microtremor have been verified using the SESAME team’s standards for the reliability. Moreover, the site response direction was assessed using the azimuthal rotation of the horizontal to vertical spectral ratio with intervals of 10° azimuth.
5 Results and discussion
5.1 Estimation of predominant frequency and H/V amplitude
Microtremor records were processed and their H/V spectral ratios calculated using the steps described above (Fig. 4). The predominant frequency and H/V amplitude were estimated using the spectral ratios of H/V readings. Table 1 shows the resonance frequency and H/V amplitude values for different stations where both f0 and A0 represent the observed predominant frequency and H/V amplitude for every station, respectively. The H/V spectral ratios were examined in the processing sequence through SESAME criteria at 277 stations. Explaining these criteria is beyond the scope of the SESAME guidelines (SESAME, 2004).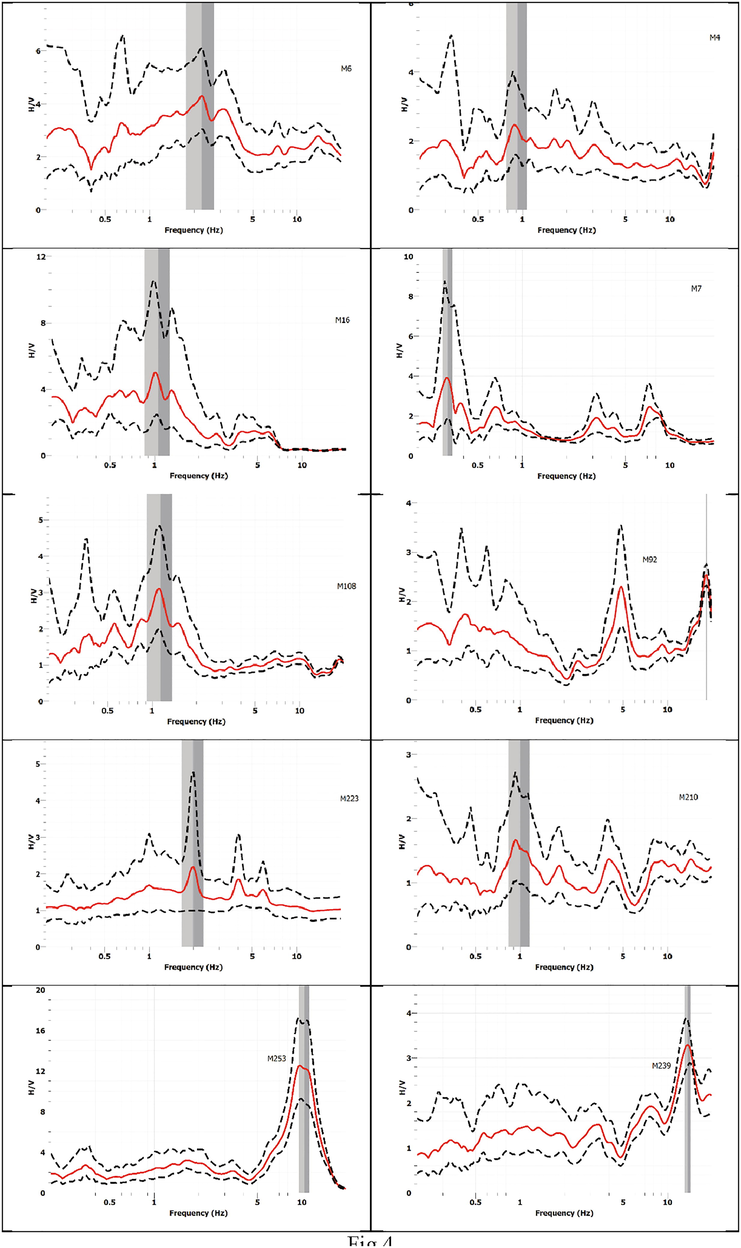
Examples of H/V spectral ratio at ambient noise measurement stations.
Site No.
Longitude
Latitude
F0
A0
Azimuth (O)
M4
39.9441
21.44895
0.93
2.53
35
100
M6
39.95555
21.44017
3.16
4.22
80
M7
39.92871
21.42987
0.67
2.58
40
M12
39.92964
21.44896
1.11
2.4
20
120
M16
39.90162
21.46418
1.04
5.51
20
160
M17
39.90883
21.45493
1.33
2.93
110
M18
39.89962
21.45315
0.66
2.82
70
M34
39.89655
21.43507
0.68
3.26
130
M35
39.88169
21.42351
0.92
3.1
30
M38
39.86686
21.37764
1.11
3.29
20
140
M43
39.85615
21.41448
1.01
2.9
10
150
M48
39.85329
21.36435
0.87
2
40
M49
39.887189
21.46729
1.13
12.01
80
M89
39.88568
21.46648
0.97
2.76
10
120
M90
39.8711
21.45911
2.34
2.33
120
M92
39.87378
21.46589
4.88
2.32
120
M94
39.86607
21.4375
0.8
4.48
60
M95
39.85644
21.45859
0.82
3.86
30
M96
39.83785
21.4667
6.24
2.06
140
M108
39.84106
21.42696
1.07
2.39
80
M122
39.86627
21.46226
1.33
2.21
10
140
M174
39.86417
21.38861
5.6
4.67
60
M210
39.84062
21.41363
0.45
2.58
80
M211
39.83629
21.40492
1.95
2.34
80
M213
39.84582
21.39638
1.07
3.82
120
M223
39.91296
21.42417
2.02
2.3
40
M226
39.8445
21.42237
1.01
3.51
65
110
M239
39.92783
21.48449
13.67
3.11
60
M243
39.92098
21.46762
0.68
4.69
90
M244
39.92547
21.46708
0.61
6.71
30
160
M253
39.85805
21.45484
10.28
12.2
115
M254
39.85054
21.45281
13.01
8.17
10
120
M256
39.84393
21.4332
11.24
5.33
80
M277
39.8666
21.42754
0.26
2.13
10
160
Investigating the condition of the ground confirmed these results. Thus, the correctness of the results was approved at these stations. To confirm such a conclusion, measurements were conducted at these stations again, obtaining comparable results revealing the maximum and minimum predominant frequencies for Makkah area were 0.26 and 17.27 Hz, respectively. The maximum and minimum amplitudes equalled 0.87 and 14.68, respectively. The high values of the fundamental frequency indicate a seismic impedance contrast in the shallow interface. The microtremor measurement results were presented in the form of a zonation map for further interpretation. ArcGIS software was used to draw the maps. The interpolation of the results was obtained using ambient noise measurements. Fig. 5 represents zoning map for predominant frequency while Fig. 6 shows the H/V amplitude zonation map.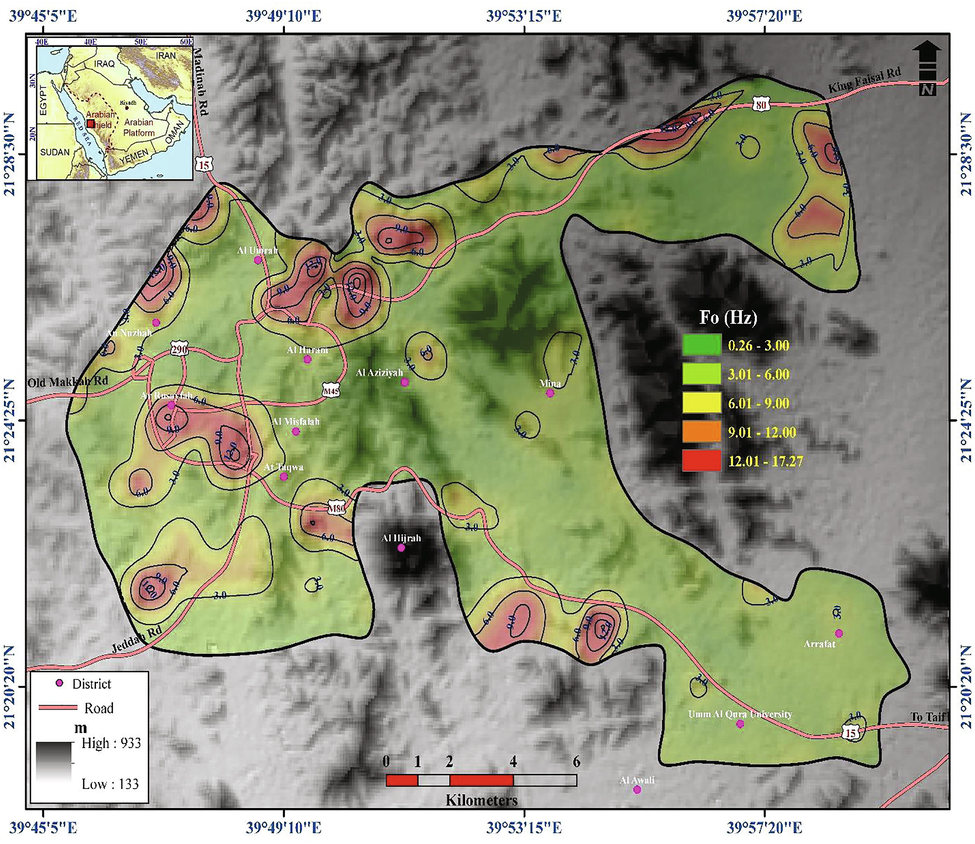
Fundamental frequency zonation map.
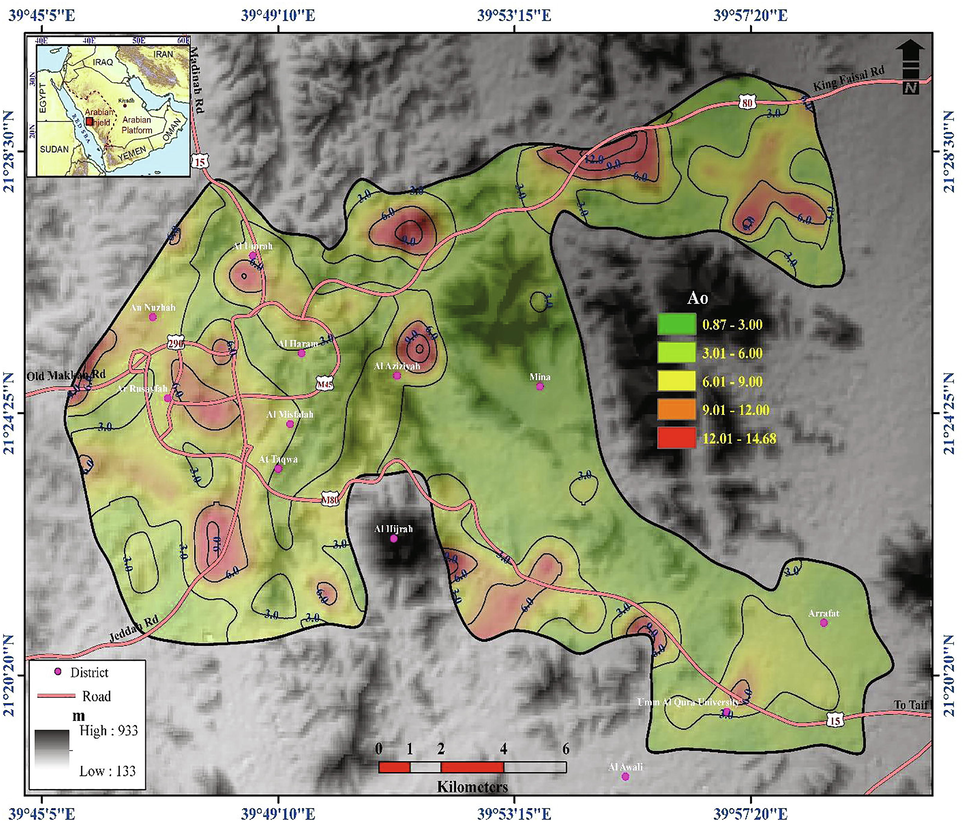
The H/V amplitude zonation map.
5.2 Estimation the direction of site response
As indicated before, the response direction has been assessed through the rotation at azimuth intervals of 10°of the H/V spectral ratio. The site response direction was evaluated using the three quantities of frequency, amplitude, and azimuth. Fig. 7 illustrates the H/V spectral rotation ratio at various stations. The analysis of these data illustrates that the frequency values span between 0.26 and 13.67 Hz while amplitude extends from 2.0 to 12.2. This figure proves that 34 stations show directivity (Fig. 8). It is noticed that, for these stations, the H/V amplification arises in a specific direction reflecting the impact of the integration between the localized site response, geometrical and the geologic circumstances.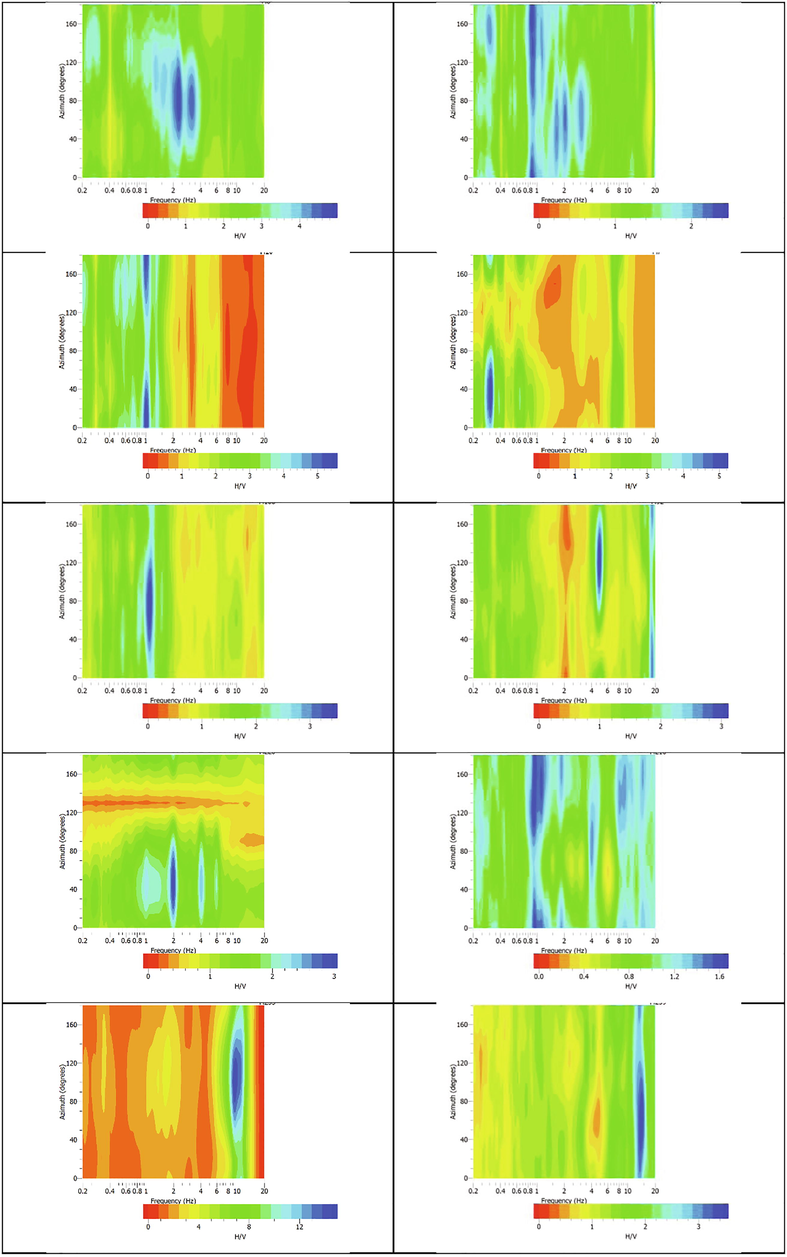
Examples of H/V spectral ratio rotation at microtremor measurement stations.
The selected sites for site response directivity measurements.
Moreover, the directivity is evident at stations on the landslide sites. Such explanations in agreement with Panzera et al. (2011), Del Gaudio and Wasowski (2014), and Pilz et al. (2014). Table 1 shows the site response direction at 34 stations.
Several field tests and measurements were conducted at some landslide locations of Makkah Al-Mukarramah. Significant efforts were made to identify all slide paths and old landslides through the field survey to find a proper interpretation of the results. Fig. 9 shows examples of this field survey, proving that stations exhibiting directivity were on landslide sites. A more detailed examination indicates that stations with directivity followed the landslide direction. It is noticed that, the maximum slope follows the landslide direction in the sliding areas. These results correlated with that of Burjanek et al. (2010); Panzera, Lombardo, and Rigano (2011); Del Gaudio, Muscillo, and Wasowski (2014); and Pilz et al. (2014).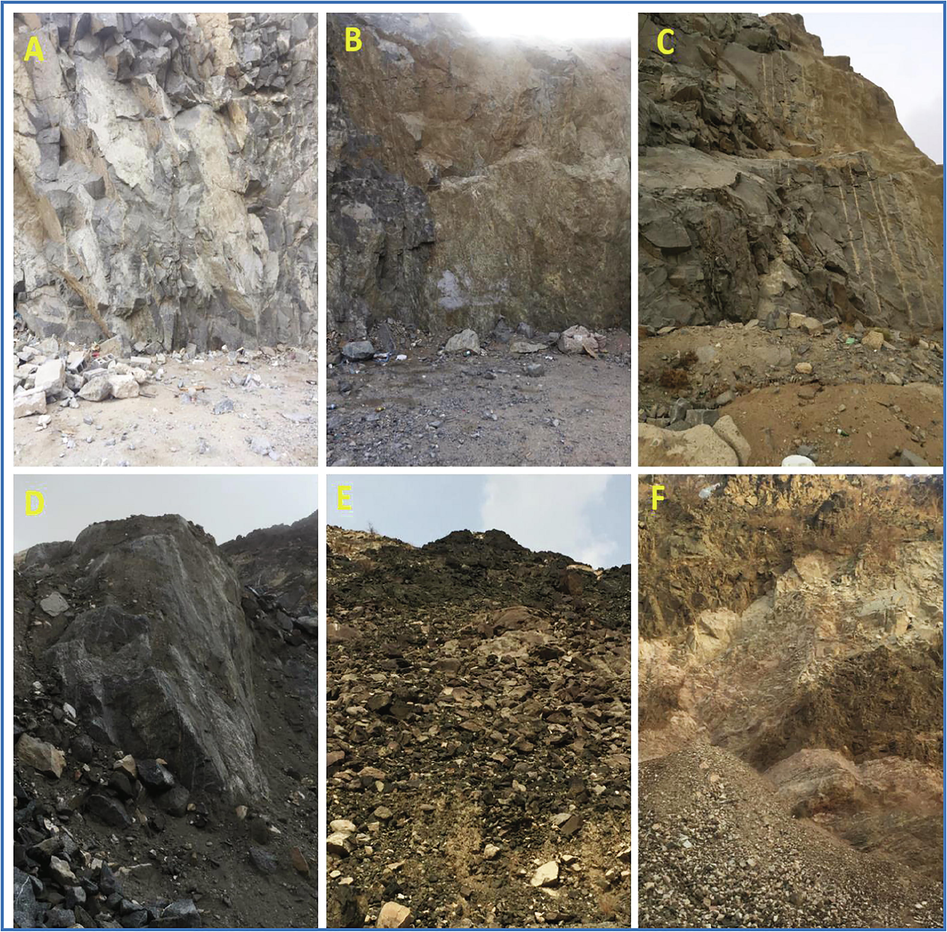
Landslide field verification sites.
6 Conclusions
In this study, microtremor measurements were conducted at 277 stations to estimate landslide susceptibility of the Makkah Al-Mukarramah. The processed data through Nakamura technique in order to obtain the predominant frequency, H/V amplitude. Then, mapping of these parameters through Makkah investigated area. The verification of the directional site response phenomenon was measured by the rotation in azimuth intervals of 10° of the H/V spectral ratios. Then, the directivity results were verified with a field survey to evaluate the accuracy of the microtremor measurements.
These results clarified both of maximum and minimum predominant frequencies throughout Makkah were 6.86 and 3.34 Hz, respectively. The maximum and minimum H/V amplitudes equaled 3.34 and 2.01, respectively. The high values of the fundamental frequency indicate a seismic impedance contrast in the shallow interface. Directivity was obvious at stations in the landslide area. A detailed inspection of microtremor stations indicated that the site response directions were parallel to the main direction of landslide. According to these results, the microtremor measurements provide a comprehensive approach to landslide assessment. It reduces the initial costs of numerical analyses and accelerates landslide analyses.
Acknowledgments
The authors extend their appreciation to the Deanship of Scientific Research at King Saud University for funding this work through the research group No. RGP -1436-011.
Declaration of Competing Interest
The authors declare that they have no known competing financial interests or personal relationships that could have appeared to influence the work reported in this paper.
References
- Ground motion acceleration and response spectra of Al-Mashair area, Makkah Al-Mukarramah, Saudi Arabia. Arabian J. Geosci.. 2019;12(11):346.
- [Google Scholar]
- Seismic hazard assessment of al Mashair area, Makkah Al-Mukarramah (Saudi Arabia) In: On Significant Applications of Geophysical Methods. Springer; 2019. p. :227-230.
- [Google Scholar]
- Seismic characteristics and kinematic models of Makkah and central red sea regions. Arabian J. Geosci.. 2015;1(1):49-61.
- [Google Scholar]
- Landslide hazard assessment: summary review and new perspectives. Bull. Eng. Geol. Environ.. 1999;58(1):21-44.
- [Google Scholar]
- New Aspects on Estimated Risk around the Makkah Region. 2nd Ann. Meeting of Saudi. Soc. Earth Sci.. 1994;19:25-27.
- [Google Scholar]
- Geophysical Investigations for Groundwater in a Complex Subsurface Terrain, Wadi Fatima, KSA: A Case History. Jordan J. Civ. Eng.. 2009;3(2):118-136.
- [Google Scholar]
- The seismicity of Egypt, Arabia and the Red Sea: a historical review. Cambridge University Press; 2005.
- Addition to the method of mora & vahrson for landslide susceptibility along the Bulgarian black seacoast. Napoli, Italy: CRC Press; 2016.
- Burjanek, J., G. Gassner-Stamm, V. Poggi, J. R. Moore, and D. Fah. 2010. “Ambient Vibration Analysis of an Unstable Mountain Slope. “Geophysical Journal International 180: 820–828.
- What we can learn about slope response to earthquakes from ambient noise analysis: an overview. Eng. Geol.. 2014;182:182-200.
- [Google Scholar]
- Drainage Diversions as Evidence of Propagating Faults: example of the El Asnam and Thenia Faults, Algeria. Terra Nova. 1998;10:236-244.
- [Google Scholar]
- Seismicity and seismotectonic of Jeddah-Makkah region, west-central Saudi Arabia. J. Earth Sci.. 2015;26(5):746-754.
- [Google Scholar]
- Directivity of slope dynamic response to seismic shaking. J. Geophys. Res. Lett.. 2007;34:2007.
- [Google Scholar]
- Microearthquakes in the Tihamat-Asir Region of Saudi Arabia. Bull. Seism. Soc. Am.. 1981;70(6):2291-2293.
- [Google Scholar]
- Moore, T. and Al-Rehaili, M. (1989). Geologic map of the Makkah quadrangle, sheet 21d. Kingdom of Saudi Arabia, Saudi Arabian Directorate General of Mineral Resources Geoscience Map GM-107C, scale, 1(250,000).
- Mora, C., S. and Vahrson, W.-G. (1994). Macrozonation methodology for landslide hazard determination. Bulletin of the Association of Engineering Geologists, 31(1):49–58.
- Mora-Castro, S., Saborio, J., Asté, J., Prepetit, C., Joseph, V., and Matera, M. (2012). Slope instability hazard in Haiti: Emergency assessment for a safe reconstruction. Landslides and Engineered Slopes: Protecting Society through Improved Understanding. Taylor & Francis Group, London, pages 153–172.
- Evidence of topographic effects through the analysis of ambient noise measurements. Seismol. Res. Lett.. 2011;82:413-419.
- [Google Scholar]
- Combining seismic noise techniques for landslide characterization. Pure Appl. Geophys.. 2014;171:1729-1745.
- [Google Scholar]
- Evaluation of landslides using ambient noise measurements (case study: Nargeschal landslide) Int. J. Geotech. Eng. 2018
- [CrossRef] [Google Scholar]
- Coseismic landslide susceptibility assessment using geographic information system. Geoenviron. Disasters. 2016;3(1):27.
- [Google Scholar]
- Geological and geophysical exploration of the groundwater aquifers of As Suqah area, Makkah district, Western Arabian Shield. Saudi Arabia. Arab. J. Geosci. 2010;2011(4):993-1004.
- [CrossRef] [Google Scholar]
- Swolfs, H. S., 1994. Listing of Earthquakes in the Arabian Tectonic Plate. USGS-DFR-94-3.29
- Assessment of rockfall hazard at Al-Noor mountain, Makkah city (Saudi Arabia) using spatio- temporal remote sensing data and field investigation. J. Afr. Earth Sc.. 2015;101:309-321.
- [Google Scholar]
- Landslide susceptibility assessment at wadi Jawrah basin, Jizan region, Saudi Arabia using two bivariate models in GIS. Geosci. J.. 2015;19(3):449-469.
- [Google Scholar]
- Geological condition at landslides potential area based on Microtremor survey. ARPN J. Eng. Appl. Sci.. 2018;13(8):3007-3013.
- [Google Scholar]


