

Translate this page into:
Kinetics modelling of acid hydrolysis of cassava (Manihot esculanta Cranz) peel and its hydrolysate chemical characterisation
⁎Corresponding author. olawaleola01@yahoo.com (E.O. Ajala) ajala.oe@unilorin.edu.ng (E.O. Ajala)
-
Received: ,
Accepted: ,
This article was originally published by Elsevier and was migrated to Scientific Scholar after the change of Publisher.
Peer review under responsibility of King Saud University.
Abstract
Acid hydrolysis of cassava peel (CP) to reducing sugar (RS) was undertaken at 70, 90 and 110 °C, and 0.5, 1.0 and 1.5 M concentrations of H2SO4. Kinetics and thermodynamics of the study were tested for their statistical consistency using analysis of variance (ANOVA). The RS was characterised for its bioactive chemical compositions and functional groups. Maximum RS of 47.70 g/l from a 50 g/l of the CP with the highest rate constant (k) of 0.00247 min−1 was attained at 1.5 M and 110 °C. The ANOVA results of F > F crit and p < 0.05 revealed that the AC at constant temperature has a significant effect on the hydrolysis. The thermodynamic analysis revealed that the highest value of 3.06 × 10³ Jmol−1 for ΔH (1.5 M and 110 °C), and the lowest value of ΔS = −7.65 × 10 Jmol−1 (0.5 M and 70 °C) were obtained. The bioactive chemical indicated the presence of compounds effective against several diseases. The functional groups obtained among others include alkanols, aldehyde, and alkanoates. Therefore, CP hydrolysis is a significant way of reducing the cost of RS as it contains essential ingredients for pharmaceutical, food and medicinal purposes.
Keywords
Cassava
Hydrolysis
Kinetics
Thermodynamic
Reducing sugar

Nomenclature
- AC
Acid concentration
- RSC
Reducing sugar concentration (g/l)
- GC-MS
Gas Chromatography-Mass Spectra
Reactant concentration of cassava peel (g/l)
Intermediate concentration of oligomer (g/g)
Product concentration of reducing sugar (g/l)
Initial concentration of cassava peel (g/l)
- and
Reaction rate constants (min−1)
- Ea
Activation energy (kJ/mol)
- A
Pre-exponential factor (min−1)
- ΔH
Enthalpy change (kJmol−1)
- ΔS
Entropy change
- ΔG
Gibbs free energy (kJmol−1)
1 Introduction
The annual global production of cassava tuber is about 270 million tons and about 20–30% of the total weight is cassava peels (CP) waste (Odediran et al., 2015; Ekop et al., 2019). These wastes are often left to decay and/or burnt, causing environmental pollution. This has necessitated the need to find worth for the peels by hydrolysing it for biotechnology industries (Ohimain et al., 2013). Hence, hydrolysis of the CP to reducing sugar (RS) would reduce the environmental challenges heralded by the CP. The reducing sugar could contain pentoses and hexoses sugars, which are alternative substrates in biotechnological processes and can be used in carbonated beverage and biofuels production (Nwalo & Cynthia, 2014).
The CP in its dry weight contains 29.84% starch, 14.17% cellulose, 23.4% hemicellulose, 4.66% total sugars, 10.88% lignin, 5.29% crude protein, 3.70% mineral (ash) elements and traces of pectin, carboxyl, hydroxyl and amino groups. These are essential ingredients in the biotechnological and pharmaceutical industries (Pooja & Padmaja, 2015; Mohd-Asharuddin et al., 2017). The CP is a homopolysaccharide with β-d-glucopyranose units linked together by 1,4-glycosidic bonds. Furthermore, CP is a homopolymer of anhydroglucose units composed of crystalline and amorphous regions (Chen, 2015). These bonds and regions can only be broken down to their monomers and units by hydrolysis.
Hydrolysis, either enzymatic or acidic, is the breaking down of cellulose and hemicellulose polymers in lignocellulosic biomass to form individual monomers (Jacobsen & Wyman, 2000). Acid hydrolysis is preferred over enzymatic, as it is a faster process and highly efficient (Lenihan et al., 2010). Onyelucheya et al. (2016) and Abidin et al. (2014) employed acid hydrolysis for CP and obtained RSC of 2.22 mg/ml and 5.75%, respectively. These yields are, however, low, hence the need to study the kinetics and thermodynamics of the process.
Kinetics modelling of lignocellulosic biomass hydrolysis describes the relationship between the principal state variables and the behaviour of the process (Luoa et al., 2012). Its thermodynamic parameters play a crucial role in determining the extent of reaction and position of equilibrium, where the reaction rate is catalyst and temperature-dependent (Sarma et al., 2014). Discovering the kinetic models that wholly describe the hydrolysis process is an essential step in the successful conversion of CP to useful products (Onyelucheya et al., 2016). The models are based on the acid-catalysed breakdown of long and straight chains of cellulose to shorter oligomers (Jacobsen & Wyman, 2000). It is therefore important to investigate the kinetics and thermodynamic aspects of CP hydrolysis in terms of Ea, A, H, G, and S.
This study investigated the effects of AC and temperature over time on the RSC recovery from CP. The results obtained were analysed for their statistical consistency, kinetics, and thermodynamic parameters. Bioactive chemical composition and functional groups of the RS were characterised.
2 Experimental
2.1 Materials
The CP was collected from a Garri processing factory in Ilorin, Nigeria. It was cleaned with distilled water, shredded to 1–2 cm sizes using stainless steel knife and oven-dried at 60 °C until a constant weight was obtained. The CP was ground and screened to < 80 µm diameter, packed in a polythene bag and stored in a desiccator. The RSC was determined using Jenway Ultra-Violet Spectrophotometer, model 6305. Chemicals of analytical grade by Sigma-Aldrich were used.
2.2 Acid hydrolysis of CP and RSC analysis
Sulphuric acid (H2SO4) of various concentrations (0.5, 1.0 and 1.5 M) was used for the hydrolysis. Five grams of CP was added to 100 ml of each AC in a 250 ml Erlenmeyer conical flask. The mixture was placed on a magnetic stirrer hotplate for 120 min at 70, 90 and 110 °C. Ten millilitres of the mixture was collected at 20 min interval and was centrifuged at 3,000 rpm for the period of 10 min. Three millilitres of supernatant was collected for the 3,5 – dinitro salicylic acid (DNS) assay analysis.
Modified method of Miller (1959) was used to prepare the DNS assay and was stored in a refrigerator at 4 °C in a 2 L amber bottle. The DNS was used to determine the RSC using the spectrophotometer at a wavelength of 540 nm. The data obtained for RSC were subjected to analysis of variance (ANOVA), to investigate the effects of AC and temperature on hydrolysis at a significant level of 5% using Microsoft EXCEL 2016.
2.3 Kinetic model and thermodynamics analyses
2.3.1 Kinetic model
Eq. (1) is the general form of hydrolysis of cellulosic biomass to produce hexose sugars.
The stoichiometry posterior to the addition of water to sugar molecules at the time of hydrolysis is presented in Eq. (2).
The hydrolysis of cellulose followed a first-order kinetic model with Arrhenius temperature dependence and AC raised to a power. However, this model is deficient as it assumes a homogeneous reaction. Therefore, further research is required to understand the fundamental nature of lignocellulose hydrolysis. According to Binder and Raines (2010), hydrolysis of polysaccharides (hemicellulose and cellulose) is as shown in Eq. (3):
Eq. (3) was used to develop the kinetic model that best described the hydrolysis under the following assumptions;
cellulose and hemicellulose were considered as a unit of the reactant,
the reaction was slow,
the reducing sugar was recovered before degradation to furfural and other inhibitory by-products occurred.
Hence, a modified Eq. (3) gave Eq. (4) to develop the model
The reaction kinetics shown in Eqs. (5)–(7) were used to develop the model of the acid-hydrolysis by fitting the experimental data to evaluate the parameters.
Resolving Eqs (5) and (6) with appropriate boundary conditions gave Eqs. (8) and (10).
Substituting Eqs. (8) and (9) into Eq. (7) gave Eq. (10);
Based on the assumptions, Eq. (10) becomes Eq. (11);
Therefore, the rate is determined by the second step of the two-step reaction which is governed by . Thus, the slow step has the greatest influence on the overall reaction rate.
Linearizing Eq. (11) yielded Eq. (12),
2.3.2 Thermodynamic study
The models of Kouamé et al. (2017) and Sarma et al. (2014) shown in Eqs (13) – (16) were considered to determine Ea, A, ΔH, ΔS, and ΔG, respectively.
Eq. (13) gave values of Ea and A, and ΔH, ΔS, and ΔG were determined using Eqs. (14)–(16), respectively.
where; Boltzmann’s constant (KB) = 1.38 × 10⁻²³ J.K−1,
Planck’s constant (hp) = 6.626 × 10⁻³⁴ J.s, and
Gas constant (R) = 8.314 J.mol−1. K−1.
2.4 Bioactive chemical compositions of RS
The GC–MS analysis of RS obtained at 1.5 M AC and 110 °C was characterised using an Agilent GC (7890A)-MS (5975C). The operating conditions are ion source temperature (EI) of 250 °C, interface temperature of 300 °C, pressure of 16.2 psi, time of 1.8 min, 1 μl injector in split mode and a split ratio of 1:50 with an injection temperature of 300 °C. The chemical components were identified by comparing the mass spectra obtained with those of the NIST Library (NIST II) (Belakhdar et al., 2015).
The Infrared spectra of RS (functional groups) were determined by Fourier Transform Infrared (FTIR) Spectra (NICOLET iS5, Thermo Scientific) in the range of 4000–400 cm−1, and was presented as percentage transmittance against wavenumbers.
3 Results and discussion
3.1 Acid hydrolysis of the CP
Fig. 1a shows the RSC recovered over time at 70, 90 and 110 °C, and AC of 0.5, 1.0, and 1.5 M. The RSC increases steadily till 80 min and plateau to 120 min, except at 0.5 M where the RSC increases steadily until 100 min. The maximum RSC of 43.01, 45.89 and 47.70 g/l were obtained at 0.5, 1.0, and 1.5 M AC, respectively at 120 min and 110 °C. Furthermore, RSC increases as the temperature increases from 70, 90 and 110 °C, as a higher temperature result to faster degradation of complex sugars and frequent collision between molecules (Wijaya et al., 2014; Muhaimin and Sri, 2017). The trend of the results is similar to those reported in the literature for different hydrolysis of cellulose (Chen et al., 2018). Fig. 1b shows the RSC recovered over time at different AC of 0.5, 1.0, and 1.5 M by different temperatures of 70, 90 and 110 °C. From the figures, RSC increases as AC increases from 0.5 to 1.0 M, and a marginal increase occurred between 1.0 and 1.5 M AC. The RSC increase is attributed to the ease of hydrolysing CP at higher AC of 1.0 and 1.5 M.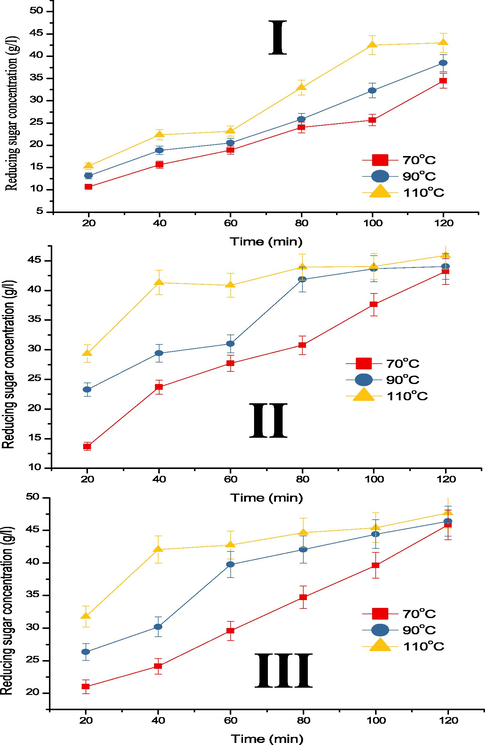
RSC over time at different temperature and acid concentrations of (I) 0.5, (II) 1.0, and (III) 1.5 M.

RSC over time at different acid concentration and temperatures of (I) 70, (II) 90, and (III) 110 °C.
The correlation between AC (0.5, 1.0 and 1.5 M) and temperature (70, 90 and 110 °C) on the hydrolysis was analysed by ANOVA and presented in Table 1. The F-statistics values of 3.6966, 3.9132, and 4.2498 (F critical = 3.6823) with their corresponding p-values of 0.04, 0.04, and 0.03 (p < 0.05) for 0.5, 1.0 and 1.5 M, respectively at constant temperature (70/90/110 °C) were obtained and suggest significant effect of AC on the hydrolysis. The F-statistics obtained at various temperature of 70, 90 and 110 °C at constant AC (0.5/1.0/1.5 M) were 1.1010, 2.6716, and 1.3002 (F crit = 3.6823) with their corresponding p-values of 0.36, 0.10, and 0.30 ((p > 0.05), respectively. These results indicate an insignificant effect of temperature on the hydrolysis. *F crit. = 3.68232.
Variable Parameters
Constant Parameters
SS
df
MS
F
P-value
Acid concentrations of 0.5, 1.0 and 1.5 M
Temperatures (°C)
70
597.8784
2
298.9392
3.696636
0.049523
90
607.8331
2
303.9166
3.913175
0.042895
110
559.24
2
279.62
4.249794
0.034493
Temperatures of 70, 90 and 110 °C
Acid concentrations (M)
0.5
211.0225
2
105.5113
1.100977
0.357974
1.0
394.2468
2
197.1234
2.671626
0.101749
1.5
139.2864
2
69.64319
1.300272
0.301466
3.2 Kinetic analysis
Table 2 presents k, coefficient of regression (R2) and adjusted R2 (adj. R2) for the hydrolysis. The results were obtained by fitting the experimental data into Eq. (13) as shown in Fig. 2(a-c). The k (min−1) obtained for 0.5, 1.0 and 1.5 M AC at constant temperature (70/90/110 °C) was 0.00051, 0.00063 and 0.00117; 0.00080, 0.00102 and 0.00236; and 0.00091, 0.00113, and 0.00247, respectively. The corresponding R2 values of 0.991, 0.992 and 0.987; 0.993, 0.992 and 0.974; and 0.994, 0.996 and 0.982, and adj. R2 of 0.97, 0.980 and 0.968; 0.982, 0.981 and 0.939; and 0.984, 0.991 and 0.957 were obtained. The rate of RS formation increased with an increase in AC and temperature. Hence, the highest k of 0.00247 min−1 was achieved at 1.5 M and 110 °C. Liu et al. (2012) observed similar k value (0.0026 min−1) for sweet sorghum bagasse hydrolysis at 120 °C. Therefore, the results obtained showed good fits of the model with a great prediction of both R2 and adj. R2 in the range of 0.957–0.996. This indicates that between 95.7% and 99.6% of the experimental data suit the model and theoretically suggests that the hydrolysis fit the first-order reaction. *Acid is the Acid concentrations of H2SO4 and Temp. is the temperatures of the hydrolysis; SS is the Sum of Squares; R2 is the coefficient of regression and Adj. R2 is the Adjusted coefficient of regression, and SE is the Standard Error.
Process Conditions
SS
R2
Adj. R2
Slope (k)
SE
Acid (M)
Temp. (°C)
0.5
70
0.047
0.991
0.979
0.00051
0.00861
90
0.073
0.992
0.980
0.00063
0.01085
110
0.250
0.987
0.968
0.00117
0.01595
1.0
70
0.117
0.993
0.982
0.00080
0.01472
90
0.231
0.992
0.981
0.00102
0.01959
110
1.111
0.974
0.939
0.00236
0.02393
1.5
70
0.189
0.994
0.984
0.00091
0.01978
90
0.151
0.996
0.991
0.00113
0.02279
110
1.015
0.982
0.957
0.00247
0.02741
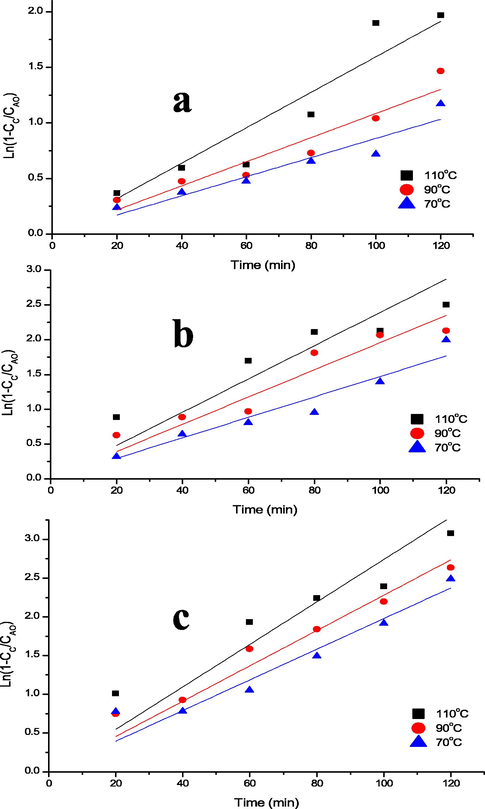
Determination of Rate Constant at Different Acid Concentrations of a) 0.5 b) 1.0 and c) 1.5 M.
3.3 Thermodynamic analysis
The k obtained at different temperature were utilised to evaluate the Ea and A using Arrhenius Equation. Fig. 3(I–III) presents the Arrhenius plot of the AC at different temperatures. The ΔH, ΔS, and ΔG for AC at different temperatures were computed using their relevant equations. The results obtained are presented in Table 3 with values of Ea and A as 16.7, 13.3 and 8.9 kJmol−1, and 2.96, 1.57, and 0.44 for 0.5, 1.0 and 1.5 M AC, respectively. The least Ea was obtained at 1.5 M, which shows that AC significantly affects the hydrolysis. These low values of Ea showed easy hydrolysis of CP, indicative of catalyst effectiveness to drastically increase reaction rate (Sarma et al., 2014).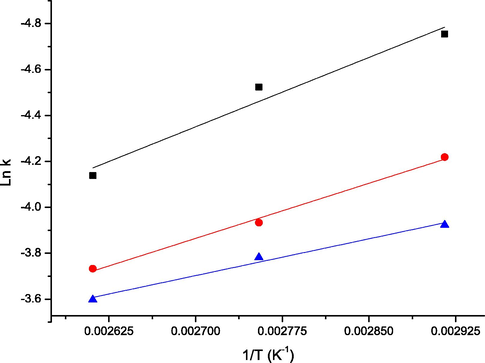
Plot of Arrhenius Equation to Evaluate Activation Energy and Frequency Factor.
Acid (M)
A
Ea (kJmol−1)
ΔH (kJmol−1)
−ΔS × 10 (Jmol−1)
ΔG (kJmol−1)
0.5
2.96
16.7
13.90
13.70
13.60
7.65
7.58
7.51
40.10
41.20
42.30
1
1.57
13.3
10.40
10.30
10.10
7.56
7.49
7.42
36.40
37.50
38.50
1.5
0.44
8.9
6.03
5.86
5.69
7.38
7.31
7.24
31.30
32.40
33.40
The +ΔH values for the hydrolysis indicate endothermic reaction and show a decrease with the increase in temperature. This shows a relative sensitivity of this parameter to the reaction temperature in the range of 70–110 °C studied. The values of +ΔH decreases as AC increased from 0.5 to 1.5 M. At 0.5 M and 70 °C the highest energy required to hydrolyse CP (+ΔH = 13.90 kJmol−1) was obtained, however, relatively low (Tizazu & Moholkar, 2018). This shows that CP can be hydrolysed at low temperature and AC.
The −ΔS values obtained indicate high stability of the RS, since −ΔS means increasing order in the system. This result is attributed to no phase and volume change during the reaction (Tizazu & Moholkar, 2018). The −ΔS values decrease as the temperature increases from 70 to 110 °C. Similar trends were observed when AC increased from 0.5 to 1.5 M. The highest −-ΔS (7.65 × 10 Jmol−1) was obtained at 0.5 M and 70 °C, an indication of the most stable RS recovery. Generally, −ΔS obtained for all the cases are indicative of the excellent efficiency of the process in the formation of transition state or an activated complex between the catalyst and CP (Sarma et al., 2014). Furthermore, the −ΔS values implied that the activated complex is more ordered than the reactants. The low values of −ΔS indicate small values of A and as such the reaction rate is fast.
The +ΔG of the hydrolysis using different concentrations of H2SO4 at different temperatures are tabulated in Table 3. The +ΔG obtained is indicative of non-spontaneous reactions. The +ΔG values increase from 40.10 to 42.30 kJmol−1 as temperature increases from 70 to 110 °C at 0.5 M. A similar trend was observed for AC of 1.0 and 1.5 M at 70 to 110 °C. These results indicate that hydrolysis is a thermodynamically favoured process. However, the +ΔG value decreases from 40.10 to 31.30 kJmol−1 as AC increased from 0.5 to 1.5 M at 70 °C. The same pattern was noticed at 90 and 110 °C and 0.5, 1.0 and 1.5 M. A high value of +ΔG shows a slower reaction rate at a given temperature. The trends in the thermodynamic parameters obtained showed that the various AC had a significant influence on the reaction. This is similar to the report of Tizazu & Moholkar (2018) that high hydrolysis temperature and AC favour the formation of stable RS. It was observed that ΔG, ΔH, and ΔS are essential parameters in the reaction rate of hydrolysis.
3.4 Bioactive chemical and functional groups of the RS
GC–MS spectra reveal 33 peaks, indicating thirty-three chemical compounds present in the RS as shown in Fig. 4 and identified in Table 4. Among the highest percentage composition of the compound is tetradecamethylcycloheptasiloxane (26.79%) which can act as a cleaning agent. It is used in cosmetics, textile applications, and biological resistance to termites (Rani & Giri, 2016). Trimethylsilyl 2,6-bis(trimethylsilyloxy) benzoate (15.70%) is also present which is suitable as an anti-fungal and anti-bacterial agents (Muhammad et al., 2016). Heptadecanoic acid (12.57%) is applicable as an antioxidant (Mohamed et al., 2014). These and other compounds as identified in the hydrolysate (Table 4) are useful against several diseases, an indication that it is suitable in pharmaceutical, food and household chemical industries.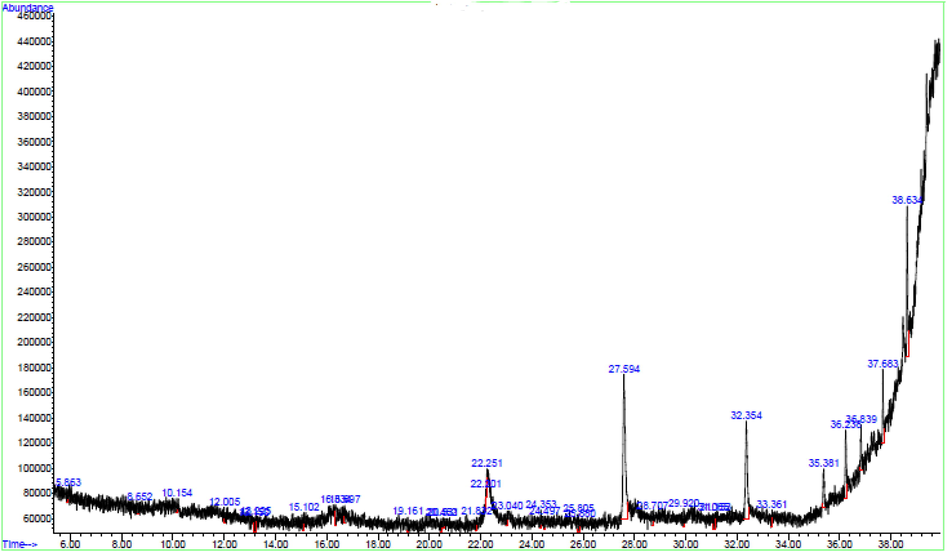
GCMS Spectra of Cassava Hydrolysate (RS).
S/N
RT
Compound name
Molecular formula
Peak area (%)
Bioactivity
1
5.149
Acetophenone 5-methoxy-2-nitro
C8H7NO4
0.92
Anti-inflammatory and analgesic. Antibacterial, fungicide, pesticide, hypnotic, perfumery, soporific (Ali et al., 2012)
2
5.863
3, 5- Dimethyl-4-chloroisoxazole
C5H6ClNO
0.94
Antioxidant and anti-inflammatory (Madhavi et al., 2010).
3
8.652
2H-1-Benzopyran, 2,2-diphenyl
C27H18O2
0.81
Antimicrobial and the antioxidant (Hamdi et al., 2008)
4
10.154
4,6-Bis(diethylamino)-1,3,5-triazine-2-carbonylhydrazide
0.97
5
12.005
1,4-Anthracenedione
C14H8O2
0.84
Antimicrobial, antifungal, hypotensive, analgesic, antimalarial, antiviral, antileukemic and mutagenic (Komal et al., 2017)
6
13.150
[1,2,4] Triazolo [1,5-a] pyrimidine-6-carboxylic acid, 4,7-dihro-7-imini-, ethyl ester
C5H4N4
0.94
Antibacterial, anticancer and anti-oxidant (Suwito et al., 2018)
7
13.225
2-Cyclopenten-i-one, 3 Methyl
C6H8O
0.81
Decorative cosmetics, fine fragrances, shampoos, toilet soaps and other toiletries as well as in non-cosmetic products such as household cleaners and detergents (Belsito et al., 2012).
8
15.102
2-(4,7-dimethyl-quinazolin-2-ylamino)-6-methyl-pyrimidin-4-ol
C15H15N5O
1.06
Antibacterial, antifungal, antiviral, anticancer, antitubercular, antitumor, anti-HIV, analgesic, anti-inflammatory and central nervous system depressant (Ajani et al., 2015).
9
16.334
1H-pyrrole-2,5-dione, 1-(4-chlorophenyl)-
C10H6ClNO2
1.82
Management of vascular diseases such as restenosis and atherosclerosis. Anti-tubercular, anti-malarials, anti-bacterial, anti-tumor agents, larvicides and molluscicides, herbicides, antifungal, antiprotozoal, antiangiogenic, analgesic, anti-stress agents, cytotoxic, DNA binding and apoptotic inducing (Sunita et al., 2017).
10
16.697
Pyridine,1,2,3,6-tetrahydro-1-methyl-4-[4-chlorophenyl]-
C12H14ClN
0.90
Anti-amnesic and anti-dyskinetic (Huot et al., 2012)
11
19.161
5-Methyl-2-phenyindolizine
C15H13N
1.82
Antibacterial, antifungal, antitumor, antiviral, and antioxidant (Saundane et al., 2013). Anti-inflammatory and analgesic (Abdellatif et al., 2016).
12
20.531
4-(1H-Tetrazol-5-yl)-1,2-benzenediol
C7H6N4O2
0.83
Anticancer, antioxidant, anti-inflammatory, antiviral, and antihypertensive (Biradar and Naraboli, 2017).
13
21.832
Phenol, 4-[2-(5-nitro-2-benzoxazolyl) ethynyl]-
C15H10N2O4
0.85
Antimicrobial, central nervous system activities, antihyperglycemic potentiating activity, analgesic, and anti-inflammatory activity (Jyothi and Merugu, 2017).
14
22.201
Cyclohexasiloxane, dodecamethyl-
C12H36O6Si6
1.04
Antimicrobial (Sheeba and Viswanathan, 2014)
15
22.251
1H-1,2-dithiolo[3,4-c] quinoline, a, 4,5,9b-tetrahydro-1-(3-fluorophenylimino)-4,4,7-trimethyl-
C9H7N
1.86
Anti-schistosomal agent, HIV-1 (AIDS) virus replication inhibitor, chemoprotective agent, fungicide and insecticide (Manahelohe et al., 2015).
16
23.040
2-Myristynoyl-glycinamide
C16H28N2O2
1.11
Antimicrobial (Saikarthik et al., 2017).
17
24.353
1H-1 3-Benzimidazole-1-acetonitrile
C10H9N
1.21
Antimicrobial, anticancer, inflammatory, antiviral, antiparasitic, antiprotozoal, anti-helminthic, protein kinase inhibitors and H+/K+ATPase inhibitors (Noolvi et al., 2014)
18
24.497
2 Methyl-5,5-diphenyl-4-(methylthio)imidazole
C16H14N2
0.95
Antimicrobial, antitumor, anti- HIV, anticonvulsant, antitubercular, antiprotozoal and anti-inflammatory; anaesthetic, and diuretic (Bhongade et al., 2016)
19
25.805
1,2-Benzenediol, 3,5-bis(1,1-dimethylethyl)
C14H22O2
0.82
Anticancer (breast), Antioxidant, Pesticides (Manorenjitha et al., 2013)
20
27.594
Tetradecamethylcycloheptasiloxane
C14H42O7Si7
26.79
It can act as cleaning agents, cosmetics, textile applications, antifungal and as biological resistance to termites. It is useful as an antioxidant, flavour, and hypocholesterolaemia (Rani and Giri, 2016).
21
28.707
Cyclohexa-2,5-diene-1,4-dione
C6H4O2
1.09
Antibiotic, antitumor, antimalarial, antineoplastic, anticoagulant, and herbicidal (Sudhakar et al., 2014)
22
29.920
4,4-Dimethyl-2-pentynal
C7H10O
1.04
23
31.065
Pyrido [2,3-d] pyrimidine, 4-phenyl
C13H9N3
1.08
Antitumor, antiviral, antimycobacterial, anticancer, diuretics, anticonvulsant, antitumor, antiallergic agent, antiphlogistic, CNS depressant, antitussive, coronary vasodilator, antihypertensive, antiarrhythmic agent, immunosuppressing agent, antispasmodic, cardiovascular, antiepileptic, anxiolytic agent, anti-asththaminitics, antitubercular, anti-HIV (Chaudhari, 2011).
24
31.153
1-Methyl-2-phenyl benzimidazole
C14H12N2
1.04
Antiulcer, anthelmintic, antimicrobial, antiviral, anticancer, anti-inflammatory, analgesic (Salahuddin et al., 2017)
25
32.354
Trimethylsilyl 2,6-bis(trimethylsilyloxy)benzoate
C13H22O3Si2
15.70
Anti-fungal, anti-bacterial (Muhammad et al., 2016)
26
33.361
Silicic acid, diethyl Bis (Trimethylsilyl) ester
C10H28O4Si3
1.18
Antibacterial activity (Juliet et al., 2018)
27
35.381
Monoamide, N-(2,4-dimethoxyphenyl)-, butyl ester
C17H25NO5
3.50
Anti-microbial, anti-fungal, anti-tubercular, anti-inflammatory, anti-convulsant, anticancer, anti-viral, angiotensin converting enzyme (ACE) inhibitory, neuroprotective, cholecystokinin-1 receptor antagonist, and estrogen receptor (ER) ligand activity (Naim et al., 2016)
28
36.238
Cyclononasiloxane octadecamethyl
C18H54O9Si9
7.33
Antimicrobial, cancer preventive, and chemo preventive. It possesses antioxidant activity, useful in food and pharmaceuticals industries, as well as in traditional medicine (Sagaya and Rani, 2016).
29
36.839
Silane dimethyl
C2H6Si
3.03
It can modify the material surfaces to prolong sustainable antibacterial activity. The material synthesized with silane coupling agents could be used as antibacterial agents in preventing hospital-acquired infections, bioengineering, water treatment, sterilization, environmental protection. It can be used to provide durable antimicrobial protection for materials (Yoshino et al., 2011).
30
37.683
Pentasiloxane, dodecamethyl-
C12H36O4Si5
5.18
Antimicrobial, Antiseptic, Hair Conditioning Agent, Skin- Conditioning Agent-Emollient; Solvent (Fatima and G.R., 2016).
31
38.634
Heptadecanoic acid
C17H34O2
12.57
Antioxidant (Mohamed et al., 2014)
The peak spectra obtained in the region of infrared radiation are shown in Fig. 5 and the values presented in Table 5. The band at 3426.91 cm−1 shows the presence of O–H stretch free, indicative of presence of water in the RS. The band at 2942.48 cm−1 shows the presence of C–H, which indicates rich lipid in CH2 functional group (Ogbaga et al., 2017). The bands at 2318.73 and 2059.10 cm−1 correspond to strongly –OH-bonded and transition metals, respectively. The presence of –OH indicates that the RS contains alcohol, as such it is efficient in biofuel production (Madukosiri, 2013). It is worthy of note that free O–H and bonded O–H groups in polymeric compounds were also present in the RS (Mohd-Asharuddin et al., 2017). The peak at 1634.83 cm−1 shows the presence of C⚌O stretching which implies carbonyls, and aldehyde. Aldehyde is used in household chemicals such as sterilant, disinfectant, and fungicide (Ofora et al., 2014; Sharif et al., 2015; Khan et al., 2018). The spectra in the fingerprint region of 1413.19 cm-1indicate the presence of C–H in the form of CH3 with medium intensity which is of the alkane group (Sebayang et al., 2017), and O–H phenolic at 1337.20 cm−1. The C-O stretch at 1197.89 cm−1 may be assigned to C-O stretching vibration from alcoholic groups, which is the evidence of the existence of carboxylic (Jorgettoa et al., 2014). Meanwhile, peak at 1102.90 cm−1 exhibits carboxylic acid ester, an excellent antifungal compound. The C-O-C at 1023.75 cm−1 and 627.97 cm−1 for C-Cl/β-glycosidic show the bond between sugars (Shah et al., 2015). The C-O-C functional group in RS indicates the presence of carbohydrates, which are dominated by vibrations of C-O-C or C-O functional groups (Ogbaga et al., 2017). However, the C-O-C stretching at 1023.75 cm−1 could also mean the presence of unconverted polysaccharides in the hydrolysate (Buensanteai et al., 2012). Therefore, the peaks at 2942.48, 1634.83 to 1337.20 and 1102.90 to 1023.75 cm−1 correspond to lipids, amides, and carbohydrates, respectively. According to Mohd-Asharuddin et al. (2017), CP was reported to have contained some of the functional group in the hydrolysate which includes symmetric or asymmetric stretching of CH, CH2 of aliphatic acids, stretching vibration of C⚌O bond of carboxyl groups, stretching vibration of ionic carboxylic groups and C-O stretching of COOH. Therefore, CP hydrolysate contained essential compound suitable for medicinal, pharmaceutical, food and beverages purposes.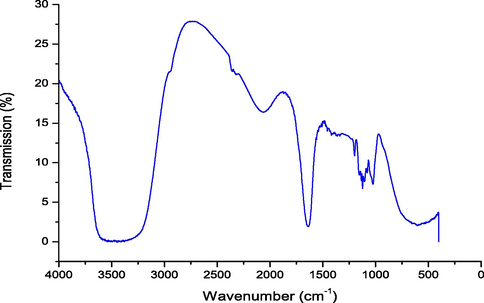
FTIR Spectra of Cassava Hydrolysate (RS).
Region
Wavenumber (cm−1)
Functional group
Inference
X–H stretching
3426.91
O–H stretch free
Alkanols, phenols, and AROH
2942.48
C–H stretch
Alkyl groups CH3, CH2, CH
Triple-bond
2318.73
Strongly –OH- bonded
Alkanols, ROH
2059.10
Carbonyl stretches
Transition metals
Double-bond
1634.83
C⚌O stretch
Carbonyl, and aldehyde
Fingerprint
1413.19
C–H in the form of CH3
Alkane group
1337.20
O–H phenolic
Aromatic hydrocarbon
1197.89
C-O stretch
Ketone
1102.90, 1118.73, 1150.40
O-C⚌O
Carboxylic acid
1074.41
CH2OH or C-O stretch
Ethers, R-O-R
1023.75
C-O-C
Ether associated with carbohydrates
627.97
C-Cl
β-glycosidic
4 Conclusions
Kinetics of CP hydrolysis has been modeled as a first-order, by studying the effects of AC and temperatures on the process. The model aided in identifying optimal conditions for the hydrolysis as 1.5 M and 110 °C at 120 min to give highest RSC of 47.70 g/l. The determined values of kinetic and thermodynamic parameters demonstrated that AC and temperature positively and significantly affect CP hydrolysis. The presence of bioactive chemical compounds in RS shows its suitability in the drug and food industries. The study concludes that the CP gave a high yield of RS; therefore, it is a feasible cheap alternative feedstock for RS production. Therefore, the use of CP as feedstock for RS production can resolve the challenges associated with CP disposal.
Declaration of Competing Interest
The authors declare that they have no known competing financial interests or personal relationships that could have appeared to influence the work reported in this paper.
References
- 3-Methyl-2-phenyl-1-substituted-indole derivatives as indomethacin analogs: design, synthesis and biological evaluation as potential anti-inflammatory and analgesic agents. J. Enzyme Inhib. Med. Chem.. 2016;31:318-324.
- [Google Scholar]
- Bioethanol production from waste of the cassava peel (Manihot esculenta) by acid hydrolysis and fermentation process. Int. J. PharmTech Res.. 2014;6:1209-1212.
- [Google Scholar]
- Exploration of the chemistry and biological properties of pyrimidine as a privilege pharmacophore in therapeutics. Int. J. Biol. Chem.. 2015;9(4):148-177.
- [Google Scholar]
- Anti-inflammatory and analgesic activities of acetophenone semicarbazone and benzophenone semicarbazone. Asian Pacific J. Tropical Biomed.. 2012;2:S1036-S1039.
- [Google Scholar]
- Determination of some bioactive chemical constituents from Thesium humile Vahl. J. Mater. Environ. Sci.. 2015;6:2778-2783.
- [Google Scholar]
- A toxicologic and dermatologic assessment of cyclopentanones and cyclopentenones when used as fragrance ingredients: a review. Food Chem. Toxicol.. 2012;50:S517-S556.
- [Google Scholar]
- Biological activities of imidazo[2,1-b][1,3,4]thiadiazole derivatives: a review. J. Saudi Chem. Society. 2016;20:S463-S475.
- [Google Scholar]
- Synthesis, characterization and biological evaluation of indole derivatives bearing benzimidazole/benzothiazole moiety. Int. J. Pharm. Pharmaceut. Sci.. 2017;9:128-138.
- [Google Scholar]
- The FTIR spectroscopy investigation of the cellular components of cassava after sensitization with plant growth-promoting rhizobacteria, Bacillus subtilis CaSUT007. African J. Microbiol. Res.. 2012;6:603-610.
- [Google Scholar]
- Synthesis and biological studies of Trihydro pyrido [2, 3-d] pyrimidines 6 –carbonitrile. Int. J. Life Sci. Pharm. Res.. 2011;1:71-76.
- [Google Scholar]
- 6 – Lignocellulose biorefinery process engineering. In: Chen H., ed. Lignocellulose Biorefinery Engineering. Woodhead Publishing; 2015. p. :167-217.
- [Google Scholar]
- Enhanced hydrolysis of cellulose in ionic liquid using Mesoporous ZSM-5. Molecules. 2018;23:1-10.
- [Google Scholar]
- Utilization of cassava wastes for value-added products: an overview. Int. J. Scientific Eng. Sci.. 2019;3(1):31-39.
- [Google Scholar]
- Fatima, A.P.M., G.R., S., 2016. Phytochemical screening and GC-MS analysis in ethanolic leaf extracts of Ageratum conyzoides (l.). World J. Pharmaceutical Research 5, 1019-1029.
- Synthesis, structure, antimicrobial and antioxidant investigations of dicoumarol and related compounds. Eur. J. Med. Chem.. 2008;43:2541-2548.
- [Google Scholar]
- L-745,870 reduces l-dopa-induced dyskinesia in the 1-Methyl-4-phenyl-1,2,3,6-Tetrahydropyridine-lesioned macaque model of parkinson’s disease. J. Pharmacol. Experim. Therap.. 2012;342:576-585.
- [Google Scholar]
- Cellulose and hemicellulose hydrolysis models for application to current and novel pretreatment processes. Appl. Biochem. Biotech.. 2000;84–86:81-96.
- [Google Scholar]
- Cassava root husks powder as a green adsorbent for the removal of Cu(II) from natural river water. Appl. Surf. Sci.. 2014;288:356-362.
- [Google Scholar]
- Evaluation and comparison of phytochemical, GC-MS and FTIR analysis of wild and micro propagated Cadaba fruticosa (L.) World J. Pharmaceut. Res.. 2018;7:746-760.
- [Google Scholar]
- An update on the synthesis of benzoxazoles: a review. Asian J. Pharmaceut. Clin. Res.. 2017;10:48-56.
- [Google Scholar]
- Fourier-transform infrared spectroscopy analysis and antifungal activity of methanolic extracts of Medicago parviflora, Solanum nigrum, Melilotus alba and Melilotus indicus on soil-borne phytopathogenic fungi. Pakistan J. Botany. 2018;50:1591-1598.
- [Google Scholar]
- A gold ornamental plant –Rubia cordifolia: a review. Pharma Sci. Monitor. 2017;8:157-164.
- [Google Scholar]
- Use of kinetic and thermodynamic parameters for the prevention of enzymatic browning of edible Yam Dioscorea cayenensis-rotundata cv. “Zrèzrou”. Int. J. Curr. Microbiol. Appl. Sci.. 2017;6:4176-4187.
- [Google Scholar]
- Dilute acid hydrolysis of lignocellulosic biomass. Chem. Eng. J.. 2010;156(2):395-403.
- [Google Scholar]
- Kinetic model analysis of dilute sulfuric acid-catalyzed hemicellulose hydrolysis in sweet sorghum bagasse for xylose production. Ind. Crops Prod.. 2012;38:81-86.
- [Google Scholar]
- Hydrolysis kinetics in anaerobic digestion of waste activated sludge enhanced by α-amylase. Biochem. Eng. J.. 2012;62:17-21.
- [Google Scholar]
- Synthesis and evaluation of 3-methyl-4-nitro-5-(substituted styryl) isoxazoles for antioxidant and anti-inflammatory activities. Res. J. Pharm. Biol. Chem. Sci.. 2010;1:1073-1082.
- [Google Scholar]
- Comparative study of some varieties of cassava grown and consumed in Bayelsa State as prospective biofuel and energy food sources. Int. J. Agric. Pol. Res.. 2013;1:156-165.
- [Google Scholar]
- Synthesis of hydroquinoline-1H-1,2-dithio-1-thiones and thioamides Section. Eur. Chem. Bull.. 2015;4:350-355.
- [Google Scholar]
- The GC-MS analysis of bioactive components of Ficus religiosa (linn.) stem. Int. J. Pharm. Bio Sci. (2):99-103.
- [Google Scholar]
- Use of dinitro salicylic acid reagent for determination of reducing sugar. Biotechnol. Bioeng. Symp.. 1959;5:193-219.
- [Google Scholar]
- The GC-MS analysis of phytochemical constituents in leaf extracts of Neolamarckia cadamba (Rubiaceae) from Malaysia. Int. J. Pharm. Pharmaceut. Sci.. 2014;5:123-127.
- [Google Scholar]
- A chemical and morphological study of cassava peel: a potential waste as coagulant aid. MATEC Web Conf.. 2017;103:1-8.
- [Google Scholar]
- Muhaimin, Sri, S., 2017. Kinetic study of hydrolysis of coconut fiber into glucose, International Conference on Chemistry, Chemical Process and Engineering (IC3PE). American Institute of Physics Publishing, p. 7.
- Phytochemical investigation of ethanolic extract of Pericampylus glaucus leaves from Malaysia by GC-MS analytical technique. Int. J. PharmTech Res.. 2016;9:410-416.
- [Google Scholar]
- Current status of pyrazole and its biological activities. J. Pharm. Bioallied Sci.. 2016;8:2-17.
- [Google Scholar]
- Synthesis, antimicrobial and cytotoxic activity of novel azetidine-2-one derivatives of 1H-benzimidazole. Arab. J. Chem.. 2014;7:219-226.
- [Google Scholar]
- Glucose syrup production from cassava peels and cassava pulp. Int. J. Curr. Microbiol. Appl. Sci.. 2014;3:781-787.
- [Google Scholar]
- Awareness of cassava peel utilization forms among cassava processors in rural communities of Southwest, Nigeria. Int. J. Appl. Agric. Apicult. Res.. 2015;11(1 & 2):93-102.
- [Google Scholar]
- Modification of cassava residue into carboxymethylcellulose. World Eng. Appl. Sci. J.. 2014;5:36-39.
- [Google Scholar]
- Fourier transform infrared spectroscopic analysis of Maize (Zea mays) subjected to progressive drought reveals involvement of lipids, amides, and carbohydrates. African J. Biotech.. 2017;16:1061-1066.
- [Google Scholar]
- Biowastes generation by small scale Cassava processing centres in wilberforce island, Bayelsa state, Nigeria. Greener J. Environ. Manage. Public Safety. 2013;2(1):051-059.
- [Google Scholar]
- Effect of single and sequential cellulolytic enzyme cocktail on the fermentable sugar yield from pretreated agricultural residues of Cassava. Am. J. Biomass Bioenergy. 2015;4:39-53.
- [Google Scholar]
- Screening of bio-active compounds and anticancer activity of Punica Granatum L. World J. Sci. Res.. 2016;1:06-15.
- [Google Scholar]
- Screening of bio-active compounds and anticancer activity of Punica granatum l. World J. Sci. Res.. 2016;1:06-15.
- [Google Scholar]
- Phytochemical analysis of methanolic extract of seeds of Mucuna pruriens by gas chromatography-mass spectrometry. Int. J. Pharmaceut. Sci. Res.. 2017;8:2916-2921.
- [Google Scholar]
- Thermodynamic and kinetic studies of α-amylase catalysed reaction in free and Carrageenan/Chitosan immobilized state. Asian J. Chem.. 2014;26:725-728.
- [Google Scholar]
- Synthesis antioxidant and antimicrobial activities of N-[(5′-Substituted 2′-phenyl-1H-indol-3′-yl)methylene]-5-(pyridin-4-yl)-1,3,4-oxadiazol-2-amines. J. Chem.. 2013;2013:9.
- [Google Scholar]
- Optimization of reducing sugar production from Manihot glaziovii starch using Response Surface Methodology. Energies. 2017;10:1-13.
- [Google Scholar]
- Adsorption of copper from an aqueous solution by chemically modified Cassava starch. J. Mater. Environ. Sci.. 2015;6:2573-2582.
- [Google Scholar]
- GC-MS analysis of phytocomponents in Spermacoce articularis L. f. leaf. Res. Pharm.. 2014;4:01-07.
- [Google Scholar]
- Synthesis, characterization and antibacterial activity of some new 2,5-Dimethoxy-3,6-bis (arylamino) cyclohexa-2,5-diene 1,4-diones. J. Current Chem. Pharm. Sci.. 2014;4:47-53.
- [Google Scholar]
- Synthesis and characterization of novel semicarbazide derivative of disubstituted n, n-dimethylaminomaleimide. Int. J. Chem. Phys. Sci.. 2017;6:28-34.
- [Google Scholar]
- Ethyl 5-methyl-7-(4-morpholinophenyl)-4,7-dihydrotetrazolo[1,5-a]pyrimidine-6-carboxylate. Molbank. 2018;2:1-5.
- [Google Scholar]
- Kinetic and thermodynamic analysis of dilute acid hydrolysis of sugarcane bagasse. Biores. Tech.. 2018;250:197-203.
- [Google Scholar]
- Comparative study on two-step concentrated acid hydrolysis for the extraction of sugars from lignocellulosic biomass. Biores. Tech.. 2014;164:221-231.
- [Google Scholar]
- Synthesis and antimicrobial activity of quaternary ammonium silane coupling agents. J. Oleo Sci.. 2011;60:429-438.
- [Google Scholar]


