

Translate this page into:
Investigation of electronic polarization – AC and DC conductivities of CeO2/MnO2 nanocomposite
⁎Corresponding author. punithavelan.n@vit.ac.in (N. Punithavelan)
-
Received: ,
Accepted: ,
This article was originally published by Elsevier and was migrated to Scientific Scholar after the change of Publisher.
Peer review under responsibility of King Saud University.
Abstract
The dielectric response of CeO2/MnO2 powder particle was investigated and synthesized by using hydrothermal method. X-ray diffractometer analysis helps us to determine cubic structure with average crystallite size 11.39 nm. The peak position and its correlation with transmission electron microscopy was reported here. This study's diffusive reflectance spectrum shows the particular surface area and band gap of our material was calculated as 3.78 eV. The hydrothermal process was used to make this nanocomposite. As a result, the size of its crystallites matches morphological studies of pictures produced by scanning electron microscopy quite well. The association between dielectric loss and its conductivity is reported. These findings suggest that the dielectric constant is high due to crystallite size and the participation of nancomposites. The produced composite's dielectric studies were well matched using the Maxwell-Wagner method. In lower temperatures, the manufactured composite produced significant results.
Keywords
CeO2/MnO2
Nanocomposite
Dielectrics
Maxwell-Wagner method
Rietveld analysis

1 Introduction
Ceria is one of the important semiconductor material used so far in different optoelectronic devices in sensors and photovoltaic studies. Combined semiconducting oxides of manganese dioxide doped with ceria at nano scaled dimensions exhibit electronic, optical and dielectric properties (Amanulla et al., 2021; Jayakumar et al., 2022; Kaviyarasu et al., 2016, 2015; Maria Magdalane et al., 2019). So this kind of materials received significant attention in modern days. Coupling of these two semiconducting oxides will tend to have a strong influence in their electronic structure also enhances other physical properties (Krishnan et al., 2022). The size and surface morphology of these composites play a key role in regulating their own properties, and they were synthesized using hydrothermal methods, among other methods. Nanocrystalline ceria with its dopant MnO2 possesses unique properties, widely used in various magnetic and dielectric applications (Kurajica et al., 2020). Manganese dioxide has multiple valance states and has a high magnetic capability. Manganese oxide has been supposed to be suitable electrodes in pseudocapacitor application for storage devices (Li et al., 2015). In dielectric investigations, mixing rare earth metal oxides with transition metal oxides resulted in a significant increase. The substantial capacity of storage application is reflected in the functional metal oxide with cerium oxide. Doped Manganese dioxide with the Ceria has already been reported (Ojha et al., 2017). Moreover, various synthesis methods have been done like Solid-state reaction (Wu et al., 2017), hydrothermal, Chemical route via Ultrasonication, etc., Dielectric studies and AC conductivity measurement of transparent semiconducting oxide play a significant role in the development of transducers dielectric coatings and transparent conducting electrodes for photovoltaic cells have been reported in the literature (Panimalar et al., 2022a, 2022b; Poovendran et al., 2020). The results of MnO2 doped with CeO2 studies show that the dielectric constant values were smaller than that of undoped CeO2 nanoparticles and decreased with increase in doped MnO2 were reported here (Kaviyarasu et al., 2017; Panimalar et al., 2020). Several techniques including electron beam evaporation, sputtering and spray pyrolosis have been used to obtain MnO2 doped Cerium oxide thin films (Honey et al., 2016; Nimrah et al., 2018). But this hydrothermal method of powdered nanocomposites improves the structural, electrical, optical and dielectric properties of MnO2 doped with Cerium oxide.
The objective of dopant in this application is to evaluate the impact of MnO2 carrier concentration on structural, conducting, and dielectric properties. The improvement in dielectric constant is linked to increased carrier mobility, which is a crucial part of nanoscale homogeneity (Toufiq et al., 2014). Materials containing semiconductors in the interfacial layers have now been explored. Ceria is a well-established metal oxide in rare earth elements and semiconducting material, with wide bandgap of 3.3 eV. An increase of lattice parameters with the decrease of particle size provides a specific control on oxygen vacancies. It results in higher ionic conductivity, which results in necessary changes in catalysis (Sun et al., 2012). Dielectric relaxations in the high frequency and lower frequency region mainly depend on the grain and grain boundary effect (Murugesan et al., 2015).
In this paper, we describe the hydrothermal synthesis of CeO2/MnO2 nanocomposites and the structural, morphological, optical, and dielectric analyses that shows the extent of nanocomposites. There is no deep insight into the dielectric research done with this nanocomposite material that we are aware of to the best of our knowledge.
2 Experimental method
2.1 Sample preparation
An analytical grade of Cerium (III) nitrate hexahydrate with 99.999% purity and Manganese Chloride (MnCl2) with 99.9% purity was purchased from Sisco research lab (SRL). 0.5 M of cerium nitrate and 0.05 M of manganese chloride were taken and dissolved in 25 ml of deionized water separately. 1 M solution of sodium hydroxide (NaOH) was dissolved in 10 ml of deionized water and kept in a beaker. The prepared acidic precursors cerium nitrate hexahydrate and Manganese chloride solution were stirred in a magnetic stirrer for 1 hr for a clear homogeneous solution and allowed to fall drop by drop on the NaOH solution while stirring within the magnetic stirrer until the precipitate has been formed. The residue was transferred to a 100 ml Teflon beaker and stored in the stainless steel autoclave. The autoclave was then heated in the muffle furnace for up to 12 h at 180 °C. To eliminate the volatile chemicals, the resulting residue was rinsed with distilled water after heating. Then it was dried for 1 h in a hot air oven at 120 °C, as indicated in Fig. 1.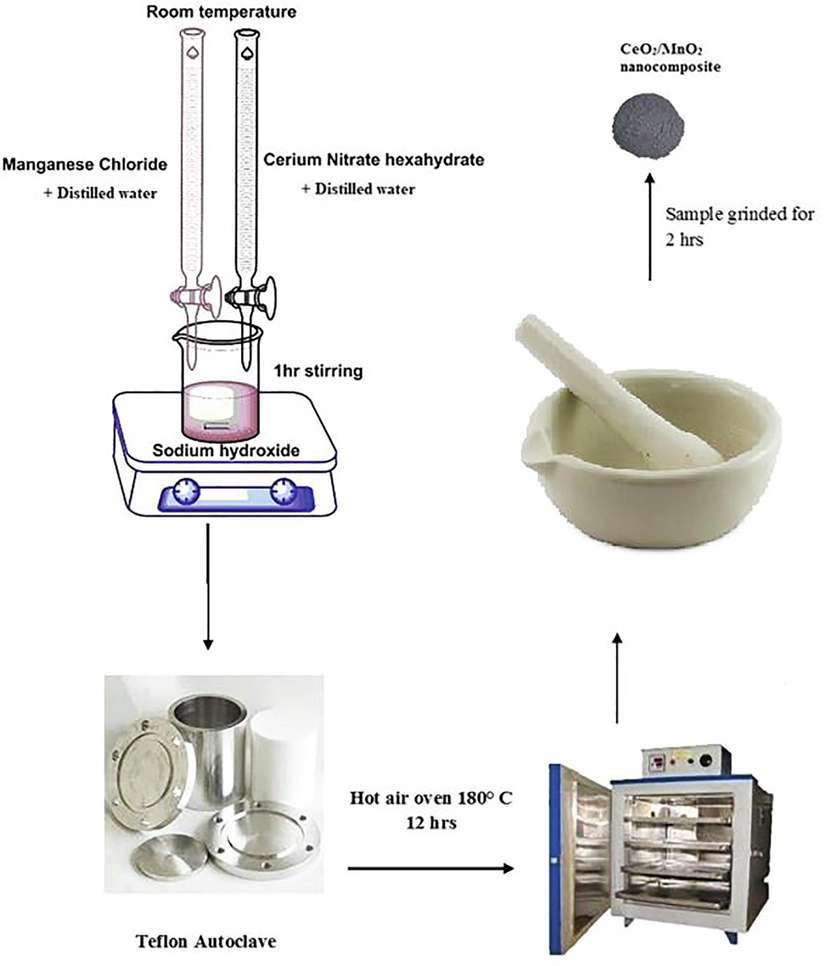
Synthesis process of CeO2/MnO2 nanocomposite.
2.2 Instrumentation technique
The synthesized nanocomposite's powder X-ray diffraction (PXRD) was carried out using Rigaku (Smart Lab) with the CuKα radiation of wavelength λ = 0.15406 nm within the diffraction angle 20-80° to confirm nanocomposites. The Rietveld analysis has been carried out using the FullProf suite software, and the structural refinements with the Pseudo-Vogit function were done. The structural development was done using the VESTA software. The Fourier transform IR spectrum (FTIR) was recorded between the ranges of 400–4000 cm−1 using a Thermo Scientific Nicolet iS10 infrared spectrophotometer. UV-Diffuse reflectance spectrometry (DRS-UV) (Thermoscientific Evolution 300 UV–Vis) was used to investigate the optical characteristics between 200 and 800 nm. The high resolution-scanning electron microscope (HR-SEM) was used for the morphological study analysis. The distribution of grain sizes was measured using the ImageJ software package. The dielectric measurements were measured using an HIOKI HITESTER model 3532–50 LCR meter at various temperatures. The pellet was prepared with 10 mm of diameter and 0.89 mm thickness to study the dielectric studies. The powder was sample kept under the applied pressure of 10 milliTorr; the pellet used the hydraulic press. The two sides pellet was coated with silver paste, and it was made as electrodes materials with two terminals. It was subjected to the frequency of 50 Hz to 5 MHz with various temperatures. The temperature started at ambient room temperature and extended up to 300° C.
3 Results and discussion
The powder X-ray diffraction examines crystallinity having cubic phases of our prepared sample and the crystallite sizes of our sample was calculated by using the Scherrer formula.
Using Debye Scherrer Equation (Cullity, n.d.), 0.89 is the Debye Scherrer constant, λ is the CuKα wavelength (0.15406 nm), β is the Full-Width Half Maximum and θ is the Braggs angle. The average crystallite size was found to be 11.39 nm. The dislocation density was estimated to be 6.54744 × 10⁻¹⁷. The lattice parameter for this cubic phases a = 5.396 Å is well agreement with the JCPDS card numbers. Manganese doxide doped with Cerium oxide were having their diffraction planes as 111, 200, 220, 311, 222, 400, 331 and 420. Manganese dioxide peaks were found at 110, 211, and 220 planes. Very small quantity of MnO2 was doped with cerium oxide which is confirmed with our XRD results. The peak positions were labeled with corresponding Bragg’s angle 2θ. The electronic structure analysis was examined by 3D visualization program of structural models by functioning of VESTA software creating the structural observation. The crystallographic information files and atomic positions of MnO2 with CeO2 and its cubic structure in the tetragonal phase is shown in Fig. 2a. The space group and its fitting of atoms in the unit cell structures with its lattice vector rotations was generated by using this diffraction simulated patterns. This simulated pattern analyses the deformation in lattice planes with atom bonds and its vectors along its positional direction. So, this software designed to investigate crystallography and unit cell structures of the powder samples. It is used to measure bonding distances and angles which were recorded in Table 2.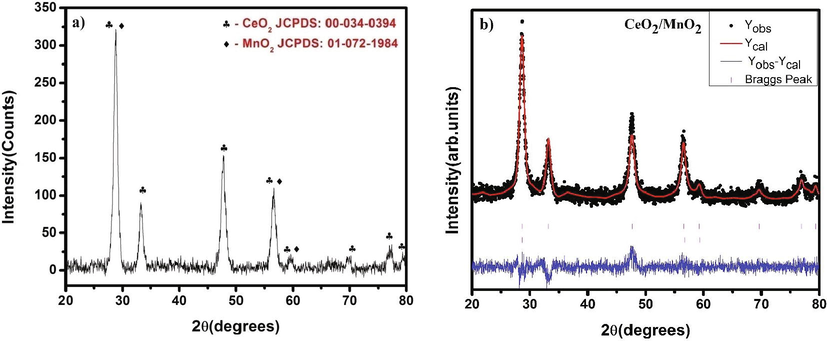
a) Powder X-ray diffraction pattern of CeO2/MnO2 nanocomposite b) Rietveld analysis of CeO2/MnO2 nanocomposite.
The FullProf software for Rietveld analysis has been used to strengthen the structural insights of the diffraction pattern, as shown in Fig. 2b. For the fit, the Pseudo-Voigt function is also used to refine the results. The predicted pattern and the observed experimental value were well matched, with a goodness of fit of 1.208. Table 1 shows the atomic locations and space group information.
Atoms
x
y
z
Biso
Occupancy
Space group
Ce
0
0
0
0.00127
1
F m 3m
O
0.25000
0.25000
0.25000
0.02533
1
Mn
0
0
0
0.00730
1
P 42/m n m
O
0.25000
0.25000
0.25000
0.00774
1
Rp = 10.4
Rwp = 13.3
Rex = 12.09
χ2 = 1.2083
Further, the lattice parameter values were recorded in Table 2. The obtained lattice parameters and cell volume are slightly lesser than the actual volume. The subtle change in the structure decreased the cell volume on both the phases and the sample densification. The oxygen atoms surrounded at the corners were Cerium atoms (Green colour) in a cubic fluorite structure and the manganese (Violet colour) in the tetragonal phase is shown in Fig. 3. The prepared sample exhibits both phases. The CeO2/MnO2 binary nanocomposite has no structural refinement to our knowledge, and it is modelled using the structure.
Atoms
a
(Å)
b
(Å)
C
(Å)α
β
γ
Cell Volume (Å)
Obtained
Actual
CeO2
5.3936
5.3936
5.3936
90
90
90
156.90
158.42
Cubic
MnO2
4.3960
4.3960
2.8710
90
90
90
55.481
55.482
Tetragonal
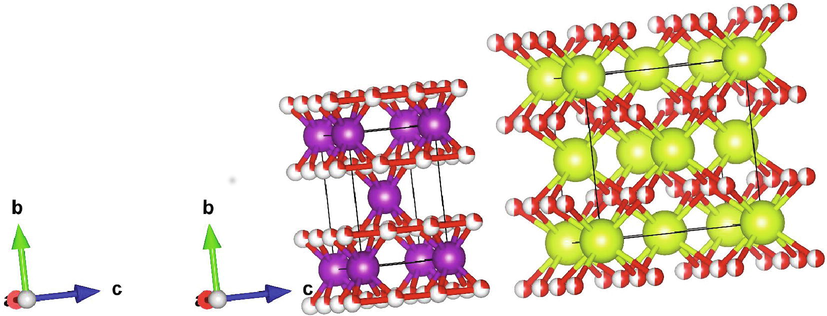
Structural formation of CeO2/MnO2 nanocomposite.
The FTIR spectrum was obtained to investigate the presence of functional groups and confirms the composition which is shown in Fig. 4. The transmittance peaks existing in the positions at 434, 532 predict the presence of O-Mn-O atoms (Ojha et al., 2017). The existence of Ce-O, Mn-O (Metal-oxygen) has been responsible for the characteristic peaks at 434, 515, and 624 (Gong et al., 2016). The presence of a peak at 1636, 1382, and 1040 cm−1 is due to O–H bending vibrations combined with Mn atom modes. The peak around 1636 cm−1 is referred to as water molecules absorbed from the atmosphere in the sample. The stretching vibrations of O–H are also implied by the broad peak at 3447 cm−1.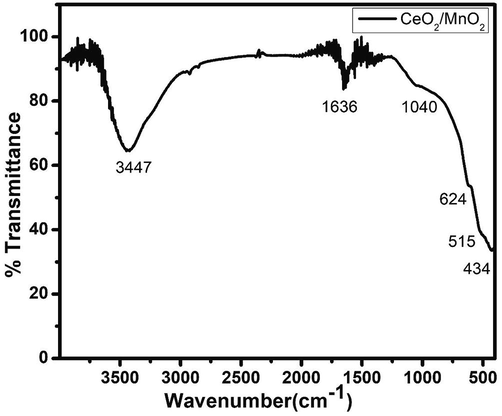
FTIR Spectra of CeO2/MnO2 nanocomposite.
The absorbance, reflectance, and energy gap values of the MnO2 doped CeO2 nanocomposite was examined using DRS-UV. The visible portion of our sample has the highest absorbance. The absorbance and transmittance value was observed for our sample, which has direct allowed transition which is shown in Fig. 5a. This semiconducting material's electron transportation between the valence band and conduction band was determined using the Tauc plot, and the band gap value is roughly identical to 3.78 eV shown in Fig. 5b. The observed value of our sample is higher than the semiconductor. The bandgap was measured based on the Kubelka-Munk function model (Zhu et al., 2006),
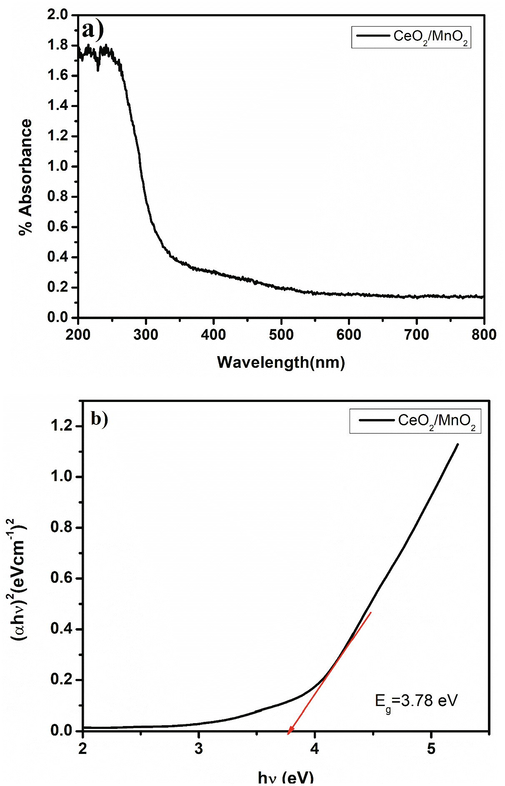
DRS (UV–Vis) spectra: a) absorbance and b) Bandgap formation of CeO2/MnO2.
Fig. 6 showed the CeO2/MnO2 sample's morphological structure was analyzed using the HR-SEM images. It can be seen that the distribution of grains is agglomerated spherical in size and the average grain sizes were measured (Dos Santos et al., 2008). Fig. 6a shows the agglomeration of the grains due to the impact of temperature dependent hydrothermal method. This may be due to the defects present in the nanocomposite. The EDAX spectra proved the presence of Ceria and manganese dioxide without the formation of any other compounds and it was taken in different areas. The obtained result was in shown Fig. 6b, and it strictly adheres to the PXRD results. The atomic percentage of MnO2 was present in the sample. Fig. 6c depicts the distribution of grain size. Further, the obtained grains size was slightly larger than the crystallite size. So, we proceeded with the HR-TEM analysis.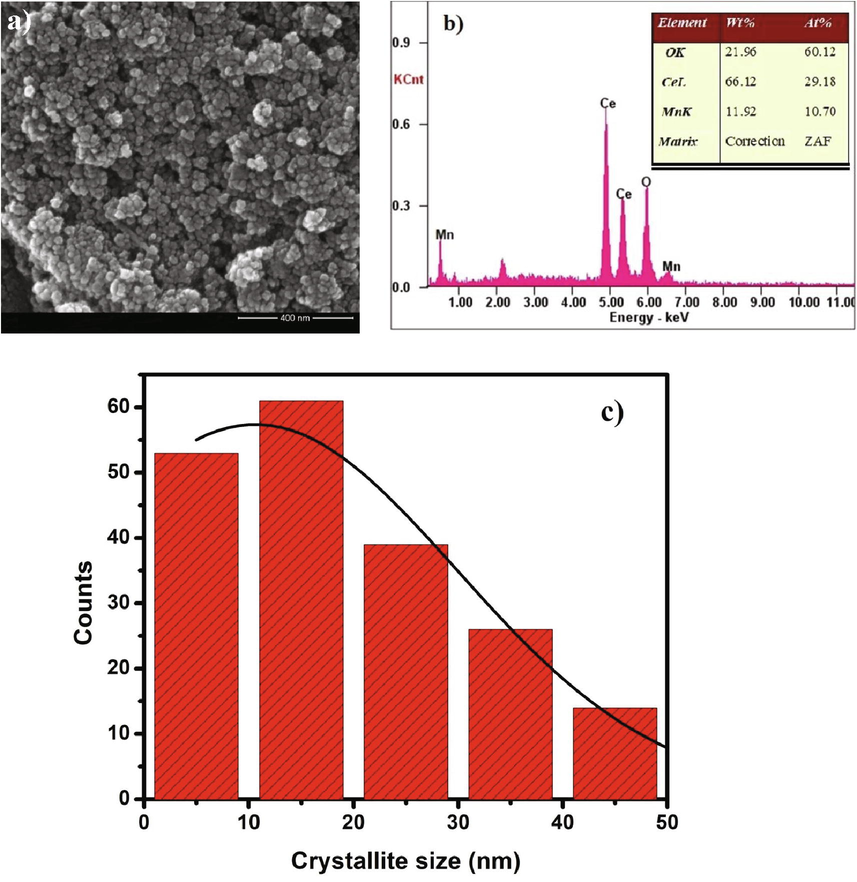
a) HR-SEM 400 nm image, b) EDAX analysis of CeO2/MnO2 nanocomposite and c) Particle size distribution graph.
The high-resolution transmission electron microscopic images are shown in Fig. 7a-d. In contrast, Fig. 7a depicted the particle dispersion. The cubical shaped particle was appeared and it could be owing to the presence of Cerium oxide. Fig. 7b shows the Ceria and Manganese oxide lattice planes with that of 2.7 Å (1 1 0) and 3.1 Å (2 0 0). The occurrence of crystalline both phases is detected in the prepared sample, which is labelled with the size depicted in Fig. 7c. The particle sizes were almost all in the 10–20 nm range. The majority of the particles were agglomerated spherical in shape, forming the nanocomposite. The SAED pattern of the CeO2/MnO2 nanocomposite is shown in Fig. 7d. The corresponding lattice planes are marked and it matches with the PXRD report.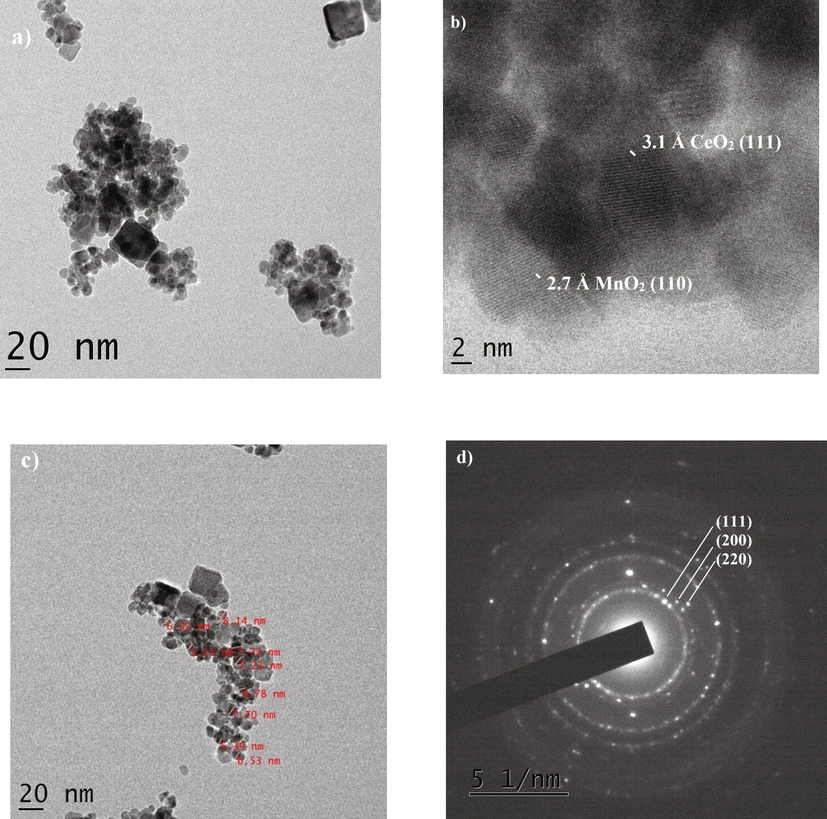
HR-TEM images of CeO2/MnO2 nanocomposite a) 20 nm image, b) d-Spacing, c) Particle size and d) SAED pattern.
In the lower frequency, interfacial polarization occurs, and the charge carriers migrate within domains externally under the applied electric field. In higher frequency, the orientation polarization occurs when the materials have the permanent dipole moment, which allows them to rotate freely. The ionic and electronic polarization is continued while increasing the applied external field (Gürbüz and Okutan, 2016).
The dielectric constant was obtained from the standard relation as follows (Manivannan et al., 2016):
The dielectric constant is the highest strength of the capacitor material, which increases the charge storage application. The dielectric constant showed an increased value when it was at room temperature, and it started to decrease for the different temperatures shown in Fig. 8a. This is due to the interfacial polarization that occurs at lower frequencies (Chen et al., 2015). The room temperature and 50 °C increase the high dielectric constant due to the larger grain boundaries and crystalline formation. The dielectric constant decreased on further improving the temperature and frequencies. This is well consistent with the Maxwell-Wagner method (Lu et al., 2006). Hence this material is suitable for storage capacity devices even at room temperature itself.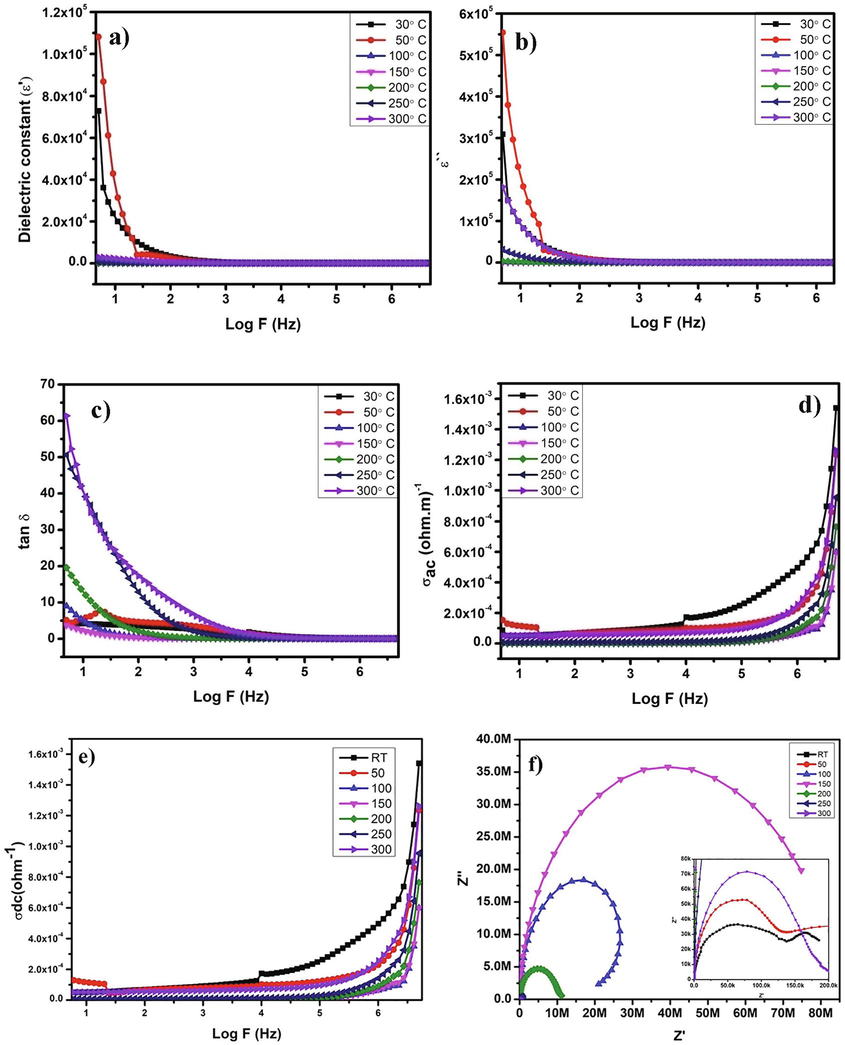
a) Dielectric constant, b) Imaginary loss, c) Dielectric loss in terms of tanδ, d) Conductivity in AC, e) Conductivity in DC and f) Nyquist plot.
The dielectric loss versus frequency region was given in Fig. 8b, and the loss was considerable at ambient temperature and 50° C, which matched the dielectric constant graph perfectly. The effect of purity and dependence of strain-free materials on the loss tangent showed a decreased value (Sebastian and Jantunen, 2008). The tangent loss is the dielectric material's charge leakage factor, which leads to a rise in loss value when temperature rises at a lower frequency, as seen in Fig. 8c. The Debye equation is being used to analyse the loss behaviour when temperature and frequency are used.
Further, the loss factor becomes constant at a higher frequency region. This is because the maximum grain boundaries were starting to gather on the nanocomposite material's surfaces. The obtained results of the AC conductivity value are consistent with the other graphs furnished in the dielectric studies. In Fig. 8d and 8e, the AC conductivity and DC conductivity graph showed the high-value range of conduction at room temperature without applying any external heat energy.
4 Nyquist plot
The bulk dielectric response were observed from the Fig. 8f, plotted in between and Z”. The appearance of the semicircle in the all over frequency region depicts the relaxation of the nanocomposite material while the electric field applied (Chandra Rao Bitra et al., 2020). From the graphical representation, the resistivity of the powder sample is exhibiting the decreased tendency while the temperature is increased. The semicircle rising in the first region is due to the sample's resistivity in various frequency regions, and it exhibited decreasing resistivity. This is because of the grain boundaries of the nanocomposite. After that the grains were involved while the external field was applied. The grain boundaries, grains and electrodes were responsible for the relaxation phenomena of the polycrystalline materials which show the rising of semicircles. The diameter of the semicircle is well formed for the 100° C, 150° C and 200° C temperatures which is having the higher range of values. Contrary the temperatures of RT, 50 °C, 250 °C and 300 °C range of temperatures showed the semicircle in shorter range. This might be attributed to relaxation phenomena and the influence of the composite due to grain boundaries, as seen in the inset picture.
5 Conclusion
A simple hydrothermal approach was used to make the CeO2/MnO2 nanocomposite. The crystal structure formation for CeO2 exhibits the cubical, and MnO2 exhibits the monoclinic system developed from the Rietveld analysis. The nanocomposite is suitable for the optical application, which has the maximum absorbance capacity and the band gap was 3.78 eV. The bulk charge carriers' conduction mechanism and hopping were heavily influenced by grain boundaries Maxwell-Wagner method is proven from the decrease of dielectric constant in the high temperature and the high-frequency region. This indicates that the CeO2/MnO2 nanocomposite exhibits better conductivity performance when compared with the other temperatures. The majority of the charge carriers were responsible for the conduction process of the nanocomposite. The oxygen vacancies produced on the samples' surface might take maximum in the higher frequency, and space-charge polarization happens in lower frequencies.
Acknowledgement
The authors sincerely thank VIT Chennai for both purchasing chemicals and characterization to carry out the research work. The authors sincerely thank STIC Cochin for providing the HR-TEM studies.
Declaration of Competing Interest
The authors declare that they have no known competing financial interests or personal relationships that could have appeared to influence the work reported in this paper.
References
- Selectivity, stability and reproducibility effect of CeM - CeO2 modified PIGE electrode for photoelectrochemical behaviour of energy application. Surfaces Interfaces. 2021;22:100835
- [CrossRef] [Google Scholar]
- Synthesis and enhanced dielectric properties of copper oxidenanoparticles. Mater. Chem. Phys.. 2020;254
- [CrossRef] [Google Scholar]
- Facile and mild strategy to construct mesoporous CeO2-CuO nanorods with enhanced catalytic activity toward CO oxidation. ACS Appl. Mater. Interfaces. 2015;7:23538-23544.
- [CrossRef] [Google Scholar]
- Cullity, B.D., n.d. Elements of X-RAY DIFFRACTION SECOND EDITION.
- Preparation and characterization of ceria nanospheres by microwave-hydrothermal method. Mater. Lett.. 2008;62:4509-4511.
- [CrossRef] [Google Scholar]
- Structural, electrical, and dielectric properties of Cr doped ZnO thin films: Role of Cr concentration. Appl. Surf. Sci.. 2016;387:1211-1218.
- [CrossRef] [Google Scholar]
- Controlled hydrothermal synthesis of triangular CeO2 nanosheets and their formation mechanism and optical properties. J. Alloy. Compd.. 2016;689:606-616.
- [CrossRef] [Google Scholar]
- H. Zhu, D. Yang, G. Yu, H. Zhang, D. Jin, K.Y., 2010. Hydrothermal Synthesis of Zn2SnO4 Nanorods in the Diameter Regime of Sub-5 nm and Their Properties 110, 7631–7634. https://doi.org/10.1021/jp060304t.
- Influence of kilo-electron-volt oxygen ion irradiation on structural, electrical and optical properties of CdTe thin films. Surf. Rev. Lett.. 2016;23:1-6.
- [CrossRef] [Google Scholar]
- Microstructural and Optical study of polycrystalline manganese oxide films using Kubelka-Munk function. Thin Solid Films. 2021;732:138796
- [CrossRef] [Google Scholar]
- Electrical and magnetic properties of nanostructured Ni doped CeO2 for optoelectronic applications. J. Phys. Chem. Solids. 2022;160:110369
- [CrossRef] [Google Scholar]
- Photoluminescence of well-aligned ZnO doped CeO2 nanoplatelets by a solvothermal route. Mater. Lett.. 2016;183:351-354.
- [CrossRef] [Google Scholar]
- Investigation on the structural properties of CeO2 nanofibers via CTAB surfactant. Mater. Lett.. 2015;160:61-63.
- [CrossRef] [Google Scholar]
- Structural, optical and magnetic investigation of Gd implanted CeO2 nanocrystals. Nucl. Instrum. Methods Phys. Res. Sect B Beam Interact. Mater. Atoms. 2017;409:147-152.
- [CrossRef] [Google Scholar]
- CuO/NiO bimetallic nanocomposite: A facile DNA assisted synthetic approach and evaluation of bio efficacy. J. King Saud Univ. - Sci.. 2022;34(1)
- [CrossRef] [Google Scholar]
- Manganese-doped, hydrothermally-derived ceria: The occurrence of birnessite and the distribution of manganese. Ceram. Int.. 2020;46:29451-29458.
- [CrossRef] [Google Scholar]
- Solution combustion synthesis of metal oxide nanomaterials for energy storage and conversion. Nanoscale. 2015;7:17590-17610.
- [CrossRef] [Google Scholar]
- Influence of the relaxation of Maxwell-Wagner-Sillars polarization and dc conductivity on the dielectric behaviors of nylon 1010. J. Appl. Phys.. 2006;100(5):054104.
- [Google Scholar]
- Photoacoustic and dielectric spectroscopic studies of 4-dimethylamino-n-methyl-4-stilbazolium tosylate single crystal: An efficient terahertz emitter. J. Cryst. Growth. 2016;455:161-167.
- [CrossRef] [Google Scholar]
- Synthesis and characterization of CeO2 nanoparticles by hydrothermal method. Mater. Today:. Proc.. 2019;36:130-132.
- [CrossRef] [Google Scholar]
- High temperature dielectric relaxation anomalies in Ca 0.9 Nd 0.1 Ti 0.9 Al 0.1 O 3−δ single crystals. RSC Adv.. 2015;5:78414-78421.
- [CrossRef] [Google Scholar]
- Synthesis and characterization of ZnS thin films prepared by resistive heating technique. Surf. Rev. Lett.. 2018;25:1-7.
- [CrossRef] [Google Scholar]
- Synthesis and characterization of reduced graphene oxide decorated with CeO2 -doped MnO2 nanorods for supercapacitor applications. J. Colloid Interface Sci.. 2017;494:338-344.
- [CrossRef] [Google Scholar]
- Effect of Ag doped MnO2 nanostructures suitable for waste water treatment and other environmental pollutant applications. Environ. Res.. 2022;205:112560
- [CrossRef] [Google Scholar]
- Reproducibility and long-term stability of Sn doped MnO2 nanostructures: Practical photocatalytic systems and wastewater treatment applications. Chemosphere. 2022;293:133646
- [CrossRef] [Google Scholar]
- Studies of MnO2/g-C3N4 hetrostructure efficient of visible light photocatalyst for pollutants degradation by sol-gel technique. Surf. Interfaces. 2020;20:100512.
- [Google Scholar]
- Functionalization effect of HAp with copper (Cu) having excellent dielectric applications. Surf. Interfaces. 2020;19:100474
- [CrossRef] [Google Scholar]
- Low loss dielectric materials for LTCC applications: a review. Int. Mater. Rev.. 2008;53:57-90.
- [CrossRef] [Google Scholar]
- Nanostructured ceria-based materials: Synthesis, properties, and applications. Energy Environ. Sci.. 2012;5:8475-8505.
- [CrossRef] [Google Scholar]
- Hydrothermal synthesis of MnO2nanowires: structural characterizations, optical and magnetic properties. Appl. Phys. A Mater. Sci. Process.. 2014;116:1127-1132.
- [CrossRef] [Google Scholar]
- Conductivity and microstructure analysis of ceria materials doped with multiple elements. Ceram. Int.. 2017;43:S747-S757.
- [CrossRef] [Google Scholar]


