

Translate this page into:
Investigation of biological accumulation and eco-genotoxicity of bismuth oxide nanoparticle in fresh water snail Lymnaea luteola
⁎Corresponding author. salarifi@ksu.edu.sa (Saud Alarifi)
-
Received: ,
Accepted: ,
This article was originally published by Elsevier and was migrated to Scientific Scholar after the change of Publisher.
Peer review under responsibility of King Saud University.
Abstract
Bismuth is one of the significant heavy metals widely used in agricultural industry. Freshwater snails are sentinel organism models for aquatic ecosystem pollution. In the present study, we designed to understand the mechanism of bismuth oxide nanoparticle (Bi2O3NPs) toxicity on Lymnaea luteola (L. luteola) by using different biomarkers. The LC50 – 96 h of Bi2O3NPs was found 72.6 µg/ml for L. luteola and based on LC50 – 96 h of Bi2O3NPs three concentrations sub lethal I ∼ 18.15 µg/ml, sub lethal II ∼ 36.30 µg/ml, and sub lethal III ∼ 48.4 µg/ml were selected for further study. The snails were exposed to above sub lethal concentrations of NPs for 7 days and specimens were harvested at 1, 3 and 7 days for assessment oxidative stress, apoptosis and eco genotoxicity. In general, Bi2O3NPs showed significant (p 0.05, 0.01) ecotoxic effect on snails in both concentrations and time of exposure. The generation ROS were maximum at sublethal III at day 7. After exposure to sublethal concentrations of Bi2O3NPs for day 1, 3 and 7 significantly elevated malondialdehyde (MDA), superoxide dismutase (SOD) and glutathione S-transferase (GST) levels with simultaneous decline in glutathione (GSH) in pancreatic gland tissues of treated snails. Moreover, Bi2O3NPs elicited a significant percentage of apoptotic/necrotic heamocyte cells hemolymph of exposed snails. A parallel tendency was seen for the fragmentation of DNA as determined in terms of the percentage of tail DNA and olive tail moment in pancreatic gland tissue of exposed snails. This study highlights the toxic perturbation of Bi2O3NPs in water bodies and may be useful to monitor the application and disposal of NPs.
Keywords
Bi2O3NPs
Lymnaea luteola
Eco-genotoxicity
Apoptosis
Oxidative stress

1 Introduction
The integrity of DNA is continuously challenged by a variety of exogenous and endogenous DNA-damaging agents. Now a days application of heavy metals are increased in industry all over the world. Metals induced toxicity in aquatic organism due to bioaccumulative nature of metals in tissues of organisms (Handy and Shaw, 2007). Due to large manufacture and huge releasing of bismuth nanoparticles (Bi2O3NPs), risk of ecotoxicity of NPs has increased in last few decades (Rand et al., 2004). The NPs has detrimental effect on living organism of aquatic ecosystem (Yassi and Kjellstrom, 1997). Bi2O3NPs run off into ponds and ocean due to rainfall. Bi2O3NPs are agglomerating in water and form macroparticles and settle down in sediment. Bismuth compounds are less cell toxic and bio accumulative in comparison to other heavy metals such as antimony, lead and arsenic (Tchounwou et al., 2012, Badireddy and Chellam, 2014). Bismuth is used in pigments and drugs, such as Pepto-Bismol (Yang and Sun, 2007). Antonio et al., (2019) reported that bismuth lipophilic nanoparticles showed antimicrobial effect. Bi2O3NPs has been used in breast cancer therapy (Junjie et al., 2018). Induction of ROS is the dominant mechanism of cellular damage for most nanomaterials due to their higher chemical reactivity. Release of metal ions from nanoparticle dissolution is another important mechanism for toxicity of some nanoparticles (Johnston et al., 2010). DNA double-strand breaks can be induced either directly by exposure to ionizing irradiation or indirectly by the topoisomerase I inhibitor camptothecin, which causes replication fork stalling and collapse in actively cycling cells (Houk and Waters, 1996). Therefore, in this study, the L. luteola species were considered ideal organisms for evaluating the toxicity of Bi2O3NPs in the sediment and water. Due to benthic locomotory activity and feeding habits snail makes them vulnerable to elevated concentration of Bi2O3NPs in the sediments. The L. luteola was used as test model because of their important role in freshwater systems as they represent a significant part of fish and waterfowl diet in the South Asian countries. This study was designed to investigate the bioaccumulation, oxidative stress and genotoxic effect of Bi2O3NPs on fresh water snail L. luteola.
2 Materials and methods
2.1 Chemicals
The bismuth oxide nanoparticles (Bi2O3NPs) was bought form US Research Nanomaterials, Inc. USA. SSB (5 mM HEPES, 3.7 M NaOH, 36 mM NaCl, 2 mM KCl, 2 mMMgCl2, 4 mM CaCl2, pH 7.8), EDTA salt, DMSO, Annexin V FITC, propidium iodide were procured from M/s. Sigma (St. Louis, MO, USA). All other chemicals were purchased from local markets.
2.2 Collection of test organism
The test organism (L. luteola L.) (average size 20 mm, average weight of 425 mg) was brought from fresh water ponds and transferred to the experimental aquarium. Snails were kept for acclimatization at 24 ± 2 °C in lab aquarium for 15 days before the start of the experiment and fish were fed daily leaves of Marsilia sps. plant.
2.3 Characterization of Bi2O3NPs
2.3.1 Scanning electron microscopy (SEM)
Morphological structural image of Bi2O3NPs were captured using scanning electron microscope (JEOL, JEM 2100F, Ltd, Tokyo, Japan).
2.3.2 Transmission electron microscopy (TEM)
Bi2O3NPs (10 mg) was suspended in MilliQ water (10 ml). The carbon coated copper grid was immersed into the suspension (100 µg/ml) of Bi2O3NPs and grid was dried in incubator for 24 h. After drying the grid, the image of nanoparticles were captured by using a transmission electron microscope at 120 kV (JEOL Inc., Tokyo, Japan).
2.3.3 Determination of DLS size of Bi2O3NPs
Bi2O3NPs (100 µg) was added in one ml in MilliQ water and sonicated at 40 W for 10 min by sonicator. The size of Bi2O3NPs NPs in suspension was measured using dynamical light scattering (DLS, Nano-Zeta Sizer-HT, Malvern, UK) as described by Ali et al., (2014).
2.4 Determination of test water parameters
Physiochemical properties of test water such as temperature, pH, dissolved oxygen, total hardness, and total conductivity were determined according APHA (2005) methods.
2.5 Determination of LC50 -96 h value and sub lethal concentrations
The lethal concentration of Bi2O3NPs on L. luteola was determined as per APHA et al., (2005) standard protocols. Bi2O3NPs (10 mg) was suspended in water (10 ml) and this suspension was considered as stock solution. Ten accustomed snails were treated to different concentrations of Bi2O3NPs (0, 5, 10, 20, 40, 80, 160, 320 µg/ml). Death of snail was counted after 24 and 96 h of exposure of Bi2O3NPs. The mortality of snail in percentage in different concentrations of Bi2O3NPs was calculated at 24 and 96 h treatment. The test water of beaker was changed and re-exposed to Bi2O3NPs after 24 h until 96 h. Test was done in triplicate to confirm the data. The median lethal concentration was evaluated by using computer software Probit analysis. Photoperiod was controlled to simulate the natural day:light cycle (12 h: 12 h). The LC50- 96 h value of Bi2O3NPs was calculated as 72.60 µg/ml for L. luteola following the probit analysis method as described by Finney (1971).
Based on the LC50- 96 h three concentrations of NPs viz., sub lethal I (1/4th of LC50 = 18.15 µg/ml), sub lethal II (1/2nd of LC50 = 36.30 µg/ml), and sub lethal III (2/3rd of LC50 = 48.4 µg/ml) were used for the sub lethal study.
2.6 Exposure of Bi2O3NPs
The L. luteola was exposed to three sub lethal concentrations of Bi2O3NPs in semi static system for 1, 3 and 7 days. Digestive glands and haemocyte were collected at 1, 3 and 7 day at the rate of 5 snails per exposure time. The fifteen snails were maintained in tap water for negative control.
2.7 Preparation of sample for ICP-MS
The digestive gland tissue (10 mg) was mingled with nitric acid (conc. HNO3, 10 ml) and perchloric acid (HClO4, 2 ml) in flask. The flak was warmed at 100 °C on hot plate in fume hood until yellowish color was faded. After cooling, 50 µl H2O2 was added. The digested sample was vaporized up to 1.5 ml and diluted with dH2O to 50 ml and filtered with Whattman filter paper. The samples were analyzed using inductively coupled plasma mass spectrometry (ICP-MS) (APHA, 2005).
2.8 Estimation of ROS in hemolymph
Intracellular ROS induction was studied by two methods: fluorometric analysis and microscopic fluorescence image. In fluorometric analysis, ROS was determined by oxidation of carboxy-H2DCFDA. After oxidation cationic dye easily included in cells and becomes fluorescent after being oxidized in the cytoplasm of cells by ROS.
After collection the hemolymph of control and exposed L. luteola and were mixed with 5 μM carboxy-H2DCFDA and incubated at RT in dark for 15 min.
Later incubation of samples, the fluorescence was determined at two wavelength 485 nm and 535 nm by applying Synergy H1 microplate reader (Omega Fluostar). The intensity of unexposed control well was assumed to be 100%.
A analogous set of experiment was carried out to determine quality intensity of ROS of hemolymph sample was analyzed for intracellular fluorescence using upright fluorescence microscope equipped with CCD cool camera (Nikon Eclipse 80i equipped with Nikon DS-Ri1 12.7-megapixel camera).
2.9 Oxidative stress
Induction of oxidative stress markers (e.g. GSH, SOD and GST) were measured by applying kits (Cayman chemical company, Ellsworth Rd, Ann Arbor, MI 48108, USA) following the manufacturer’s instructions. Lipid peroxidation (LPO) in digestive glad cells was measured by the measuring the generation of malondialdehyde (Ali et al., 2012. A mixture of 100 µl of digestive gland tissue extract, 100 µl of TCA and 1 µl of TBA were mixed and warmed in boiling water bath for 60 min. After cooling 1 ml of n-butyl alcohol was added to the test tubes and centrifuged at 3000 rpm for 10 min. The absorbance of the sample was measured at 532 nm using a blank containing all the reagents except the sample. All of the tests were performed three times.
2.10 FACs
To observe the apoptotic hemocyte cells in exposed and unexposed snails hemolymph was collected from in glutaraldehyde and resuspended in binding buffer (100 μl, 1×), allocate in FACS tube, and mixed with Annexin V-FITC (conjugated with fluorescein isothiocyanate, with 5 μl) and PI (10 μl). Later incubation for 25 min at RT in dark, 385 μl of 1× binding buffer was mixed to each tube and analysed using flow cytometer (BD LSRII analyzer, Becton Dickinson, USA) with “CELL Quest” software) immediately.
2.11 Measurement of DNA damage
Determination of DNA damage pancreatic cells of snail after treatment to NPs was measured applying Comet assay as described by F. Ali et al. (2008).
We have prepared two slides from each concentration and scored and analysed 50 cells/slide (100 cells per concentration) by using Comet software (Komet-5.0, Kinetic Imaging, Liverpool U.K.).
2.12 Statistical analysis
Data was presented as average (±SE) and statistically analysed using one way analysis of variance (ANOVA). At least two independent experiments were performed in duplicates for each exposure. The p-value less than 0.05 and 0.01 were considered statistically significant and highly significant, respectively.
3 Results
3.1 Experimental water quality
During the experiment the water quality of test water was measured and parameter such as pH of water (5.50–7.35), temperature (from 22.6 to 24.0 °C) and dissolved oxygen (DO) (6.20–8.04 mg/l were found (Table 1). Hardness of water was found 152.0–192 µg/ml as CaCO3. The Cl− level and conductivity of test water were 44.0–51.0 µg/ml and 240.5–290 µM/cm and respectively (Table 1).
Parameters
Values
pH
5.50–7.35
Temperature
22.6–24.0 °C
Chloride (µg/ml)
44.0–51.0
Dissolved oxygen (mg/l)
6.20–8.04
Total hardness (as CaCo3) µg/ml
152.0–192
Conductivity (µM/cm)
240.5–290
3.2 Characterization of Bi2O3NPs
The Bi2O3NPs were characterized using scanning electron microscope and transmission electron microscope and showed specific properties which play a specific role in the mechanisms of toxicity. We have observed the shape and size of NPs were sheet like 1 µm in SEM micrograpgh (Fig. 1a) and their average size were 43.50 ± 2.50 nm and round/rectangular shape in TEM micrograph (Fig. 1 b, c). The hydrodynamic size and zeta potential of Bi2O3NPs were 125.10 nm and −10.8 mV, respectively.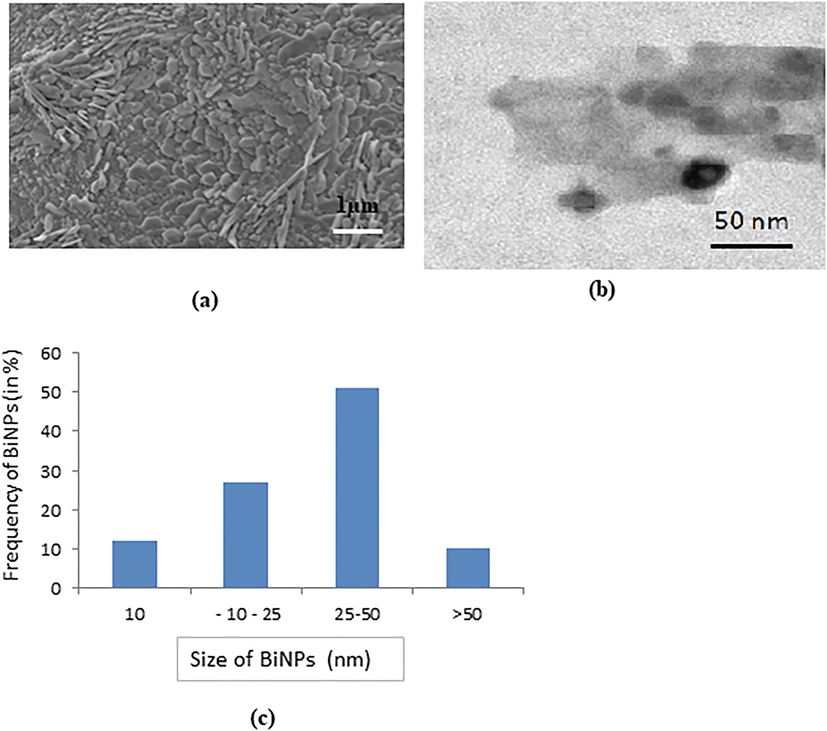
Image of BiNPs captured by (a) SEM (b) TEM (c) Percentage of BiNPs size in TEM micrograph.
3.3 Median lethal concentration
After exposure of Bi2O3NPs the mortality of snails were observed 0%, 2%, 6%,10%, 30%, 55%, 82% and 100% at control, 5 µg/ml, 10 µg/ml, 20 µg/ml, 40 µg/ml, 80 µg/ml, 160 µg/ml and 320 µg/ml of nanoparticles exposure, respectively in 96 h (Fig. 2). In this experiments we found LC50-96 h values of Bi2O3NPs for snail was 72.60 µg/ml (Fig. 2).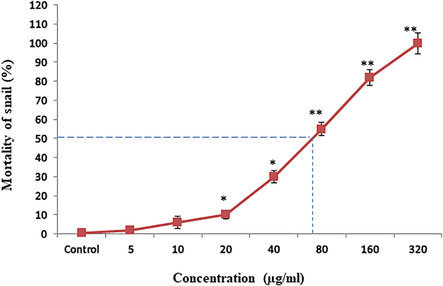
Acute toxicity of Bi3O3NPs on freshwater snail Lynmea luteola n = 3, *p < 0.05 and **p < 0.01 vs. control.
3.4 Behavioral responses of test snail
After the exposure to Bi2O3NPs, the experimental snails were moving to and fro in container and then stuck to the surface of water tank. Snails were lost their chemo sensitivity and they did not attract to food material at 320 µg/ml nanoparticles exposure. The snails were settled down on bottom of reservoir and become dead as increase concentration of Bi2O3NPs exposure in 96 h. At lower exposure concentration, there is no effect on snails and most of snails were remain at the surface of the water or attached to the wall of the container. The color of foot and shell become discolored and leading to paralysis and finally death at maximum concentration of nanoparticles exposure.
3.5 Accumulation of Bi2O3NPs in digestive gland of snail
The Bi accumulation in digestive gland of exposed snail was determined using ICP-MS and the concentration of Bi metal increase according concentration dependent manner (Table 2). All values are mean ± S.E.
Tissues
Exposure concentrations
Digestive glands
Control
Sub-lethal I
Sub-lethal II
Sub-lethal III
0.012 ± 0.001
0.03 ± 0.01
0.082 ± 0.0 16
0.104 ± 0.009
3.6 ROS generation in hemolymph and oxidative stress in digestive glands
Intracellular ROS generation in heamocyte cells was measured by using DCFDA. DCF intensity (generation of ROS) was increased significantly (p < 0.05) at lower concentration at day 1 on the other hand it increased highly significant (p < 0.01) at higher concentration at 3, 7 day in haemocyte cells (Fig. 3a-k). Level of LPO was determined by estimating the production of malondialdehyde (MDA) in hemolymph of snail. LPO level was high significantly increased (p < 0.01) at sub lethal III dose, at day 7 (Fig. 4a). GSH content was decreased according duration and dose dependent manner (Fig. 4b).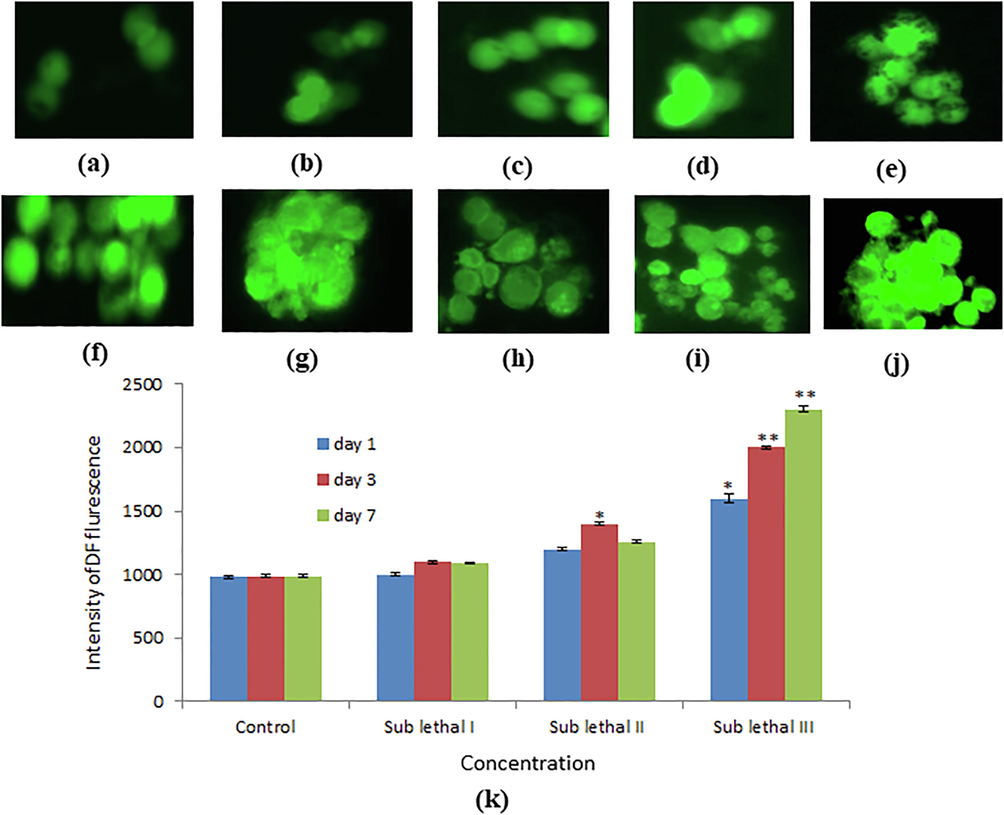
Induction of intracellular ROS generation in heamocyte cells of L. luteola after exposure to BINPs for 1, 3, 7 days. Photomicrograph of DCF intensity (ROS generation) in heamocyte cells analyzed by fluorescence microscope using DCFDA staining (a) control (b). Sub lethal I for day 1 (c). Sub lethal II for day 1 (d). Sub lethal III for day 1 (e). Sub lethal I for day 3 (1). Sub lethal II for day 3 (g). Sub lethal III for day 3 (h). Sub lethal I for day 7 (i). Sub lethal II for day 7 0). Sub lethal III for day 7 (k). Intracellular ROS generation in heamocyte cells of thrteola for different concentration of BNPs for day 1, 3 7. Each value represents the mean ± SE of three experiments. *p < 0.05 and •*p < 0.01 vs. control.
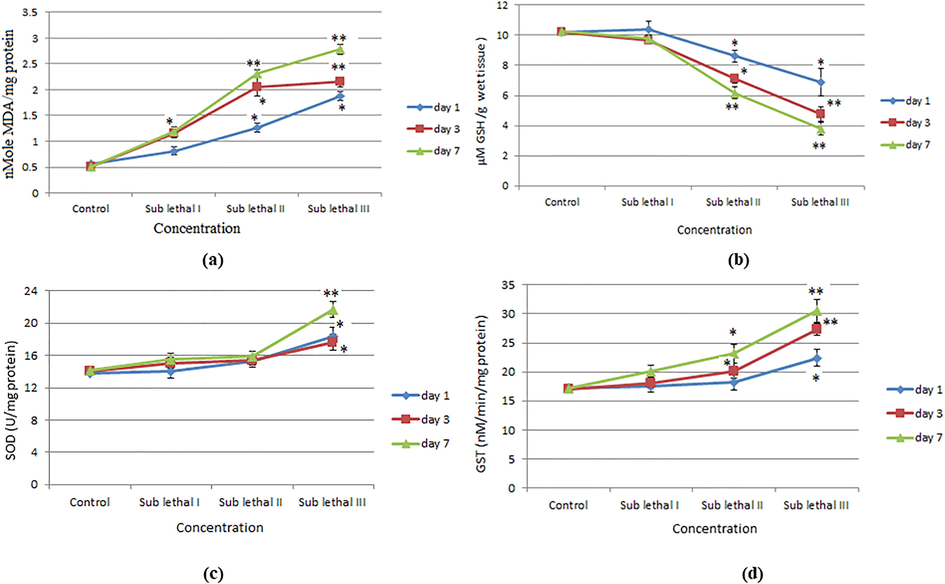
After exposure to BINPs in L. luteola for 1, 3, 7 days. (a). Level of LPO in digestive gland tissue (b). Level of GSH in digestive gland tissue (c). Level of SOD in in digestive gland tissue (d). Level of Glutathione S transferase (GST) in digestive gland tissue. Each value represents the mean ± SE of three experiments. *p < 0.05, **p < 0.01 vs. control.
The SOD level and activity of GST in hemolymph of NPs exposed snail were significantly increased at sub lethal III dose, at day 7 (Fig. 4c-d).
3.7 Apoptosis in heamocyte cells
After exposure to NPs to investigate the apoptotic/necrotic heamocyte, we have used fluorescent dye (annexin V FITC and PI). The treatment of NPs showed a significant (p < 0.01) increase in apoptotic/necrotic heamocyte cells (21.5%) as compared to control specimens (Fig. 5a-e).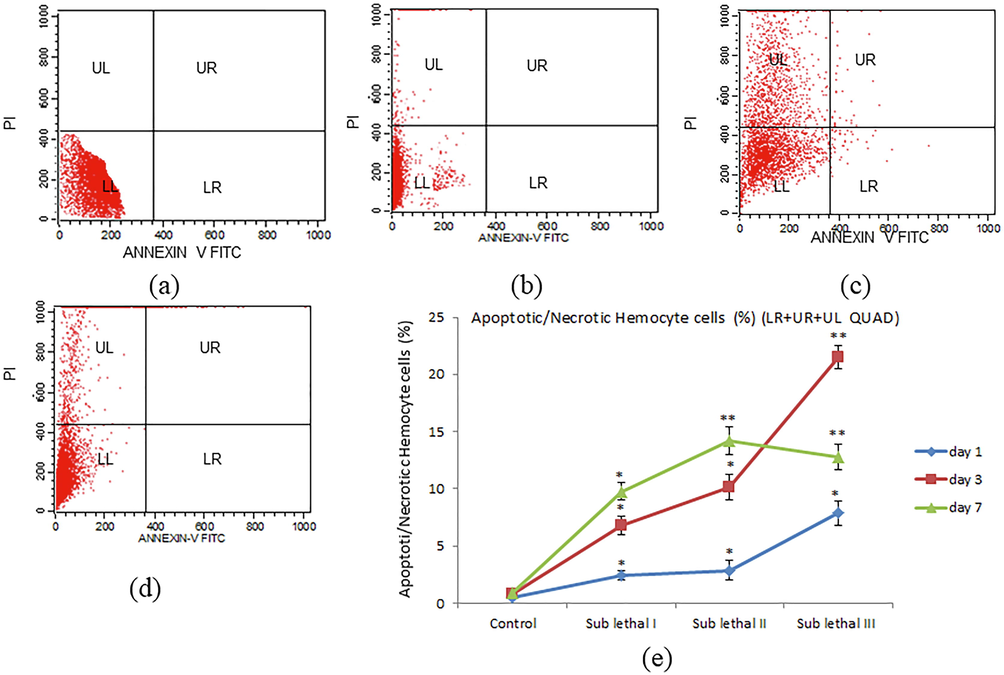
Apoptotic/necrotic heamocyte cells of thiteola after exposure to BINPs for 1, 3, 7 days. Scatter diagram of Apoptotic/necrotic heamocyte cells analyzed by FACS using Annexin V FITC and PI staining (a) control (b). Sub lethal III for day 1 (c). Sub lethal III for day 3 (d). Sub lethal III for day 7 (e). Apoptotic and necrotic cell (%) for different concentration for day 1, 3, 7. Each value represents the mean ± SE of three experiments. *p < 0.05 and **p < 0.01 vs. control.
3.8 DNA damage
DNA damage in pancreatic cells of NPs exposed snail was investigated by measuring % tail DNA and olive tail moment (Fig. 7a-i). Under the gel electrophoresis, the DNA of digestive gland cells moved faster towards the anode at sublethal III concentration of day 7 than the sub lethal I, II concentration for day 1, 3 (Fig. 7a-i). We have observed the positive correlation between reduction of GSH and induction of DNA damage for all concentration and durations (Fig. 6a-c).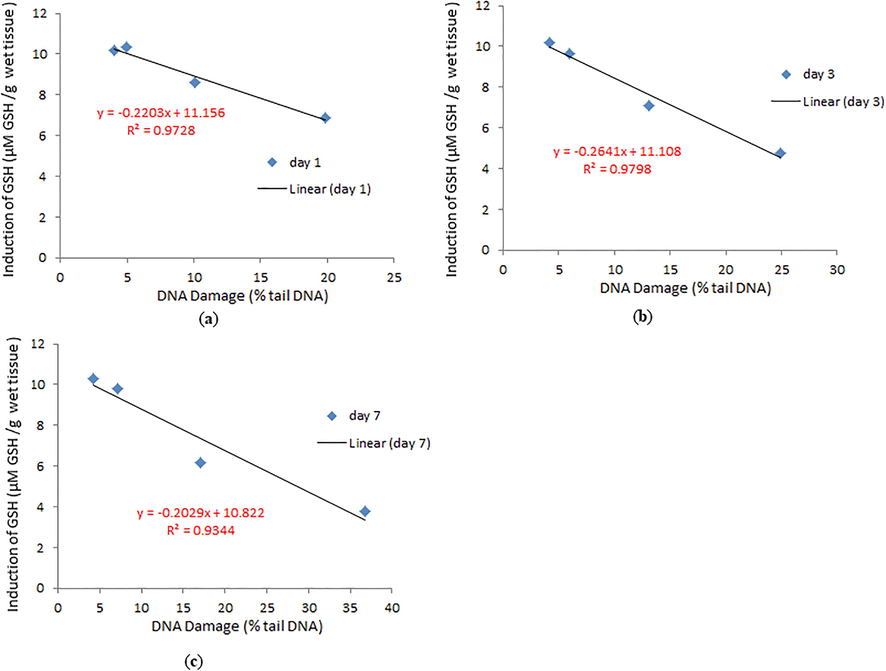
Correlation of induction of GSH and DNA damage in digestive glands of snail after exposure to control, sublethal III for (a). Day 1 (b). Day 3 (c). Day 7.
4 Discussion
The expansion of ecotoxicology has delayed behind of toxicology, nanoecotoxicological study has grown slowly than nanotoxicology. Nanoecotoxicology studies motivated on harmful effect of nanoparticles on aquatic organisms e.g. snails, fish and daphnids (Kahru and Ivask, 2013). The development of nanotechnology has recently increased extensively to such a level that nanoparticles have become an important component of domestic and industrial products (Walters et al., 2014). The freshwater gastropods L. luteola is found in south Asian countries and reported as threatened species in the world (Madhyastha et al., 2010). Freshwater snails are also an important food source for many fish, turtles, and other species of wildlife (Fig. 7).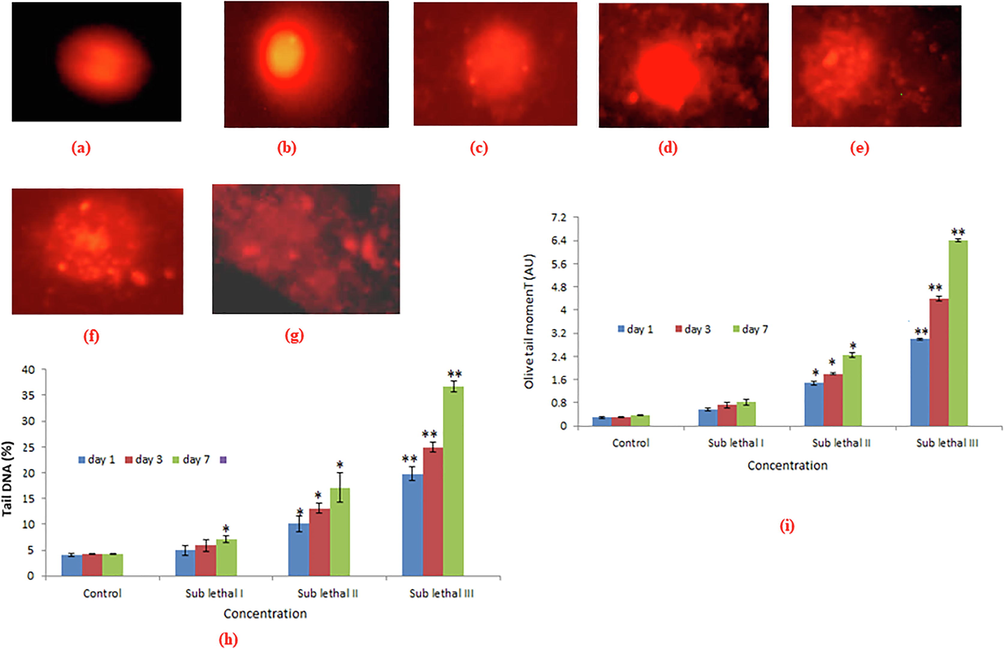
DNA damage in digestive gland tissue of L. luteola after exposure to BINPs for 1, 3, 7 days. Photomicrograph of comet assay (DNA damage) in digestive gland cells analyzed by fluorescence microscope using EtBr staining (a) control (b). Sub lethal I for day 3 (c). Sub lethal II for day 7 (d). Sub lethal II for day 3 (e). Sub lethal II for day 7 (f). Sub lethal III for day 3 (g). Sub lethal III for day 7 (10. DNA tail (%) in digestive gland cells (i). Olive tail moment in digestive gland cells. Each value represents the mean ± SE of three experiments.*p < 0.05 and **p < 0.01 vs. control.
The result of the current study showed that treatment of Bi2O3NPs changes the behavioral response of normal snail. The change in behavior of L. luteola indicates the decline of quality of test water. So behavioral study is an important parameters of an organism’s response to stress including environmental contaminants. Bi2O3NPs induced oxidative stress, apoptosis and DNA damage induced in snail according dose and time dependent manner. We have found LC50 96 h values of Bi2O3NPs was 72.6 µg/ml. Lushchak (2012) and Ali et al. (2012) have reported that GSH played an important protective role against reactive oxygen species in animal cells by used as a substrate for glutathione peroxidase. Reduction of GSH increases the understanding of cells to different pollutants and metabolic effect. The observation of the current study demonstrated a correlation between the enlargement of lipid peroxidation, DNA damage and a result reduction of GSH levels. Wang et al. (2018) reported SOD expedites the breakdown of superoxide radicals. The free radicals reacts with other product of oxidative phosphorylation, consequently leading to the generation of hydrogen peroxide (Briehl and Baker, 1996). The results of the this study showed slight increase in SOD activity after treatment of sublethal I, II, whereas a highly significant enhancement was seen at sublethal III Bi2O3NPs for day 1, 3 and 7 in digestive glands of exposed snail. The major phase of enzymatic detoxification in many species is the conjugation of activated xenobiotics to GSH catalyzed by the GST (Emma and Pierre, 2014). ROS formation lead an important role in oxidative stress of cells. Formation of ROS could induced oxidation of DNA and breakage of strands, leading to high apoptotic and necrotic cells. Ali et al., (2011) reported that free radicals formed in mitochondria of cells which moderately account for these ROS.
In this study comet assay was used because pH more than 13 is supposed to exploit the expression of alkali-labile sites as single strand breaks. Ecogenotoxicity biomarkers have been applied as initial hazardous indication of ecological pollution (Hund-Rinke and Simon, 2006). Alkaline single cell gel electrophoresis is widely used in the area of toxicology to investigate the toxic effects of nanoparticles (Mahaye et al., 2017; Akcha et al. 2003). In this study we have investigated the genotoxic properties of Bi2O3NPs in freshwater snail and our results was in line with our previous study of zinc oxide nanoparticles exerted toxicity in snail (Ali et al., 2012). Studies have found that nanomaterials causes oxidative stress and genotoxicity in different types human cells and aquatic organism (Gao et al., 2018).
The results of this study demonstrate, the first ecogenotoxicity assay of Bi2O3NPs on fresh water snail L. luteola. Results of this study indicated concentration and exposure duration response correlation in the toxicity of Bi2O3NPs in snails. In future, experiments are required to measure the present ecological burden of NPs in fresh and marine ecosystems.
Conflict of interest statement
There are no conflicts of interest.
Ethical Approval
Not applicable.
7 Consent to Participate
All authors were participated in this work.
Consent to Publish
All authors agree to publish.
Availability of data and materials
All relevant data are available from the corresponding author upon request.
Funding
This research was funded by the Deanship of Scientific Research at Princess Nourah Bint Abdulrahman University, through the Research Funding Program (Grant No# FRP-1440-20).
CRediT authorship contribution statement
Monera A. Al-Abdan: Conceptualization, Investigation, Methodology, Writing - review & editing. May N. Bin-Jumah: Project administration, Conceptualization, Investigation, Methodology, Writing - review & editing. Daoud Ali: Conceptualization, Data curation, Formal analysis, Investigation, Methodology, Writing - original draft, Writing - review & editing. Saud Alarifi: Project administration, Conceptualization, Data curation, Formal analysis, Investigation, Methodology, Writing - review & editing.
Acknowledgements
This research was funded by the Deanship of Scientific Research at Princess Nourah Bint Abdulrahman University, through the Research Funding Program (Grant No# FRP-1440-20).
References
- Sensitivity of freshwater pulmonate snail Lymnaea luteola L., to silver nanoparticles. Chemosphere. 2014;104:134-140.
- [Google Scholar]
- UVB-induced apoptosis and DNA damaging potential of chrysene via reactive oxygen species in human keratinocytes. Toxicology Letters. 2011;204(2–3):199-207.
- [Google Scholar]
- Mapping the dawn of nanoecotoxicological research. Acc. Chem. Res.. 2013;46(3):823-833.
- [Google Scholar]
- A. Madhyastha, J. Dutta, B.A. Daniel. Lymnaea luteola (2010). The IUCN red list of threatened species, e.T166682A6258435. http://dx.doi.org/10.2305/IUCN.UK.2010-4.
- A. Yassi, T. Kjellstrom, (1997). Linkages between environmental and occupational health. Chapter 53 - Environmental Health Hazards Part VII - The Environment. Encyclopediaofoccupational health and safety Fourth Edition. (www.ilocis.org/documents/chpt53e.htm).
- A.R. Badireddy, S. Chellam. Antibacterial and antifouling properties of lipophilic bismuth compounds. In: Taylor JC, ed. Bismuth: Occurrence, Uses and Health & Environmental Effects. Vol. 21. NY: Nova Publishers; 2014.
- Long-range absorption enhancement in organic tandem thin-film solar cells containing silver nanoclusters. J. Appl. Phys.. 2004;96:7519-7526.
- [Google Scholar]
- Ecotoxicity of silver nanomaterials in the aquatic environment: a review of literature and gaps in nano-toxicological research. J. Environ. Sci. Health A: Toxicol. Hazard. Subst. Environ. Eng.. 2014;49(13):1588-1601.
- [Google Scholar]
- Oxidative stress and genotoxic effect of zinc oxide nanoparticles in freshwater snail Lymnaea luteola L. Aquat. Toxicol.. 2012;124–125:83-90.
- [Google Scholar]
- Tumor targeted, stealthy and degradable bismuth nanoparticles for enhanced X-ray radiation therapy of breast cancer. Biomaterials. 2018;154:24-33.
- [Google Scholar]
- Glutathione-S-conjugates as prodrugs to target drug-resistant tumors. Front. Pharmacol.. 2014;5:181.
- [Google Scholar]
- Potential value of the comet assay and DNA adduct measurement in dab (Limanda limanda) for assessment of in situexposureto genotoxic compounds. Mutat. Res.. 2003;534:21-32.
- [Google Scholar]
- A review of the in vivo and in vitro toxicity of silver and gold particulates:particle attributes and biological mechanisms responsible for the observed toxicity. Crit. Rev. Toxicol.. 2010;40:328-346.
- [Google Scholar]
- Ecotoxic effect of photocatalyticactive nanoparticles TiO2 onalgae and daphnids. Environ. Sci. Pollut. Res.. 2006;13:225-232.
- [Google Scholar]
- Oxidative stress and DNA damage in zebrafish liver due to hydroxyapatite nanoparticles-loaded cadmium. Chemosphere. 2018;202:498-505.
- [Google Scholar]
- Antimicrobial potential of bismuth lipophilic nanoparticles embedded into chitosan-based membrane. Dent. Mater. J.. 2019;38(4):611-620.
- [Google Scholar]
- Modulation of the antioxidant defense as a factor in apoptosis. Cell Death Diff.. 1996;3:63-70.
- [Google Scholar]
- Genotoxicity of metal based engineered nanoparticles in aquatic organisms: A review. Mutat. Res.. 2017;773:134-160.
- [Google Scholar]
- Biocordination chemistry of bismuth: recent advances. Coord. Chem. Rev.. 2007;251:2354-2366.
- [Google Scholar]
- Ecotoxicity of nanomaterials to fish: challenges for ecotoxicity testing. Integr. Environ. Assess. Manag.. 2007;3:458-460.
- [Google Scholar]
- Glutathione homeostasis and functions: Potential targets for medical interventions. J. Amino Acids. 2012;2012:736837
- [Google Scholar]
- Genetic toxicology and risk assessmentof complexenvironmentalmixtures. Drug Chem. Toxicol.. 1996;19:187-219.
- [Google Scholar]
- Superoxide dismutases: Dual roles in controlling ROS damage and regulating ROS signaling. J. Cell Biol.. 2018;217(6):1915-1928.
- [Google Scholar]


