

Translate this page into:
Investigating the necessity of in-situ and laboratory data in determining thermal properties of tar sands, an experimental design approach
⁎Corresponding author. Kenadegbola@yahoo.com (Kehinde Adegbola)
-
Received: ,
Accepted: ,
This article was originally published by Elsevier and was migrated to Scientific Scholar after the change of Publisher.
Peer review under responsibility of King Saud University.
Abstract
Thermal properties of tar sand are useful parameters in planning its thermal recovery. These properties that are usually measured in-situ are reconfirm through the laboratory sample measurement, which shows any alteration, errors or uncertainties that might have been experienced during the sample collection process.
Repeating this measurements procedure on the field and laboratory could be cumbersome, costly and time consuming (man hours). Therefore, this study set out to investigate the necessity of having both laboratory and field data in determining the thermal properties of Tar sand using the same device. To achieved this, the study compares the in-situ and laboratory measurements of tar sand thermal properties, using the Randomized Complete Block Design (RCBD) to evaluate the field and laboratory (treatment) effect. Tar sands thermal properties namely; thermal conductivity, thermal diffusivity and specific heat were measured using KD2 Pro thermal analyzer in twelve locations along the tar sand belts in some parts of Southwestern Nigeria. Also, samples were taken at these twelve locations and the same properties were measured in the laboratory using the same thermal analyzer. These thermal properties measured and computed from the field and laboratory are regarded as treatments, while the location points on the field constitute the blocking factor. The responses obtained were statistically analyzed using two-way ANOVA, and the results showed that measurements could be taken either on the field or in the laboratory, as both measurements are statistically the same. Therefore, judgment on data acquired for these parameters should not be based on accuracy as influenced by the locations where the measurement took place, but instead on other factors such as feasibility, urgency, and cost among others.
Keywords
Thermal properties
KD2 Pro
RCBD
Anova

1 Introduction
The knowledge of thermal properties, such as thermal conductivity, thermal diffusivity and specific heat, of tar sand has been a useful guidance in the design of commercial recovery operations that involve heating of the tar sand. In the past, the determination of these properties both in the laboratory and on the field using methods such as quick thermal conductivity meter (Ito, Saito and Nagumeo, 1977), constant applied heat flux method (Lindberg and Thomas, 1985), transient state thermal test (Scott and Seto, 1986), has been tedious, expensive and time-consuming. However, Decagon Devices Inc. (2012) developed an easy to use and fast thermal analyzer for measuring these parameters both in the laboratory and on the field. Since this thermal analyzer can take measurements both on the field Oladunjoye and Sanuade, 2012 and in the laboratory Oladunjoye et al., 2014, it would be very important to know if the measurements taken on the field could be a perfect or near perfect substitution for any measurements performed in the laboratory and vice-versa. This would be useful for scientists and engineers that use thermal properties of materials to decide on which measurement to embark on depending on the one that is convenient for them and perhaps depending on other factors such as feasibility, time and cost. In order to determine the relationship between the laboratory measurements and field measurements, a statistical approach called “Experimental Design” was employed. “Experimental design” is defined as the process of planning a study to meet specified objectives. The proper planning of experiment is essential to ensure that the right type of data and a sufficient sample size and power are provided to answer the research questions of interest as clearly and efficiently as possible (Montgomery, 2013). Therefore, this study investigates the statistical relationship between thermal properties taken on the field and those measured in the laboratory using an experimental design (RCBD) statistical approach.
1.1 Study area and geology
The study area is located in the Eastern part of Dahomey Basin, Southwest part of Nigeria. The tar sand belt extend from Ijebu Ode in Ogun state to Okitipupa in Ondo state, Nigeria (Fig. 1).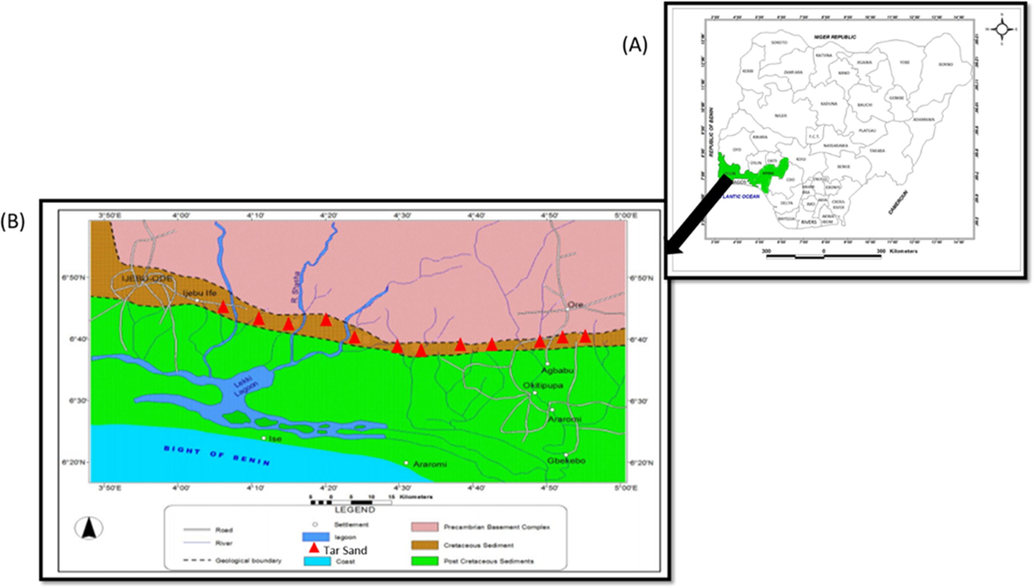
Map of the study area (A) Map of Nigeria showing Ogun and Ondo states (B) Geological map of Southwest Nigeria showing tar sand belt and the sample locations (modified after Ako, 2003). Samples were taken randomly at twelve different locations.
The tar sand belt covers an area of about 110 km2 and straddles between the contact of basement and sediment. The stratigraphic column shows three divisions of the Nigeria bitumen deposit which are Araromi, Afowo and the Ise Formations (Fig. 2). Ise Formation overlies the basement complex of Southwestern Nigeria unconformably, and consists of conglomerate and grits at the base which is overlain by coarsed to medium grained sands with interbeds of kaolinite. The age of the formation is Neocomian-Albian.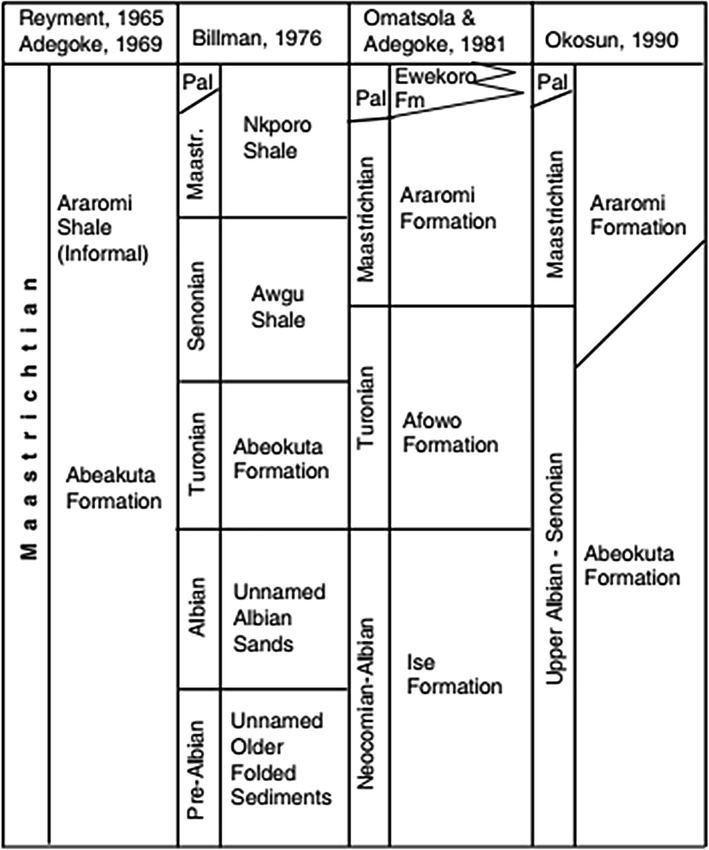
Stratigraphic column of Dahomey Basin as described by Reyment (1965); Omatsola & Adegoke (1981); Billman (1992); Adegoke (1969), Okosun (1990). The work by Omatsola & Adegoke (1981) was adopted in this study. Three main formations are Ise, Afowo and Araromi formations.
Afowo formation overlies the Ise formation and is made up of coarsed to medium grained sandstone with varied amount of shale, siltstone and claystone interbeds which are thick.
The sandstone facies are tar-bearing while shales are organic-rich (Enu, 1990). The age of the formation is Turonian.
Araromi formation is the youngest Cretaceous formation in the group. It comprised of fine to medium-grained basal sand overlain by shale and siltstones with thin intercalations of marl and limestone. The shale is grey to black in color with high organic content. Thin beds of lignite are also frequent. The age of this formation is Maastrichtian.
2 Methodology
2.1 Field measurement
Similar to (Oladunjoye et al., 2014), the surfaces of the tar sand were scooped in order to get fresh surfaces that would be useful and appropriate for measurements of the thermal properties. The measurement of these properties was done using a thermal analyzer called KD-2 Pro (Fig. 3A) together with different thermal sensors.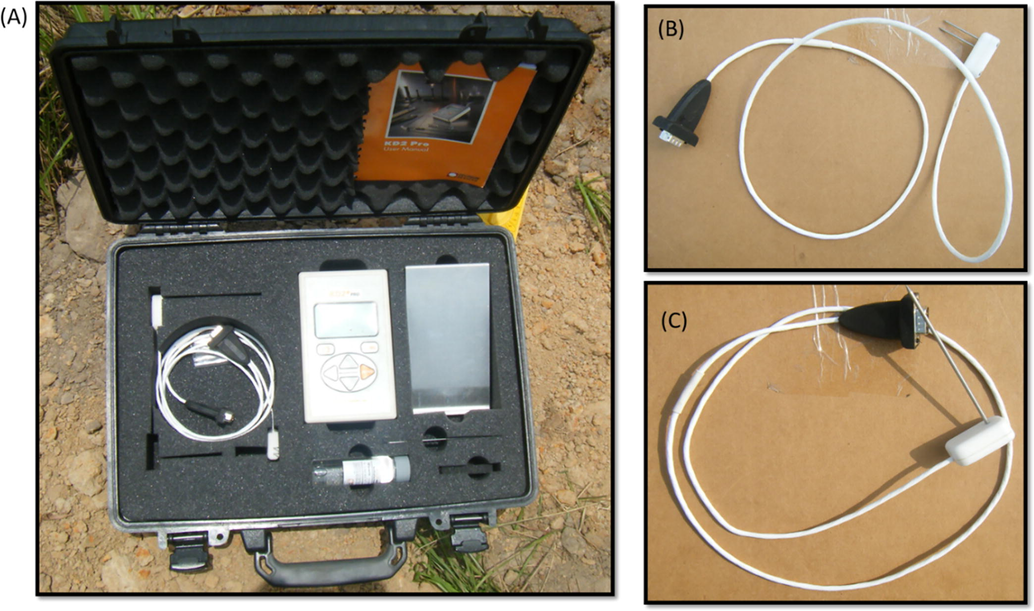
(A) KD2 Pro thermal analyzer (B) SH-1 thermal probe (C) TR-1 thermal probe. The KD2 Pro is a fully potable field and laboratory thermal properties analyzer. SH-1 is a small (30 mm long 1.27 mm diameter) dual needle sensor. TR-1 is a large (100 mm long, 2.4 mm diameter) single needle sensor.
This thermal analyzer is very potable and can be used to take measurements on the field as well as measuring properties in the laboratory (Fig. 3A). KD-2 pro uses the transient line heat source method to measure the thermal properties of materials and it was designed based on 30+ years of research experience on heat and mass transfer in soils and other porous materials. This analyzer was designed to correct for any drift in linear temperature that can cause any errors unlike other thermal needle systems since a drift in temperature can affect the accuracy of thermal calculations.
Thermal sensors were calibrated using standard glycerol in order to ensure they are working perfectly (Krishanaiah, 2003). The exposed surface of the tar sand was then scrapped to establish a fresh surface that has not being oxidized. The thermal sensor to be used was then selected (TR-1 and SH-1) (Fig. 3B and C). The needle was positioned with respect to the fresh surface established and then inserted into the tar sand. Thermal properties were then measured by using the appropriate sensor (TR-1 and SH-1). TR-1 (a single needle sensor) was used to measure the thermal conductivity while SH-1 (a small dual-needle sensor) was used to measure both thermal diffusivity and specific heat of the tar sand. These sensors use the method of heat pulse that yield reliable thermal conductivity, thermal diffusivity and specific heat capacity which uses non-linear least square procedure for estimation.
Appropriate sensor was attached to the KD-2 Pro thermal analyzer and the analyzer was turned on. The sensor was properly inserted into the tar sand and measurements were taken appropriately. After each measurement, the instrument was allowed to rest for 25 min before taking the next reading for TR-1 and 15 min for SH-1 for equilibrium position to be established as recommended by (Decagon Devices, 2012). Measurements were taken at twelve (12) different locations along the tar sands belt (Fig. 1).
However, thermal effusivity, (the rate at which a material can absorb heat) was determined using Eq. (1).
This parameter is very important because it is the key parameter that limits heat exchange at the interface between the tar sand and wherever this material is intended to be applied.
Samples were then collected at the twelve locations where measurements were taken for the laboratory determination of the same thermal properties (thermal conductivity, thermal diffusivity and specific heat). The samples were kept in polythene bags, labeled appropriately and stored in a cool dry place.
2.2 Experimental procedure
Twelve square boxes, each with dimension of 1 cm by 1 cm in size, were designed for the experimental measurement of thermal properties. The collected samples were put in these square boxes and allowed to stay for some weeks in order to make the tar sands to be solidified. After about two weeks, thermal properties were measured on those collected samples.
The same set of parameters (thermal conductivity, thermal diffusivity and specific heat) measured on the field were also measured in the laboratory. However, we also calculated the thermal effusivity of these tar sands using Eq. (1) above.
2.3 Statistical analysis
This is aimed at making direct comparison between the field and laboratory data gathered for thermal properties of tar sand. The objective is to investigate the effect of treatments (laboratory and field measurements) on four basic parameters (thermal conductivity, thermal diffusivity, specific heat and thermal effusivity) of tar sand, so as to affirm if the type of treatment has an influence on the response gathered. To achieve this, a fundamental design of experiment called randomized complete block design (RCBD) was adopted. This approach is a standard design of experiments where similar experimental units are grouped into blocks or replicates. This is done to block a nuisance factor that probably has an effect on the response, but whose effect is of no interest in the experiment Coleman and Montgomery (1993).
The data source (laboratory and field) is known as the treatment while location points where the samples and field measurements were taken are considered as blocks. Similar to Adetokunbo et.al (2017), Fig. 4 presents a conceptual model that best describe steps involved when adopting randomized complete block design.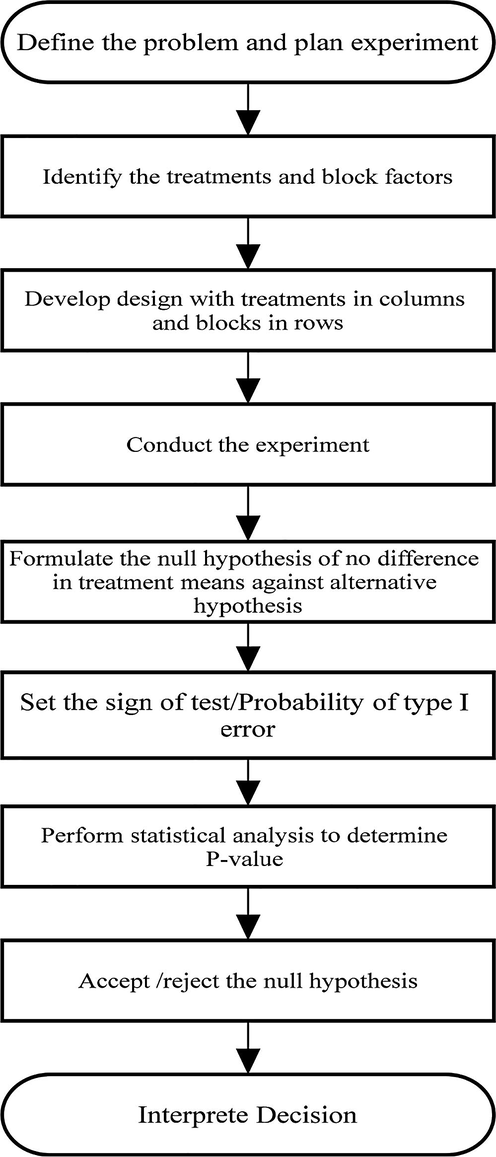
A conceptual model explaining the steps involved when adopting randomized complete block design.
2.3.1 Theory
Assuming in general, ‘’ treatments and ‘’ blocks are to be compared as shown in Table 1. There is one observation per treatment in each block, and the order of running the treatments within each block is randomly determined.
.
.
.
.
.
.
.
.
.
.
.
.
.
.
.
.
.
.
.
.
The statistical model for RCBD is given in Eq. (2)
yij = response of treatment i in block j; m = overall mean; τi = effect of the treatment; βj = effect of the jth block; εij = NID (0;σ2) random error term.
In RCBD, we test the null hypothesis of no difference in treatment means:
Since the treatment mean is,
an alternative way to represent the hypothesis in terms of the treatment effect is given in Eq. (5)
For RCBD, the total sum of squares can be partitioned as:
Finally, we used this test statistic in Eq. (10) to evaluate the null hypothesis of no difference in treatment means
The null hypothesis is therefore rejected if , otherwise it is accepted. Also, the p-value which is the smallest probability of accepting the null hypothesis can be used. If the p-value is less than the size of test (α), we reject the null hypothesis of no difference, and if the reverse hold, we accept (Montgomery, 2013).
To implement the ANOVA models described above, we used Minitab 16 software.
Data acquired similar to (Oladunjoye et al., 2014) is given below in Table 2:
Thermal Conductivity
Thermal Diffusivity
Volumetric specific Heat
Location #
Field
Laboratory
Field
Laboratory
Field
Laboratory
001
1.587
1.030
0.780
0.508
2.034
1.716
002
0.320
0.337
0.176
0.222
1.859
1.518
003
1.511
0.748
0.481
0.348
3.143
2.170
004
0.357
0.390
0.170
0.206
2.269
1.890
005
0.990
0.997
0.622
0.627
1.591
1.660
006
1.250
1.232
0.715
0.817
1.749
1.599
007
1.266
1.185
0.586
0.487
2.160
2.440
008
1.427
1.252
0.741
0.506
1.928
2.400
009
1.540
1.200
0.774
0.520
1.989
2.310
010
0.361
0.565
0.290
0.311
1.244
1.829
011
0.276
0.518
0.316
0.373
0.873
1.381
012
0.907
0.893
0.537
0.385
1.690
2.322
2.4 Statistical analysis
To analyze the data statistically, the normality assumption was first verified using the residual plot diagrams in Figs. 5, 6, 7 and 8. A two-way Anova test was then performed to decide the P-value, for testing the null hypothesis of no difference in treatment means against alternative hypothesis of difference in means.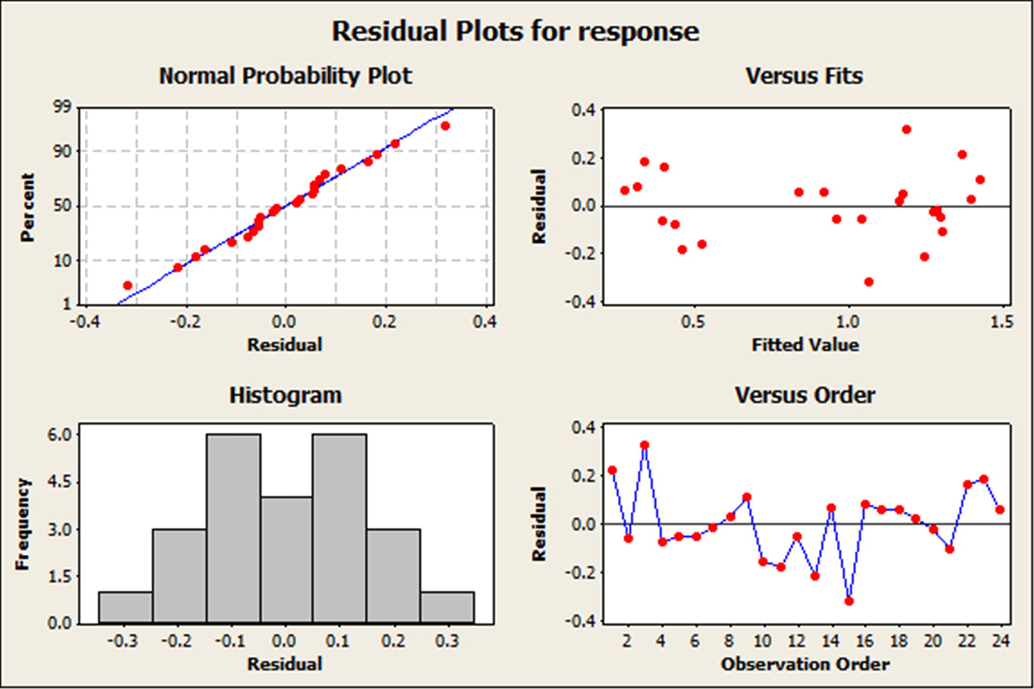
Residual plot for thermal conductivity. The Anderson Darling normal probability plot shows the normality of the response variables gathered for thermal conductivity from both treatments.
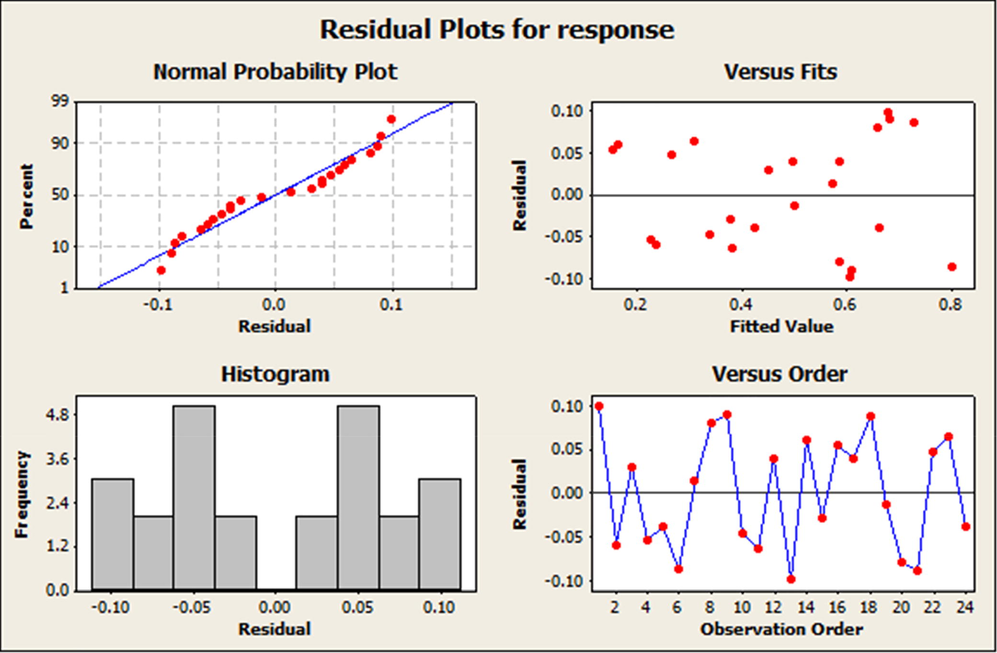
Residual plot for thermal diffusivity. The residual versus order plot shows the validation of the independent assumption for thermal diffusivity measured from both treatments.
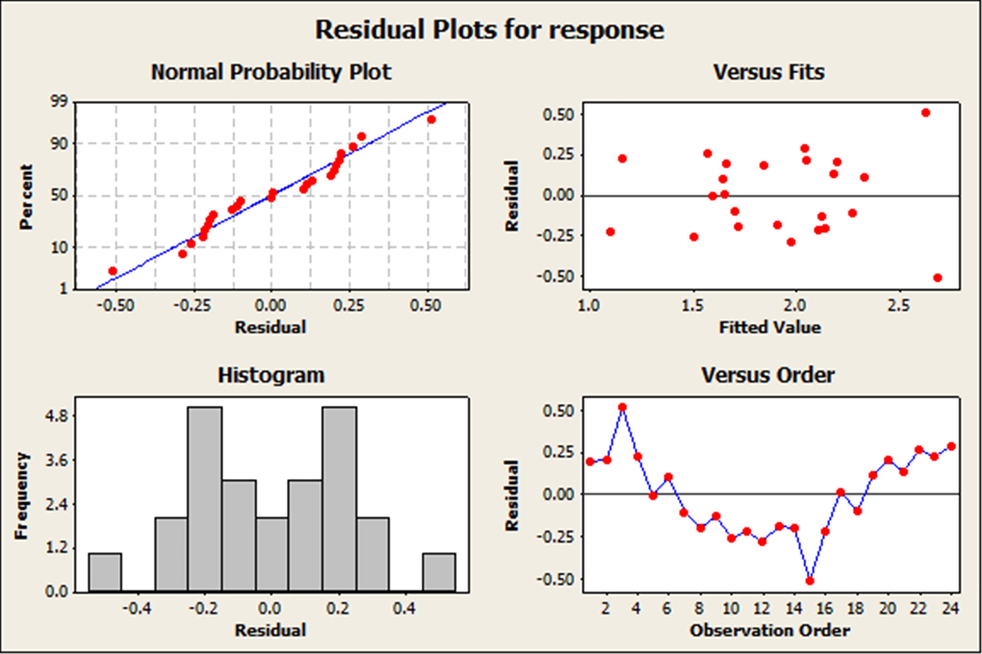
Residual plot for specific heat. The histogram plot for the response variable (specific heat) show that the plotted data are normally distributed.
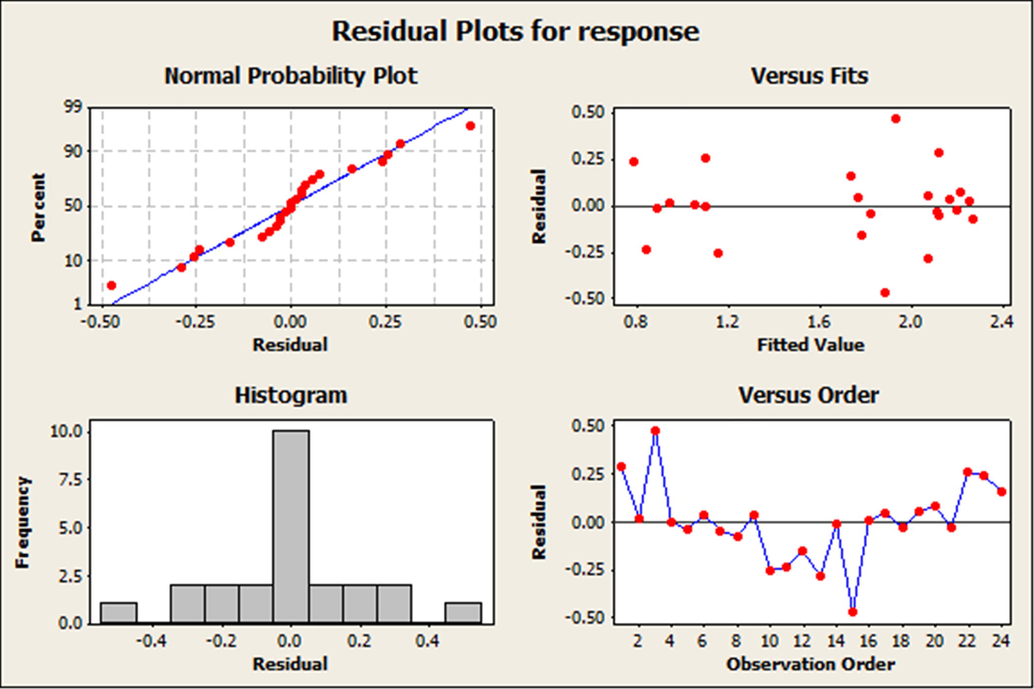
Residual plot for thermal effusivity. The residual versus fit graph shows the validation of constant variance assumption.
The result obtained from the statistical analysis is discussed in section 5.0.
2.5 Results and discussion
From Figs. 5, 6, 7 and 8, the normal probability plot in the form of Anderson Darling test shows that the response variable for the parameters considered are normal. The histograms equally portrait normality. The plot for the residual versus fit confirmed the homogeneity of the variance as no scattered plot was observed. The plots for the residual versus order show the independent relationship that exist between points as no particular trend was developed. Meanwhile from the two-way ANOVA result, some observations were made when studying the effect of treatment on the designed experiment. Firstly, the ANOVA result for the thermal conductivity is shown in Table 3. From the table, the treatment or method has a p-value of 0.179, which surpasses the 0.05 level of significance. This suggests that the null hypothesis of no difference should be accepted and thus for thermal conductivity, the laboratory data can be used in lieu of the field as the response are the same statistically. S = 0.2096; R-Sq = 88.95%; R-Sq(ad j) = 76.90%.
Source
DF
SS
MS
F
P
Method
1
0.09041
0.090405
2.06
0.179
Location
11
3.80051
0.345501
7.87
0.001
Error
11
0.48322
0.043929
Total
23
4.37413
Table 4 considered thermal diffusivity in which the treatment type or method has a p-value of 0.085. Like thermal conductivity, the value is higher than the set level of significance, thereby resulting to the acceptance of the null hypothesis, which again affirm that the treatment type has no significant effect on the experiment. Therefore, for thermal diffusivity, both field and laboratory data are the same statistically. S = 0.9477; R-Sq = 89.40%; R-Sq(ad j) = 77.84%.
Source
DF
SS
MS
F
P
Method
1
0.032120
0.0321202
3.58
0.085
Location
11
0.801385
0.0728532
8.11
0.001
Error
11
0.098805
0.0089823
Total
23
0.932310
For the specific heat, the ANOVA result generated is given in Table 5. The treatments have a p-value of 0.689, which again suggested that null hypothesis of no difference should be accepted. S = 0.3502; R-Sq = 72.95%; R-Sq(ad j) = 43.45%.
Source
DF
SS
MS
F
P
Method
1
0.02077
0.020768
0.17
0.689
Location
11
3.61716
0.328833
2.68
0.058
Error
11
1.34872
0.122611
Total
23
4.98665
Lastly, we obtained the P-value for thermal effusivity in Table 6. As expected the result findings did not deviate from those obtained from diffusivity, specific heat and conductivity. This is because in mathematical closed form, thermal effusivity is determined through the combination of thermal conductivity, specific heat and density. A P-value of 0.666 was obtained for the treatments (laboratory and field), and this suggested that the null hypothesis of no difference should be accepted for the treatments. Therefore, similar to the conclusions from other parameters considered, both responses obtained from the field and laboratory are the same statistically. S = 0.2924; R-Sq = 87.41%; R-Sq = (ad j) = 73.68%.
Source
DF
SS
MS
F
P
Method
1
0.01685
0.016854
0.20
0.666
Location
11
6.51389
0.592172
6.93
0.002
Error
11
0.94049
0.085499
Total
23
7.47124
2.6 Conclusions
Thermal properties (thermal conductivity, thermal diffusivity, specific heat and thermal effusivity) of tar sands are very important parameters in calculating the cost of generating electrical energy that will give the quantity of heat required for the recovery of bitumen from tar sand. These properties are generally measured, both on the field and in the laboratory using thermal analyzer (KD-2 Pro) to eliminate uncertainties or errors in the collected data. Interestingly, the cost and man hours required for gathering and analyzing data, both on the field and in the laboratory are usually huge. Thus, the need to investigate the necessity of having both data in determining the thermal properties of Tar Sand. To achieve this, Statistical comparison was made on both laboratory and field data using a statistical fundamental approach called randomized complete block design (RCBD), so as to establish if the measurements taken on the field could be a perfect or near perfect representation of any measurements performed in the laboratory and vice-versa. The responses obtained for the parameters analyzed showed that the field and laboratory data are statistically the same. Therefore, measurements repetition either on the field or laboratory may not be necessary, as data obtained from either of the locations are perfectly enough. In summary, judgment on data acquired for these parameters should not be based on accuracy as influenced by locations where the measurement took place, but rather, on other factors like feasibility, urgency, man hour etc.
Acknowledgements
The authors thank King Fahd University of Petroleum & Minerals for the provision of valuable software.
References
- Eocene Stratigraphy of Southern Nigeria. Bulletining Bureau de Research Geologic ET Miners Memoir. 1969;69:23-48.
- [Google Scholar]
- Statistical analysis of data processing in some seismic refraction methods. A synthetic data example. Geofizika J.. 2017;34(1):93-105.
- [Google Scholar]
- Exploration strategies for bitumen saturated sands in Nigeria: Prospects for investment in mineral resources of southwestern Nigeria. In: Elueze A.A., ed. Nigeria Mining and Geosciences Society (N.M.G.S). 2003. p. :61-66.
- [Google Scholar]
- Offshore stratigraphy and paleontology of Dahomey embayment, West Africa. Nigerian. Assoc. Petrol. Explor. Bull.. 1992;7(2):121-130.
- [Google Scholar]
- systematic approach to planning for a designed industrial experiment, (with discussion) Technometrics. 1993;35:1-27.
- [Google Scholar]
- Decagon Devices., 2012 KD2 Pro thermal properties analyzer: Operator’s manual version 12. http://www.expins.com/p/pdf/108500.pdf.
- Aspect of rock evaluation studies of the Maastrichtian–Eocene sediments. J. Mining Geol.. 1990;40(1):29-40.
- [Google Scholar]
- Shotherm QTM measurement of rock specimens: Shotherm Sales Information. No.111, Showa Denko K.K., Tokyo. (Abstracted and translated from an original paper in Japanese. Chinetsu. 1977;14:21-30.
- [Google Scholar]
- Centrifuge Modelling of Heat Migration In Geomaterials, Disscussion. India: Civil, Engineering, IIT Bombay; 2003.
- Christensen RJ. Measurements of specific heat, thermal conductivity and thermal diffusivity of Utah tar sands. Fuel. 1985;64(1):80-85.
- [Google Scholar]
- Design and Analysis of Experiments. In: International Student Version (eighth ed.). John Wiley & Sons; 2013.
- [Google Scholar]
- A review of the cretaceous stratigraphy of the Dahomey embayment, west Africa. Cretac. Res.. 1990;11(1):17-27.
- [Google Scholar]
- In-situ and Laboratory determination of thermal properties of Tar Sands in Eastern Dahomey Basin, South Western, Nigeria. Int. J. Res. Rev. Appl. Sci.. 2014;20(1):14-30.
- [Google Scholar]
- In Situ Determination of Thermal Resistivity of Soil: Case Study of Olorunsogo Power Plant, Southwestern Nigeria. ISRN Civil Engineering; 2012. p. :14. Article ID 591450, doi:10.5402/2012/591450
- Tectonic evolution and cretaceous stratigraphy of the dahomey basin. J. Mining Geol.. 1981;18(1):130-137.
- [Google Scholar]
- Aspects of the geology of Nigeria. The Stratigraphy of the Cretaceous and Cenozoic deposits. Ibadan University Press; 1965. p. :23-73.
- Thermal property measurements on oil sands. J. Can. Pet. Technol.. 1986;25(06):30-41.
- [CrossRef] [Google Scholar]


