

Translate this page into:
Investigating the effects of specimen diameter on the relationships between mechanical and physical properties of limestone
⁎Corresponding author. harman@uaeu.ac.ae (Hasan Arman)
-
Received: ,
Accepted: ,
This article was originally published by Elsevier and was migrated to Scientific Scholar after the change of Publisher.
Peer review under responsibility of King Saud University.
Abstract
Engineering applications, either on or within rock bodies, typically require detailed characterizations of rock physical and mechanical properties, as both properties affect the design process and construction phase and are also related to safety and sustainability of structures. Various in-situ and laboratory tests have been used to quantify rock properties. However, the tests are expensive, time consuming and require high quality test samples, especially for laboratory tests. Additionally, available core samples may not meet test standards, which require about 54 mm (NX size) core, as suggested by the American Society for Testing and Materials (ASTM) and the International Society of Rock Mechanics (ISRM). This study aims to investigate the effects of core sample diameter on the relationships between mechanical and physical properties of rock, using the example of limestone as a test material. 190 limestone core samples were prepared in five different diameters: 24.94, 38.07, 47.7, 53.99 (NX) and 63.16 mm. Uniaxial compressive strength (UCS), diametrical and axial point load index (PLID-A), indirect tensile strength (ITS), Schmidt hammer (SHV), natural unit weight (γn), specific gravity (Gs), water content (wc) and porosity (n) tests were performed on these core samples. The results indicate that sample diameter clearly affects the relationships between mechanical and physical properties of limestone rock, leading to broad measurement variations for most tests. Substantial agreement was found between this study and previous studies of NX size samples of limestone.
Keywords
Core sample diameter
Limestone
Mechanical properties
Physical properties
NX size sample diameter

1 Introduction
Rock physical and mechanical testing is a critical and required condition for safe and sustainable engineering constructions, such as dams, buildings, bridges, tunnels, etc., whether they are installed on or within the rock bodies. In various engineering applications, limestones are common involved as foundations, or are used as construction materials. In rock mechanics literature, the values of mechanical and physical properties of limestones usually show wide variations (Tugrul and Zarif, 2000; Vasarhelyi, 2005; Shalabi et al., 2007; Arman et al., 2017; Pappalardo et al., 2016; Arman et al., 2021). Unconfined compressive strength (UCS), indirect tensile strength (ITS), diametrical and axial point load index (PLID-A), SHV, natural unit weight (γn), specific gravity (Gs), water content (wc) and porosity (n) test results are usually used to characterize the properties of these rocks.
Tugrul and Zarif (2000) studied the effects of weathering on the engineering properties of Devonian limestones that are widespread to the east of Istanbul, Turkey. They reported that weathering was chemical, controlled by content of carbonate, texture, porosity and fractures. Micro fabric changes in the limestones control their strength (UCS), which increases with increasing unit weight (γ), and decreases with increasing porosity (n). Vasarhelyi, 2005 performed a statistical analysis to determine the influence of water content (w) on Miocene limestone strength. A linear regression analyses showed that the degree of saturation could be as important as other petrophysical parameters. Further, the UCS increased with increasing density (ρ). Shalabi et al. (2007) investigated the relationships between intact rock engineering properties of dolomite/dolomitic limestone and various hardness types. They reported close relationships between the intact rock engineering properties, such as UCS and rock hardness. Their findings were comparable to studies performed by other workers on various rock types. Moreover, they found a positive linear trend between the UCS and γ, with moderate correlation coefficient (R = 0.62). Arman et al. (2017) investigated the geomechanical and petrographic aspects of Lower Oligocene limestones in Al Ain city, United Arab Emirates (UAE). Their results clearly revealed relationships between the rock strength and the lithological properties, so that limestone strength increasing with progressive dolomitization, but rock strength decreases with increasing chalk content. Arman et al. also found a positive trend between mean strength values (UCS, ITS and PLI) and mean γ, with moderate to strong correlation coefficient (R 0.57–0.95). Pappalardo et al. (2016) carried out comprehensive laboratory characterization of the limestones of Baroque heritage monuments, Sicily, Italy. They presented two different regression analyses between UCS and n; linear and exponential depending on the nature of the tested samples. The correlation coefficient values (R) ranged from 0.81 to 0.92, indicating strong correlation between UCS and n. Arman et al. (2021) examined how petrologic features of Lower Eocene limestones in Al Ain, UAE, could control their mechanical and physical properties. Their results showed that for some limestones, their mineral contents and cementation textures could render them highly sensitive to mechanical failure, independently of other factors, such as rock environmental conditions. They also found variably positive to negative, and strong to weak relationships among the componential, textural and physical parameters, as shown by widely varying R-values (−0.30 to −0.75).
The aim of this study is to investigate the effects of specimen diameter on the measurements of mechanical and physical properties of limestone. This followed by a comparison of the findings of this study with those of previous available studies on NX size (54 mm diameter) limestone core samples.
2 Study area, geological settings and experimental studies
The limestone rock materials utilized in this study were obtained from Hafit Mountain, located south of Al Ain city, Abu Dhabi, UAE (see Fig. 1). Hafit Mountain represents a macroscopic anticline, extending NNW-SSE and crossing the UAE – Oman border. The anticline folds an Eocene to Oligocene sequence dominated by limestones. The samples were collected at three separate locations along Hafit Mountain (Fig. 1). Representative limestone blocks of various size (roughly 30 × 30 × 30 cm) were careful inspected in the field, and samples lacking obvious macro-defects (cracks, veins, cavities) were selected and transported to the laboratory for core sample preparation.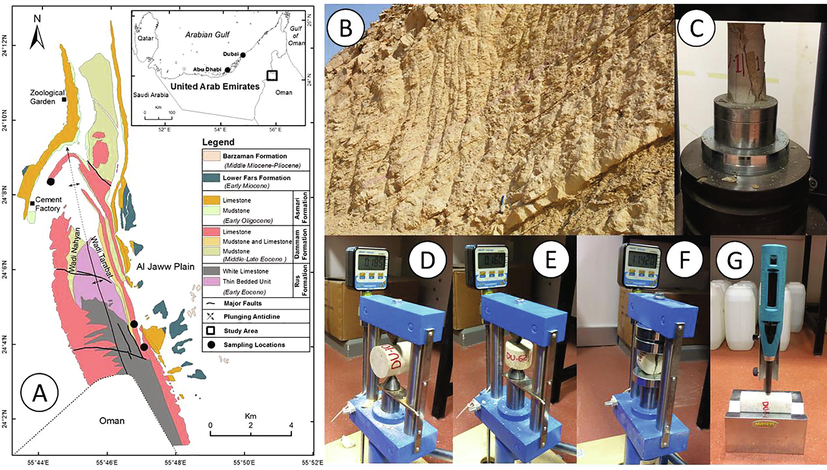
(A) Hafit Mountain geological map and sampling locations, (B) General view of the Dammam Formation, limestone outcrops, (C) Uniaxial Compressive Strength, UCS, test, (D) Point Load Index, PLI, – Diametrical tests, (E) Point Load Index, PLI, Axial tests, (F) Tensile Strength test and (G) Schmidt Hammer Value, SHV test.
Three carbonate formations are exposed in Hafit Mountain study area; from oldest to youngest, these are the Early Eocene Rus Formation (55–49 Ma), the Middle to Late Eocene Dammam Formation (49–34 Ma), and the Early Oligocene Asmari Formation (34–29 Ma) (Fig. 1). The Rus Formation has thick massive beds of grayish white to buff colored dolomitized limestone, and rarer thin mudstone intervals. Brownish chert nodules are disseminated within the dolomite layers at most locations. The Dammam Formation overlies the Rus Formation and shows some fracturing of massive Nummulitic limestone beds, and local chalky texture and minor dolomitization. Thick interbeds of soft marl form packages within the lower parts of the formation, while the upper parts are mainly thinly bedded calcarenite. The Early Oligocene Asmari Formation overlies the Dammam Formation, and is the youngest well-exposed rock unit in the study area. It consists of gypsiferous mudstone, Nummulitic marly limestone, chalk, dolomitic limestone and marl (Arman et al., 2014).
A total of 190 core samples with approximately 24.94, 38.07, 47.70, 53.93 (NX size), and 63.16 mm diameters were extracted from limestone rock blocks for the purpose of mechanical and physical testing. The core samples were trimmed at both ends as per test specifications and availability of core sample length, in order to meet the required sample standards of length/diameter ratio (ASTM, 2019). Before testing, each core sample’s dimensions and weight were measured. The physical properties of limestone, such as natural unit weights (γn), specific gravity (Gs), water absorption (wc), and porosity (n) were determined in accordance with ASTM (2002) and ISRM (1981) standards. Table 1 provides the statistical distributions of the physical and mechanical properties of the limestone. The UCS, PLI – diametrical and axial (PLID-A), ITS, SHV tests were carried out based on ASTM (1995, 1996, 2001, 2002, 2018) standards. γn = Natural Unit Weight of the Sample (kN/m3), Gs = Specific Gravity, wc = Water Content (%), n = Porosity (%),UCS = Uniaxial Compressive Strength (MPa), PLI(D)(Is(50)) = Point Load Index (Diametrical) (MPa), PLI(A)(Is(50)) = Point Load Index (Axial) (MPa), ITS = Indirect Tensile Strength (MPa), SHV(N) = Schmidt Hardness Value (N).
γn (kN/m3)
Gs(C)
wc (%)
n (%)
UCS (MPa)
PLI(D)(Is(50)) (MPa)
PLI(A)(Is(50)) (MPa)
ITS (MPa)
SHV (N)
Diameter = 24.94 (mm)
Number of Samples
39
39
39
39
28
10
19
23
39
Minimum
21.4
2.8
0
0.2
30.7
1.9
2.5
4.2
37
Maximum
27.5
2.7
0.9
15.4
195
7.9
12
12.2
60
Average
26
2.6
0.2
3
93.1
5.8
8
7.1
51.6
Standard Deviation
1.4
0.1
0.2
3.4
42.5
1.93
2.6
1.7
4.8
Diameter = 38.07 (mm)
Number of Samples
36
36
36
36
17
7
7
25
36
Minimum
22.8
2.3
0
0
44.5
2.9
3.9
1.8
37.5
Maximum
27.3
2.7
1.2
10.7
188.5
6.8
8.3
13.4
52.5
Average
25.2
2.5
0.3
4.3
100.5
5
6.1
7
43.8
Standard Deviation
1.1
0.1
0.4
3.4
37.1
1.4
1.7
2.9
4.6
Diameter = 47.7 (mm)
Number of Samples
29
31
31
31
14
3
7
10
29
Minimum
24.1
2.4
0
0.2
50.5
1.6
4
3.8
39
Maximum
27.3
2.7
0.6
7.2
184.1
6.1
6.8
10.8
54
Average
25.9
2.6
0.2
2.4
104.7
3.8
5.6
7.4
49.3
Standard Deviation
0.8
0.1
0.2
2.5
41.9
2.3
1.1
2.1
4.1
Diameter = 53.93 (mm) (NX)
Number of Samples
63
63
63
63
22
17
13
24
63
Minimum
22.8
2.3
0.01
0.4
26.3
2.4
1.9
4.2
33.5
Maximum
29.1
2.7
0.9
10.2
144.9
5.8
6.4
11.7
61
Average
25.4
2.6
0.2
3.6
90.5
4.3
4.6
8
47.1
Standard Deviation
1.1
0.1
0.1
2.9
34.7
1.1
1.5
2.1
7.1
Diameter = 63.16 (mm)
Number of Samples
23
23
23
23
6
8
4
10
23
Minimum
21.8
2.4
0.1
0.5
42.2
2.2
3.9
2.6
33
Maximum
26.3
2.6
1
10
172
5.1
5.3
24
57.5
Average
24.8
2.5
0.2
4.4
93.7
3.3
4.5
5.7
45.8
Standard Deviation
1.2
0.1
0.2
3
43.4
0.9
0.7
2
7
3 Results and discussion
The relationships between the UCS, PLID-A(Is(50)), ITS, SHV and γn, Gs, wc, n data for the limestone samples, for the five different core diameters, were assessed by linear regression analyses, within a 95% confidence level. The equations of the lines of best–fit, and their corresponding correlation coefficients (R) were estimated for these correlated parameters and presented in Figs. 2–6 and Table 2. UCS = Uniaxial Compressive Strength (MPa), PLI(D)(Is(50)) = Point Load Index (Diametrical) (MPa), PLI(A)(Is(50)) = Point Load Index (Axial) (MPa), ITS = Indirect Tensile Strength (MPa), SHV(N) = Schmidt Hardness Value (N), γn = Natural Unit Weight of the Sample (kN/m3), Gs = Specific Gravity, wc = Water Content (%), n = Porosity (%)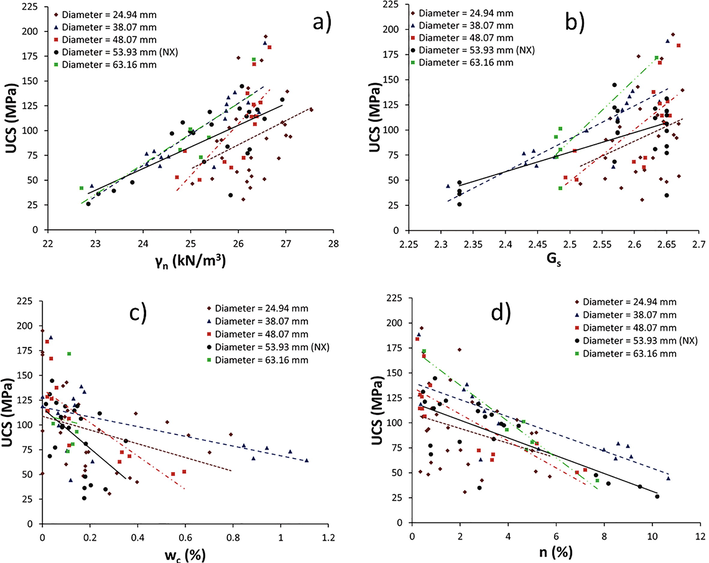
Relationship between UCS a) γn, b) Gs, c) wc and d) n of limestone.
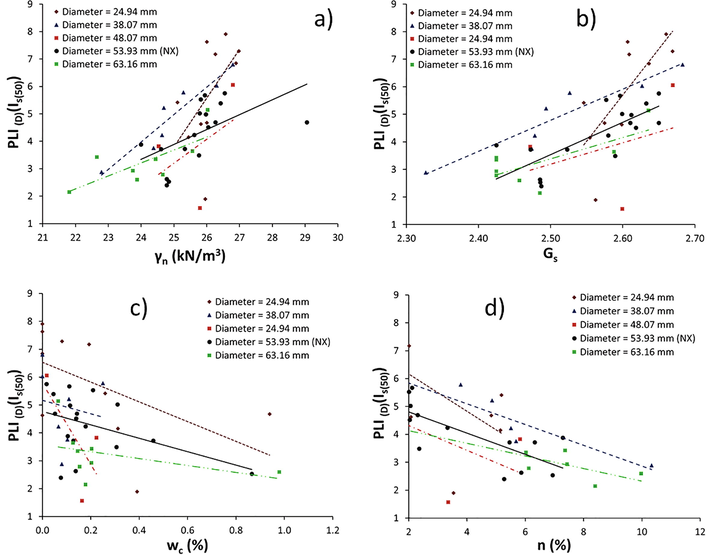
Relationship between PLID(I s(50)) a) γn, b) Gs, c) wc and d) n of limestone.
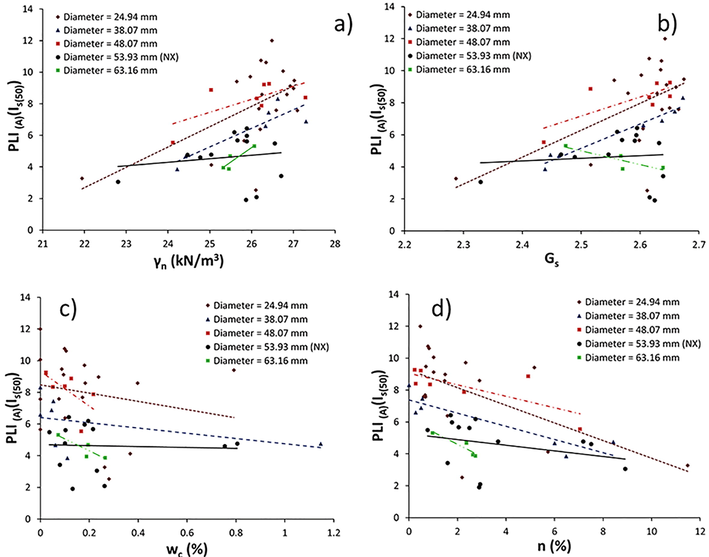
Relationship between PLIA(I s(50)) a) γn, b) Gs, c) wc and d) n of limestone.
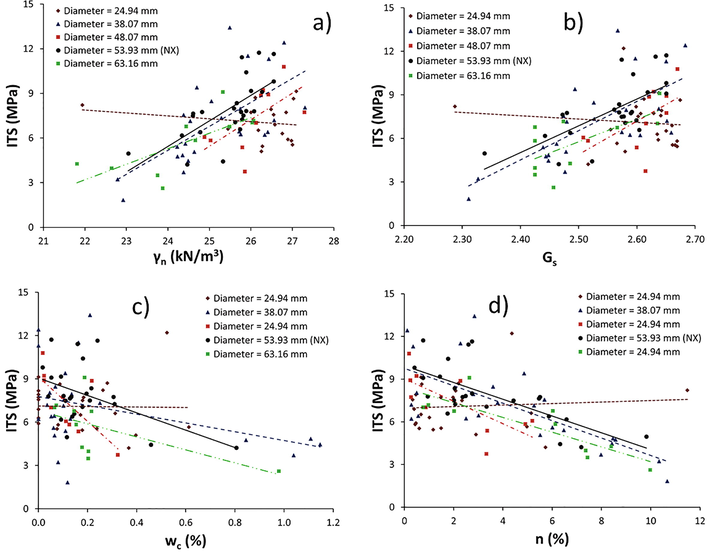
Relationship between ITS a) γn, b) Gs, c) wc and d) n of limestone.
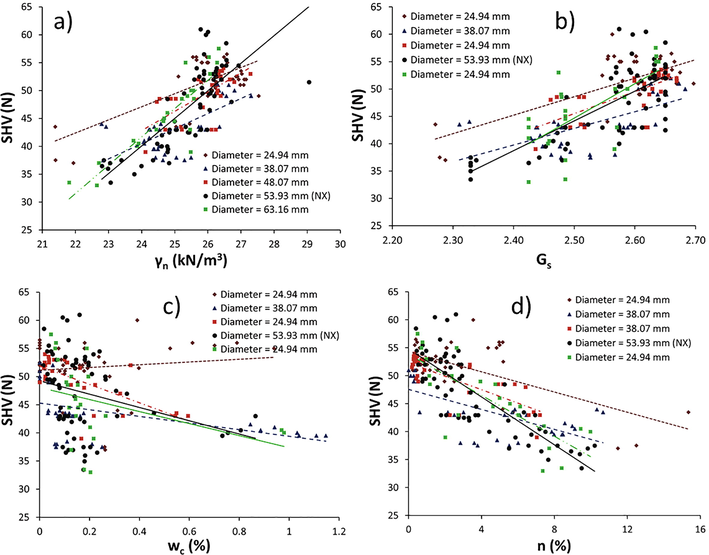
Relationship between SHV a) γn, b) Gs, c) wc and d) n of limestone.
Physical Properties
(Number of Samples)UCS (MPa)
PLI(D)(Is(50)) (MPa)
PLI(A)(Is(50)) (MPa)
ITS (MPa)
SHV (N)
Empirical Relation
R-value
Empirical Relation
R-value
Empirical Relation
R-value
Empirical Relation
R-value
Empirical Relation
R-value
Diameter = 24.94 (mm)
γn (kN/m3) (39)
UCS = 24.4γn − 548.4
0.33
PLI(D)(Is(50)) = 1.8γn − 40.6
0.55
PLI(A)(Is(50)) = 1.3γn- 25.6
0.57
ITS = −0.2γn + 12.2
−0.19
SHV = 2.4γn − 9.2
0.68
Gs (39)
UCS = 296.3Gs − 681.6
0.30
PLI(D)(Is(50)) = 33.6Gs − 81.7
0.75
PLI(A)(Is(50)) = 16.8Gs − 35.7
0.56
ITS = −2.3Gs + 13.1
−0.11
SHV = 33.8Gs − 36
0.70
wc (%) (39)
UCS = −69.4wc + 108.8
−0.35
PLI(D)(Is(50)) = −3.5wc + 6.5
−0.54
PLI(A)(Is(50)) = −2.6wc + 8.5
−0.19
ITS = −0.1wc + 7.1
−0.01
SHV = 2.4wc + 51.1
0.12
n (%) (39)
UCS = −7.3n + 109
−0.30
PLI(D)(Is(50)) = −0.7n + 7.5
−0.67
PLI(A)(Is(50)) = −0.6n + 9.3
−0.57
ITS = 0.1n + 7
0.08
SHV = −0.9n + 54.3
−0.64
Diameter = 38.07 (mm)
γn (kN/m3) (36)
UCS = 31.4γn − 687.7
0.86
PLI(D)(Is(50)) = 1γn − 19.9
0.95
PLI(A)(Is(50)) = 1.2γn − 24.2
0.90
ITS = 1.6γn − 33.5
0.64
SHV = 2.7γn- 24.5
0.65
Gs (36)
UCS = 327.2Gs − 726.8
0.84
PLI(D)(Is(50)) = 11.3Gs − 23.5
0.94
PLI(A)(Is(50)) = 15.3Gs- 33
0.98
ITS = 20.1Gs − 43.8
0.69
SHV = 30.5Gs- 33.4
0.65
wc (%) (36)
UCS = −49.1wc + 117.9
−0.55
PLI(D)(Is(50)) = −2.4wc + 5.2
−0.15
PLI(A)(Is(50)) = −1.7wc + 6.4
−0.42
ITS = −3.1wc + 7.8
−0.38
SHV = −5.9wc + 45.3
−0.48
n (%) (36)
UCS = −8.6n + 140.6
−0.82
PLI(D)(Is(50)) = −0.4n + 6.6
−0.94
PLI(A)(Is(50)) = −0.4n + 7.4
−0.90
ITS = −0.6n + 9.8
−0.71
SHV = −0.9n + 47.6
−0.66
Diameter = 47.7 (mm)
γn (kN/m3) (29)
UCS = 52.1γn − 1248.4
0.77
PLI(D)(Is(50)) = 0.9γn − 18.7
0.44
PLI(A)(Is(50)) = 0.8γn − 13.1
0.67
ITS = 1.8γn − 39.1
0.61
SHV = 3.4γn − 39.6
0.66
Gs (29)
UCS = 513.7Gs − 1235.2
0.73
PLI(D)(Is(50)) = 7.8Gs − 16.2
0.35
PLI(A)(Is(50)) = 11.8Gs − 22.4
0.64
ITS = 22.9Gs − 52.4
0.58
SHV = 40.3Gs − 55.2
0.69
wc (%) (29)
UCS = −168.7wc + 136.1
−0.83
PLI(D)(Is(50)) = −14.6wc + 5.8
−0.22
PLI(A)(Is(50)) = −11wc + 9.3
−0.64
ITS = −15.4wc + 9.1
−0.71
SHV = −16.3wc + 51.9
−0.69
n (%) (29)
UCS = −13.5n + 135.7
−0.82
PLI(D)(Is(50)) = −0.4n + 5.2
−0.56
PLI(A)(Is(50)) = −0.4n + 9.1
−0.75
ITS = −0.8n + 9
−0.73
SHV = −1.2n + 52.3
−0.77
Diameter = 53.93 (mm), NX
γn (kN/m3) (63)
UCS = 21.8γn − 462.1
0.73
PLI(D)(Is(50)) = 0.5γn − 9.6
0.55
PLI(A)(Is(50)) = 0.2γn − 1.1
0.15
ITS = 1.7γn − 35.7
0.69
SHV = 5γn − 78.7
0.78
Gs (63)
UCS = 194.7Gs − 408.8
0.66
PLI(D)(Is(50)) = 11.7Gs − 25.7
0.75
PLI(A)(Is(50)) = 1.7Gs + 0.4
0.09
ITS = 18.5Gs − 39.3
0.68
SHV = 54.4Gs − 91.9
0.75
wc (%) (63)
UCS = −203.6wc + 117.1
−0.50
PLI(D)(Is(50)) = −2.4wc + 4.8
−0.45
PLI(A)(Is(50)) = −0.3wc + 4.7
−0.05
ITS = −6wc + 9.1
−0.48
SHV = −11.8wc + 49.2
−0.30
n (%) (63)
UCS = −8.9n + 120.5
−0.75
PLI(D)(Is(50)) = −0.4n + 5.6
−0.80
PLI(A)(Is(50)) = −0.2n + 5.3
−0.30
ITS = −0.6n + 9.9
−0.70
SHV = −2.2n + 54.8
−0.82
Diameter = 63.16 (mm)
γn (kN/m3) (63)
UCS = 30.6γn − 668.1
0.85
PLI(D)(Is(50)) = 0.5γn − 8.1
0.73
PLI(A)(Is(50)) = 1.9γn − 42.8
0.89
ITS = 1γn − 19.5
0.73
SHV = 5.1γn − 79.9
0.88
Gs (23)
UCS = 613.2Gs − 1444.1
0.88
PLI(D)(Is(50)) = 7.7Gs − 15.9
0.71
PLI(A)(Is(50)) = −8.6Gs + 26.5
0.85
ITS = 15.5Gs − 33
0.66
SHV = 63Gs − 112.8
0.68
wc (%) (23)
UCS = −59.9wc + 110.5
−0.06
PLI(D)(Is(50)) = −1.2wc + 3.6
−0.40
PLI(A)(Is(50)) = −7.6wc + 5.8
−0.88
ITS = −4.5wc + 6.8
−0.59
SHV = −10.7wc + 48.1
−0.38
n (%) (23)
UCS = −18.2n + 174.1
−0.97
PLI(D)(Is(50)) = −0.2n + 4.6
−0.83
PLI(A)(Is(50)) = −0.8n + 6.2
−0.93
ITS = −0.5n + 8.4
−0.85
SHV = −1.8n + 53.8
−0.79
Although the data are highly scattered, the plots between UCS, PLID-A(Is(50)), ITS, SHV and γn, Gs showed that there were generally positive correlation trends amongst those parameters (Fig. 2a–b; 3a–b; 4–b, 5–b, 6a–b). However, there was a slight negative correlation between the ITS and γn, Gs for core diameter 24.94 mm. Furthermore, apart from R–values for the ITS – γn, Gs for core diameter 24.94 mm and PLIA(Is(50)) – γn, Gs for core diameter 53.93 mm (NX size), the remaining R-values ranged from 0.30 to 0.98 and indicated weak to strong data correlations between the considered parameters. Representative empirical relation and correlation coefficient values of mechanical and physical properties of limestone with various core sample diameters are given in Table 2.
Excluding R–values for the ITS – wc, n, for sample diameter 24.94 mm, and R-values for PLIA(Is(50)) – wc for 53.93 mm (NX size), the correlation between UCS, PLID-A(Is(50)), ITS, SHV and wc, n are all represented by a negative linear equation, with corresponding R–values ranging from –0.15 to –0.97 (Fig. 2c–d; 3c–d; 4c–d, 5c–d, 6c–d). Thus, the relationships between the plotted pairs of parameters vary from weak to strong with negative linear correlations (see Table 2).
Some of equations obtained for the NX core limestone samples of this study, were compared with the reported equations in the literature for the same rock types and NX core size (see Table 3). The R–values (considered as good indicators for the strength and sign of the relationship between two variables) were computed using the best line fit equations like linear, power and exponential based on the obtained data and their distribution, respectively. The relationships between UCS, PLID(Is(50)), ITS, SHV and γn revealed in this study were compared with those of obtained in previous limited studies on limestone having NX size sample diameter (Fig. 7a, d, f, g). As shown in Table 3 and Fig. 7a, d, f, g, the computed equations provide good agreement with this study, and the regression coefficients (R) ranged from 0.55 to 0.95, medium to strong positive correlations. Similarly, the relationships between UCS, PLID-A(Is(50)), ITS, SHV and wc, n were compared with the previous reported studies (Fig. 7b, c, e, h) (Table 3). There were good agreements and the correlation coefficients varied from −0.30 to −0.75, indicating negative weak to strong correlations. UCS = Uniaxial Compressive Strength (MPa), PLI(D)(Is(50)) = Point Load Index (Diametrical) (MPa), ITS = Indirect Tensile Strength (MPa), SHV = Schmidt Hardness Value (N), γn = Natural Unit Weight of the Sample (kN/m3), wc = Water Content (%), n = Porosity (%).
Researchers
Sample diameter
(mm)Equations
R
Rock type
Tugrul and Zarif, 2000
54 (NX)
UCS = 144 − 17.29n
−0.77
Limestone
Arman et al., 2014
54 (NX)
UCS = 0.09e (0.26γn)
0.84
Limestone
PLI(Is(50)) = 1E-06 γn(4.7482)
0.57
ITS = 1E-11γn(8.468)
0.95
Arman et al., 2021
54 (NX)
UCS = 8E-09γn7.1282
0.77
Limestone
UCS = 123.17e−0.151wc
−0.67
UCS = 193.04n−0.487
−0.63
ITS = 0.856γn – 15.191
0.62
PLI(Is(50)) = 0.6683γn − 11.983
0.67
PLI(Is(50)) = 5.258e−0.097wc
−0.64
SHV = 2.4601γn – 24.909
0.72
SHV = 37.865wc−0.117
−0.60
This study
54 (NX)
UCS = 21.8γn – 462.1
0.73
Limestone
UCS = −203.6wc + 117.1
−0.50
UCS = −8.9n + 120.5
−0.75
PLI(D)(Is(50)) = 0.5γn − 9.6
0.55
PLI(D)(Is(50)) = −2.4wc + 4.8
−0.45
ITS = 1.7γn − 35.7
0.69
SHV = 5γn − 78.7
0.78
SHV = −11.8wc + 49.2
−0.30
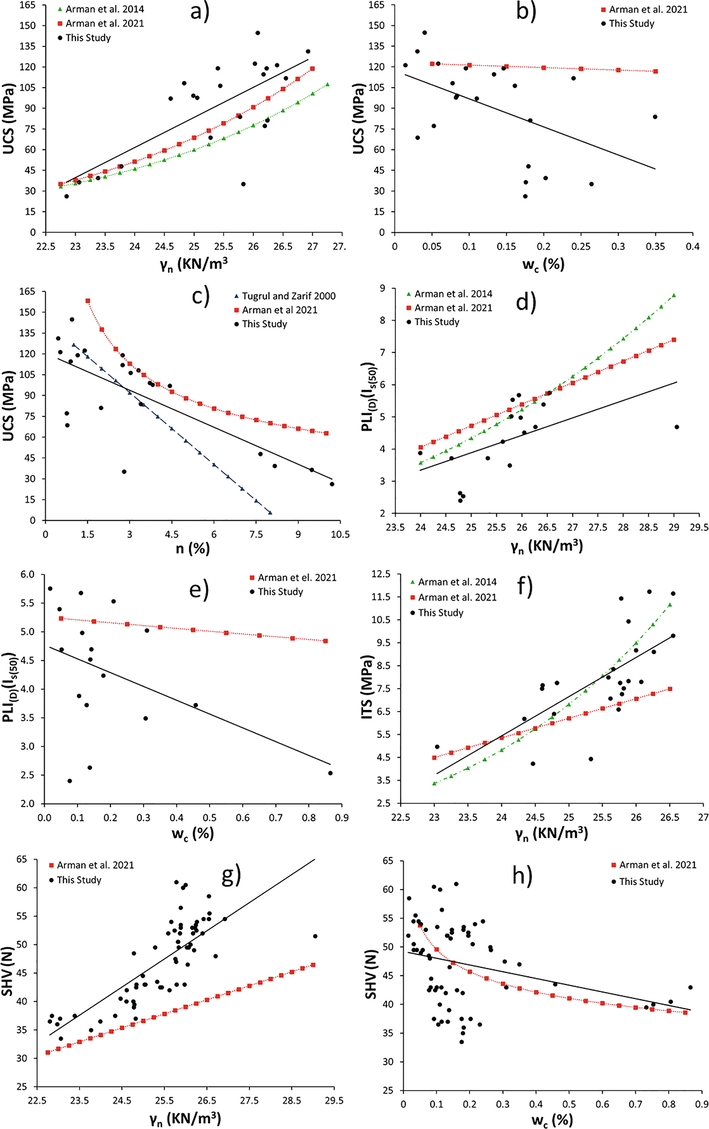
Comparison of previous studies results with this study; UCS vs. a) γn, b) wc and c) n; PLI(D)(Is(50)) vs. d) γn and e) wc; ITS vs. f) γn; SHV vs. g) γn and h) wc of limestone.
4 Conclusions
The effects of rock drill core sample diameter on the relationships between mechanical (UCS, PLID-A(Is(50)), ITS, SHV) and physical properties (γn, Gs, wc, n) of limestone were investigated on 190 limestone core samples with 24.94, 38.07, 47.7, 53.99 (NX) and 63.16 mm diameters. According to the test results, the following conclusions were drawn:
-
The linear regression analyses indicate weak to strong correlations between UCS, PLID-A(Is(50)), ITS, SHV and γn, Gs with exceptional cases of the ITS – γn, Gs for sample diameter 24.94 mm and PLIA(Is(50)) – γn, Gs for 53.93 mm (NX size). Therefore, in general, γn and Gs, which are easily measured physical parameters can be used to predict UCS, PLID-A(Is(50)), ITS, SHV of limestone within the corresponding correlation coefficient values (R).
-
Similarly, there are weak to strong, negative linear correlations between the plotted pairs of UCS, PLID-A(Is(50)), ITS, SHV and wc, n excluding the ITS – wc, n for sample diameter 24.94 mm and PLIA(Is(50)) – wc for 53.93 mm (NX size). Overall, based on the R-values, UCS, PLID-A(Is(50)), ITS, SHV of limestone can be simply predicted using wc and n, which are basic physical parameters that can be measured by simpler methods than those required for the mechanical parameters.
-
The relationships between UCS, PLID(Is(50)), ITS, SHV and γn, wc, n presented in this study were compared with the previous limited studies on limestone having NX size sample diameter. There was good agreement between earlier studies and the present study, indicating medium to strong positive correlations with R-values ranging 0.55 to 0.95 for γn. In term of wc and n, the agreement was good between the present and previous studies and R-values ranged from −0.30 to −0.75, indicating weak to strong correlations.
Variations in R-values may be attributed to the different compositional (mineralogical and chemical) and textural features amongst limestones. Therefore, the provided equations should be only use within the corresponding R-values for limestone, and more research is needed before generalizing these results to other rock types.
Acknowledgements
The United Arab Emirates University, Research Affairs financial supported this study under SURE 2016 grant.
Declaration of Competing Interest
The authors declare that they have no known competing financial interests or personal relationships that could have appeared to influence the work reported in this paper.
References
- Petrographical and geomechanical properties of the Lower Oligocene Limestones from Al Ain city, United Arab Emirates. Arab. J. Sci. Eng.. 2017;39(1):261-271.
- [CrossRef] [Google Scholar]
- Petrological control on engineering properties of carbonate rocks in arid regions. Bull. Eng. Geol. Environ.. 2021;80(6):4221-4233.
- [Google Scholar]
- Standard test method for unconfined compressive strength of intact rock core specimens. West Conshohocken, PA: ASTM International; 1995.
- Standard test method for determination of rock hardness rebound hammer method. West Conshohocken, PA: ASTM International; 1996.
- Standard test method for determination of the point load strength index of rock. West Conshohocken, PA: ASTM International; 2002.
- Standard test method for splitting tensile strength of intact rock core specimens. West Conshohocken, PA: ASTM International; 2001.
- Standard test methods for absorption and bulk specific gravity of dimension stone. West Conshohocken, PA: ASTM International; 2018.
- Standard practices for preparing rock core as cylindrical test specimens and verifying conformance to dimensional and shape tolerances. West Conshohocken, PA: ASTM International; 2019.
- Rock characterization testing and monitoring. Oxford, England: International Society of Rock Mechanics. Commission on Testing Methods. Pergamon Press; 1981.
- Geotechnical characterization of limestones employed for the reconstruction of a UNESCO world heritage Baroque monument in southeastern Sicily (Italy) Eng. Geol.. 2016;212:86-97.
- [CrossRef] [Google Scholar]
- Estimation of rock engineering properties using hardness tests. Eng. Geol.. 2007;90(3-4):138-147.
- [CrossRef] [Google Scholar]
- Engineering aspects of limestone weathering in Istanbul, Turkey. Bull. Eng. Geol. Environ.. 2000;58(3):191-206.
- [Google Scholar]
- Statistical analysis of the influence of water content on the strength of the Miocene limestone. Rock Mech. Rock Eng.. 2005;38(1):69-76.
- [CrossRef] [Google Scholar]


