

Translate this page into:
Interpretation of yield and quality traits of barley (Hordeum vulgare L.) varieties by heatmap technique
⁎Corresponding author. m.karaman@alparslan.edu.tr (Mehmet Karaman)
-
Received: ,
Accepted: ,
This article was originally published by Elsevier and was migrated to Scientific Scholar after the change of Publisher.
Abstract
Background
Barley (Hordeum vulgare L.) is the most cultivated cool-season cereal after wheat in Türkiye. This can be attributed to its uses in the malt industry, human consumption, and animal nutrition etc. This study investigated yield, physiological, and quality traits of different barley varieties using heatmap and principal component analysis (PCA) technique to identify the varieties with better yield and superior quality.
Methods
A total of 12 barley varieties (8 two-row and 4 six-row) were used in the study. The varieties were sown under natural conditions and data relating to yield, phenology and quality traits (grain yield, heading time, plant height, number of spikes m−2, 1000-grain weight, and starch ratio) were recorded. The recorded data were analyzed by PCA and heatmap techniques to determine the better-performing varieties.
Results
Significant variations were observed among the tested varieties for all evaluated traits (p < 0.01). Heatmap categorized the recorded traits into two clusters, and traits within the same cluster exhibiting interconnectedness. The primary cluster comprised of plant height, heading time, and 1000-grain weight. Similarly, the second significant cluster contained the varieties with similar grain yield, starch ratio, and the number of spikes m−2. The varieties ‘Bozlak’ and ‘Mert’, ‘Aydanhanim’ and ‘Tosunpaşa’, ‘Erciyes’ and ‘Çatalhüyük’, and ‘Sabribey’ and ‘Asutay’, exhibited significant resemblance for the recorded traits. The PCA revealed that 1000-grain weight was associated with the heading time, whereas starch ratio was associated with the grain yield. ‘Erciyes’ (3.58 tons ha−1), ‘Çatalhüyük 2001′ (2.95 tons ha−1), and ‘Bozlak’ (2.72 tons ha−1) recorded the highest yield, whereas ‘Erciyes’ variety resulted in the delayed heading. Similarly, ‘Çatalhüyük’, and ‘Erciyes’ produced the highest number of spikes m−2. Likewise, ‘Çatalhüyük 2001′, and ‘Tosunpaşa’ resulted in the heaviest 1000-grains, while ‘Asutay’ resulted in the highest starch ratio.
Conclusion
It is concluded that ‘Çatalhüyük’, ‘Erciyes’, and ‘Tosunpaşa’ are superior varieties in terms of yield-related traits, whereas ‘Asutay’ proved better for starch ratio. Therefore, these varieties could be used in future breeding programs to improve these traits.
Keywords
Barley
Multivariate analysis
Starch
Yield-related traits

1 Introduction
Barley (Hordeum vulgare L.) is one of the oldest cereals cultivated by early human societies (Badr et al., 2000). Barley is extensively used in the production of diverse food products due to its considerable nutritional composition, including dietary fibers, beta-glucan, arabinoxylan, protein, cellulose, and a substantial starch content (Meints and Hayes, 2019; Sönmez et al., 2020). Furthermore, it is also used as animal feed (Meints and Hayes, 2019; Newton et al., 2011). Barley is an annual cereal grain and exhibits optimal growth in regions characterized by cold temperatures (Hockett, 2000). It is used in the production of noodles, baby food, porridge, and malt (Meints and Hayes, 2019). Barley has exceptional tolerance ability to stress-induced challenges in crop production around the world (Elakhdar et al., 2022; Saed-Moucheshi et al., 2022; Thabet et al., 2023).
Global annual production of barley is 159 million tons from 51 million hectares with an average yield of 3.1 tons ha−1 (FAO, 2023; Kumari et al., 2024). Barley is the second most extensively cultivated crop in Türkiye, occupying an area of 3.8 million hectares, following wheat. The annual barley production in Türkiye amounts to 8.3 million tons (TÜİK, 2022). The complex genetics of grains result from the interaction between their physical and chemical features, which collectively contribute to their unique nature (Hayes et al., 2003). This facilitated the advancement of research endeavors aimed at further investigating barley and enhancing its overall quality (Brbaklić et al., 2021; Thabet et al., 2023). Furthermore, barley grain analysis denotes that it contains 8–27 % proteins, whereas the remaining 80 % is composed up of carbohydrates (Gous et al., 2017).
The main goal of barley breeding is to improve yields along with improving overall quality (Czembor, 2023; Riaz et al., 2021). The barley is cultivated globally on a significant area (FAO, 2023; Ullrich, 2010); therefore, yield and quality improvement through breeding is inevitable. Recent developments in the field of genetics and genomic has eased the goals. However, variations in the existing germplasm are the primary driver of breeding success (Verma et al., 2021). Limited genetic diversity results in the vulnerability of the crops to biotic and abiotic stresses. Consequently, novel genetic variations should be incorporated in the breeding programs to enhance the success rate. Genetic diversity and desired traits data could help to significantly increase the success in crop improvement for desired traits (Sallam et al., 2018). Nevertheless, morphological and yield-related traits provide valuable insights on the adaptability of various barley varieties to diverse climatic circumstances and their potential for enhancing crop productivity (Kim et al., 2023). The identification of superior traits could help breeders to improve crop yields (Desta et al., 2024). Hence, it is essential to choose genotypes with better agro-morphological traits for improving yield (Kadir et al., 2018; Karaman, 2022).
Different statistical techniques are employed to explore the genetic variability of available resources. Of these, multivariate analyses such as heatmap and principal component analysis (PCA) are popular ones. A heatmap is a graphical representation of a data matrix that displays the values in each cell using a color gradient. This provides a comprehensive summary of the highest and lowest values in the matrix. On the other hand, PCA is a commonly used technique for decreasing the number of dimensions in high-dimensional data. It is sometimes accompanied by the visualization of two of the resulting components on a scatterplot (Metsalu and Vilo, 2015).
Although barley is extensively produced in different parts of Türkiye, morphological, phenology, yield, and quality-related traits of available germplasm have rarely been explored. Therefore, the major objective of this study was to investigate the relationship between various yield and quality-related traits of different barley varieties by employing morphological association-based heatmap technique. Additionally, this research aimed to uncover the similarities that exist across various varieties of barley.
2 Materials and Methods
2.1 Experimental sites and barley varieties
The research was carried under rainfed conditions in Muş province located in the Eastern Anatolia Region of Türkiye during 2019–2020 and 2020–2021 (Fig. 1). Muş province is located between 38.29° and 39.29° northern latitudes and 41.06° and 41.47 ° eastern longitudes.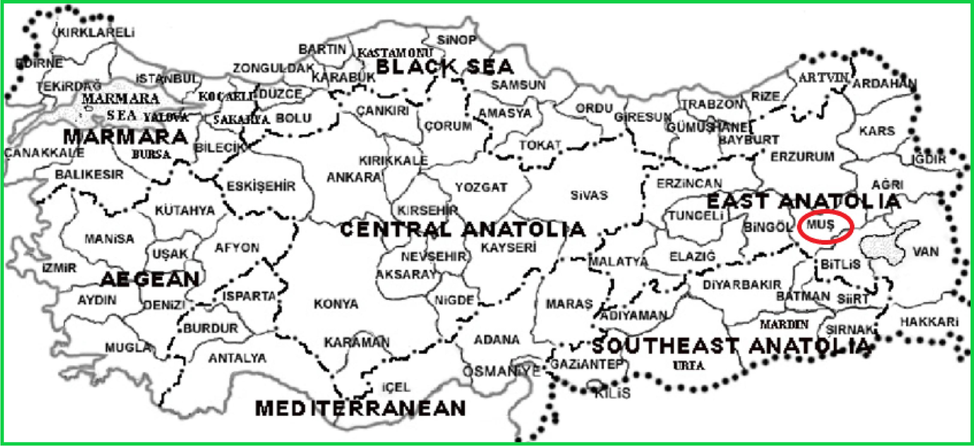
Türkiye map showing the location of the experimental area in the country.
The seeds of the varieties used in the study were obtained from different research institutes and universities in Türkiye. Eight 2-row and four 6-row barley varieties were included in the study. Two-row barley varieties were ‘Erciyes’, ‘Tosunpaşa’, ‘Burakbey’, ‘Sabribey’, ‘Aydanhanım’, ‘Bozlak’, ‘Çatalhüyük 2001′, and ‘Sladoran’. Six-rows barley varieties were, ‘Asutay’, ‘Olgun’, ‘Mert’, and ‘Hazar’.
2.2 Soil and weather attributes
The experimental soil was clayey, non-saline (0.2 %), low in phosphorus (32.1 kg ha−1), high in boron content (40.8 kg ha−1), insufficient organic matter amount (1.74 %) and slightly alkaline (pH: 8.2).
The total amount of precipitation in the first year of the study was close to the long-term average. However, precipitation in the second year was approximately half of the long-term average. The distribution of precipitation was irregular during the growing season (Fig. 2a).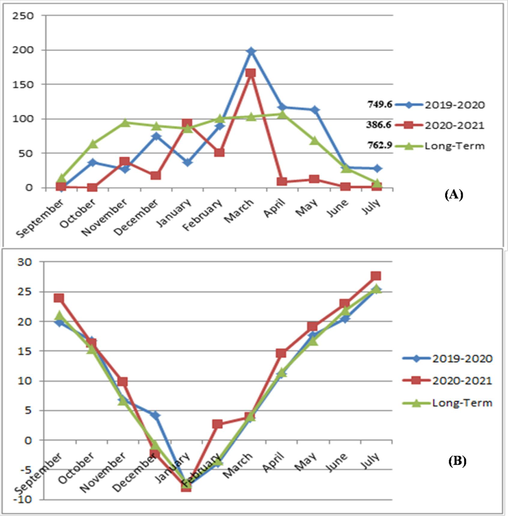
Precipitation (mm) (A) and temperature (°C) (B) of the growing seasons (2019–2020, and 2020–21) and their long-term averages in Muş province (mm).
The average temperature during 2019–2020 was lower than the long-term average except for October, December and January. On the contrary, temperature was above the average long-term values during 2020–2021 except for December, January and March (Fig. 2b). The first year of the study was cooler and the second year was warmer; therefore, harvesting was done 10–15 days earlier during the second year than in the first year.
2.3 Experimental setup
The experiment was conducted according to a completely randomized design with three replications. Experimental plots consisted of six 20 cm apart rows (7.2 m2). Sowing was done in October by keeping seed rate of 450 seeds per square meter. Harvesting was carried out in the last week of June with a Wintersteiger parcel combine harvester from 6 m2 area.
2.4 Data collection
Harvesting and threshing were done on parcel basis, where central 6 m2 area was harvested from each parcel and resulting grains were weighed and converted to ton/ha. The time from sowing to the appearance of 70 % spikes was recorded from each plot and regarded as heading time. The heights of ten randomly selected plants from each plot were measured and averaged to determine plant height. The number of spikes were counted from 2 different places (1 m2) and averaged. The thousand-grain weight was determined by weighing 1000 grains from each plot. Additionally, starch ratio was determined as reading the barley grain by means of the NIT (IM-550) device.
2.5 Statistical analysis
One-way analysis of variance was conducted using the JMP 13.0 pro package program (Jones and Sall, 2011). The least significant difference (LSD) post-hoc test was used to evaluate the differences among genotype means for the recorded traits. The significance levels used in the study were p < 0.01 and p < 0.05. Visual representations such as heatmap clustering (ClustVis) and PCA were used to better visualize data. These techniques were utilized in conjunction with morphological association-based heatmaps and PCA to establish correlations between the recorded traits (Metsalu and Vilo, 2015).
3 Results
3.1 Phenology, quality, and yield-related traits
Statistically significant differences (p < 0.01) were recorded among varieties for all the recorded traits. The significant year × variety effect (p < 0.01 or p < 0.05) for all the observed traits provided evidence that the varieties exhibit varying responses based on the specific years (Table 1). The average grain yield was 2.02- and 2.09-tons ha−1 during the first and second year, respectively. The highest yield (2.95 tons ha−1) was recorded for ‘Çatalhüyük 2001′ variety during first year, whereas ‘Erciyes’ variety produced the highest (3.58 tons ha−1) yield during second year. The average across years denoted that ‘Erciyes’ (3.58 tons ha−1), ‘Çatalhüyük 2001′ (2.95 tons ha−1), and ‘Bozlak’ (2.72 tons ha−1) produced the highest grain yield during the study (Table 2). Df = degree of freedom, GY=grain yield, HT=heading time, PH=plant height, SN=number of spikes per square meter, TGW=1000-grain weight, SR=starch ratio, *: p ≤ 0.05; **: p ≤ 0.01; n.s = non-significant, CV=coefficient of variation GY=grain yield, HT=heading time, PH=plant height, SN=number of spikes per square meter, **: p ≤ 0.01.
Source of Variation
Mean squares
df
GY
HT
PH
SN
TGW
SR
Year
1
722.2n.s
29605.6**
882*
734169**
4491.9**
19.636n.s
Variety
11
22691.4**
77.4**
423.7**
50767.3**
48.3**
2.8**
Year × Variety
11
8254.2**
15.0**
108.5*
6883.6*
47.2**
0.9*
Error
44
721.6
3.4
51.5
2976.6
6.8
0.4
CV (%)
13.1
1.1
10.8
15.1
7.4
1.1
Varieties
GY (ton/ha)
Mean
HT (days)
Mean
PH (cm)
Mean
SN (m−2)
Mean
2020
2021
2020
2021
2020
2021
2020
2021
Erciyes
2.21
3.58
2.89
196.7
184.0
190.4
69.3
69.3
69.3
632.7
413.8
523.3
Tosunpaşa
1.89
2.13
2.01
192.0
185.3
188.7
78.7
75.0
76.8
337.7
225.0
281.3
Asutay
2.27
2.20
2.24
196.7
183.0
189.9
59.3
59.0
59.2
415.0
250.0
332.5
Burakbey
1.72
2.32
2.02
193.7
184.3
189.0
66.0
63.7
64.8
455.0
185.0
320.0
Olgun
0.88
0.93
0.91
191.3
185.0
188.2
84.3
65.0
74.7
340.0
115.0
227.5
Sabribey
2.42
1.19
1.81
188.3
183.0
185.7
59.0
57.0
58.0
475.0
309.2
392.1
Aydanhanım
2.23
2.90
2.56
191.7
186.7
189.2
80.7
57.0
68.8
455.0
269.2
362.1
Bozlak
2.45
2.99
2.72
193.3
186.3
189.8
81.3
74.7
78.0
537.7
296.2
416.9
Çatalhüyük
2.95
2.67
2.81
190.3
183.3
186.8
77.7
62.3
70.0
691.7
367.7
529.7
Mert
2.22
1.02
1.62
186.7
181.3
184.0
72.0
61.7
66.8
335.0
262.7
298.8
Sladoran
1.46
1.36
1.41
185.7
183.0
184.4
53.7
49.0
51.3
443.3
230.0
336.7
Hazar
1.55
1.74
1.64
182.0
173.7
177.9
55.0
59.3
57.2
420.0
190.8
305.4
Mean
2.02
2.09
205
190.7
183.2
187.0
69.8
62.8
66.2
461.5
259.5
360.5
CV (%)
11.8
14.2
13.1
1.1
0.8
1.0
12.3
8.6
10.8
15.7
10.1
15.1
LSD (0.05)
0.4**
0.5**
0.3**
3.6**
2.5**
2.1**
14.6**
9.1**
8.4**
122.8**
44.6**
63.5**
The earliest heading time was noted for ‘Hazar’ variety during both years as well as average across years. The most recent varieties, i.e., ‘Erciyes’ and ‘Asutay’ during first year and ‘Aydanhanım’ during second year exhibited delayed heading. Overall, ‘Erciyes’ variety demonstrated superior heading trait.
The ‘Olgun’ variety had a mean height of 84.3 cm in the first year, while ‘Tosunpaşa’ achieved a mean height of 75.0 cm in the second year. Overall, ‘Bozlak’ variety had the longest height (78.0 cm), making it the leading variety in terms of height. During the second year, ‘Olgun’, ‘Aydanhanım’, and ‘Çatalhüyük 2001′ experienced a reduction in height due to drought stress. Conversely, ‘Erciyes’, ‘Asutay’, and ‘Sabribey’ proved less susceptibility drought (Table 2).
The ’Çatalhüyük 2001′ (691.7–529.7 spikesm−2) and Erciyes (413.8 spikes m−2) varieties produced the highest number of spikes during the first and second year of the study, respectively. The grain yield of barley is closely related to the number of productive spikes; hence, the varieties with higher number of productive spikes produce higher yield.
Thousand-grain weight is one of the important yield-related traits. The ‘Çatalhüyük 2001′ (50.4 g), and ‘Tosunpaşa’ (33.4 g and 38.98 g) varieties produced the heaviest thousand grains during the first and second year of the study, respectively. A sharp decline was recorded in thousand-grain weight during the second year because of low rainfall, high temperature and drought stress (Table 3). TGW=1000-grain weight, SR=starch ratio, *: p ≤ 0.05; **: p ≤ 0.01; n.s = non-significant.
Varieties
TGW (g)
Mean
SR (%)
Mean
2020
2021
2020
2021
Erciyes
48.3
26.8
37.54
61.6
60.5
61.03
Tosunpaşa
44.6
33.4
38.98
60.9
58.7
59.82
Asutay
38.3
26.3
32.26
62.4
61.0
61.70
Burakbey
46.0
28.5
37.25
62.0
60.9
61.45
Olgun
38.8
29.5
34.13
61.1
59.8
60.43
Sabribey
44.4
23.1
33.75
61.8
60.6
61.17
Aydanhanım
45.8
28.5
37.13
61.2
59.7
60.45
Bozlak
46.7
27.6
37.13
61.2
59.3
60.28
Çatalhüyük
50.4
25.4
37.92
59.8
59.9
59.87
Mert
36.7
27.4
32.03
59.5
60.0
59.77
Sladoran
43.1
25.3
34.18
60.5
59.4
59.97
Hazar
34.2
25.9
30.03
61.2
61.0
61.07
Mean
43.1
27.3
35.19
61.1
60.1
60.58
CV (%)
3.8
12.1
7.4
0.9
1.2
1.1
LSD (0.05)
2.8**
n.s
3.0**
0.9**
1.2*
0.7**
The ‘Asutay’ (62.4 % and 61.70 %), and ‘Hazar’ (61.0 %) and ‘Asutay’ (61.0 %) varieties resulted in the highest starch ratio during the first and the second year of the study (Table 3).
3.2 Interpretation of varieties and traits with heatmap
The present work generated morphological association heatmaps to elucidate the correlation between varieties and recorded traits. Heatmap denoted that the traits may be categorized into two distinct primary clusters. The first cluster included plant height, heading time, and thousand-grain weight, while the second cluster consisted of starch ratio, grain yield, and number of spikes m−2 (Fig. 3).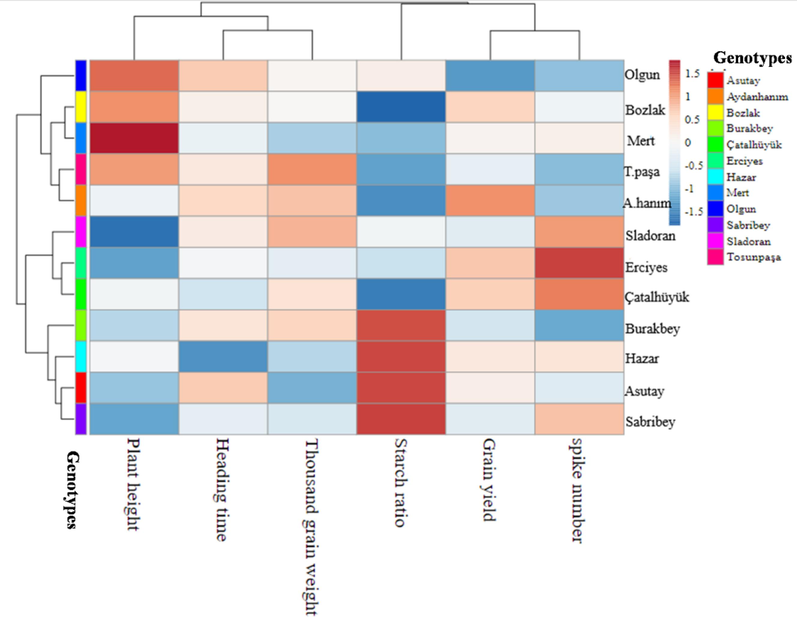
Heatmap of the morphological association among measured traits of different barley varieties included in the study.
A significant association was observed between grain yield and starch ratio, as well as the number of spikes m−2 (Fig. 3). Moreover, each primary cluster was further subdivided into two secondary clusters within its own structure. Upon examination of the subsets, it was seen that heading time and thousand-grain weight were grouped together in one subset, while plant height was placed in a separate subset. Furthermore, it was noted that the starch ratio was situated in a distinct subset, although both grain yield and the number of spikes m−2 were found in the same subset. This finding demonstrates a robust and statistically significant correlation between heading time and thousand grain weight, as well as between grain yield and the number of spikes per square meter.
Morphological association indicated that ‘Bozlak’ and ‘Mert’, ‘Aydanhanim’ and ‘Tosunpaşa’, ‘Erciyes’ and ‘Çatalhüyük’, as well as ‘Sabribey’ and ‘Asutay’ varieties exhibited the highest degree of resemblance with respect to the recorded traits in the current study. Furthermore, the barley varieties ‘Olgun’ and ‘Sabribey’, as well as ‘Asutay’ and ‘Bozlak’, were identified as the most dissimilar based on the coding analysis (Fig. 3).
The link between the accuracy ratio and traits is elucidated by PCA graph (Fig. 4). The PC1 accounted for 45.7 % of the variance, whereas PC2 accounted for 28.3 % of the variance, and the combined effect of PC1 and PC2 explained 74 % of the variance. In recent years, numerous researchers have used PCA as a method for facilitating the understanding of characteristics and/or genotypes. The PCA involves the utilization of horizontal (x) and/or vertical (y) axes, enabling a more accessible representation of the data. The PCA graph illustrates the interconnectedness of grain yield, number of spikes per square meter, and starch ratio. Notably, there exists a robust correlation between grain yield and the number of spikes per square meter, as shown by cluster 1 in Fig. 4.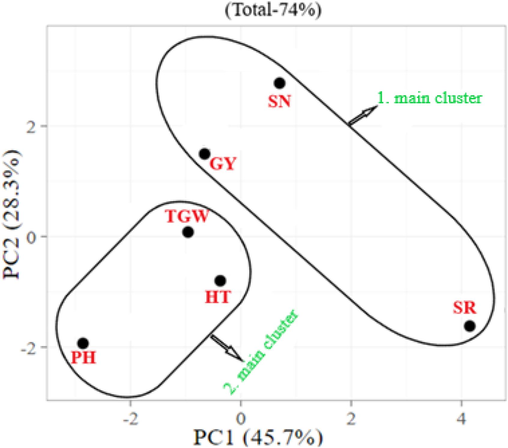
Visual representation of the relationship between different measured traits of different barley varieties included in the study. GY=grain yield, HT=heading time, PH=plant height, SN=number of spikes per square meter, TGW=1000-grain weight, SR=starch ratio.
In the second cluster, a correlation was detected between heading time, plant height, and thousand-grain weight. It may be argued that there exists a significant correlation between the thousand-grain weight and heading time, as seen by cluster 2 in Fig. 4.
4 Discussion
There are several methodologies available for assessing the qualitative characteristics and production of barley, among which the heatmap technique is considered reliable (Jadidi et al., 2022; Zhou et al., 2022). The use of genomic prediction for the estimation of yield and malting-related variables has been shown in several studies investigating the genetic prediction of agronomic and malting quality parameters in barley (Czembor, 2023; Desta et al., 2024; Kim et al., 2023; Riaz et al., 2021). The heatmap has the potential to provide information on the variations in yield-related stability and performance across many cultivars (Metsalu and Vilo, 2015). Barley breeding and development programs may get valuable insights from these research findings, as they demonstrate a diverse array of approaches used to analyze the yield and quality characteristics of the crop (Czembor, 2023; Kumari et al., 2024; Riaz et al., 2021).
Environmental conditions play a crucial role in shaping the performance of genotypes and determining grain yield. The grain yield is positively influenced by environmental conditions that are favorable or close to optimum, whilst unfavorable conditions have a detrimental effect on the yield (Farshadfar et al., 2012). Numerous studies have been undertaken to investigate the effectiveness of genetic, ecological, and agronomic techniques in relation to the grain yield of barley (Cammarano et al., 2019; Kadir et al., 2018; Karaman, 2022).
Several studies have shown that plants experience a reduction in photosynthetic rate and osmotic potential when subjected to drought stress (Kennedy and Garaita, 2000; Taiz and Zeiger, 2015). The decreased photosynthesis leads to decreased plant height due to morphological shortening. A comparison between heading time and grain production revealed that heredity had a greater influence than environmental variables on heading time (Karaman, 2022; Reif et al., 2011).
One potential explanation for the reduced thousand-grain weights is the inability of the starch accumulation rate to compensate for the decrease in the duration of the starch accumulation period (Högy et al., 2013; Nicolas et al., 1984). The formation of the primary starch structure occurs during the early phase of grain filling, resulting in the production of sizable lenticular granules. Spherical granules of small size are formed at the last stage of grain filling (Geera et al., 2006; Gous et al., 2017).
The heatmap color scale utilizes shades of blue to signify a drop in value, while shades of red indicate an increase (Metsalu and Vilo, 2015). The data matrix is used as a technique to convert the data contained inside the cells into a visual representation, including the utilization of a color scale. Evaluating individual data points inside a cell may be a time-consuming and challenging task for researchers. The clusters in the heatmap are represented by the rows and/or columns of the Matrix, which aids in the understanding process. There is a widely acknowledged consensus that a substantial correlation exists among the characteristics within a given cluster. The chart’s use of distinct and discernible colors facilitates the differentiation of prominent genotypes and/or those that have similarities in terms of observable features (Harrower and Brewer, 2003; Metsalu and Vilo, 2015; Stavridou et al., 2021).
5 Conclusion
Significant variations were observed among the tested varieties for all evaluated traits. Heatmap categorized the recorded traits into two clusters, and traits within the same cluster exhibiting interconnectedness. The primary cluster comprised of plant height, heading time, and 1000-grain weight. Similarly, the second significant cluster contained the varieties with similar grain yield, starch ratio, and the number of spikes m−2. The varieties ‘Bozlak’ and ‘Mert’, ‘Aydanhanim’ and ‘Tosunpaşa’, ‘Erciyes’ and ‘Çatalhüyük’, and ‘Sabribey’ and ‘Asutay’, exhibited significant resemblance for the recorded traits. The PCA revealed that 1000-grain weight was associated with the heading time, whereas starch ratio was associated with the grain yield. ‘Erciyes’, ‘Çatalhüyük 2001′, and ‘Bozlak’ recorded the highest yield, whereas ‘Erciyes’ variety resulted in the delayed heading. Similarly, ‘Çatalhüyük’, and ‘Erciyes’ produced the highest number of spikes m−2. Likewise, ‘Çatalhüyük 2001′, and ‘Tosunpaşa’ resulted in the heaviest 1000-grains, while ‘Asutay’ resulted in the highest starch ratio. It is concluded that ‘Çatalhüyük’, ‘Erciyes’, and ‘Tosunpaşa’ are superior varieties in terms of yield-related traits, whereas ‘Asutay’ proved better for starch ratio. Therefore, these varieties could be used in future breeding programs to improve these traits.
CRediT authorship contribution statement
Mehmet Karaman: Writing – review & editing, Writing – original draft, Visualization, Validation, Software, Project administration, Methodology, Investigation, Formal analysis, Data curation, Conceptualization. Seyithan Seydoşoğlu: Writing – review & editing, Software, Methodology, Conceptualization. Tomáš Vyhnánek: Writing – review & editing, Visualization, Validation, Software, Methodology, Conceptualization. M. Ajmal Ali: Writing – review & editing, Visualization, Project administration, Funding acquisition, Conceptualization. Mohamed Soliman Elshikh: Writing – review & editing, Visualization, Validation, Project administration, Funding acquisition, Conceptualization.
Acknowledgement
The authors extend their appreciation to the Researchers supporting project number (RSP2024R306), King Saud University, Riyadh, Saudi Arabia.
References
- Badr, A., M, K., Sch, R., Rabey, H. El, Effgen, S., Ibrahim, H.H., Pozzi, C., Rohde, W., Salamini, F., 2000. On the Origin and Domestication History of Barley (Hordeum vulgare). Mol Biol Evol 17, 499–510. Doi: 10.1093/oxfordjournals.molbev.a026330.
- Genetic Diversity and population structure of serbian barley (Hordeum vulgare L.) collection during a 40-year long breeding period. Agronomy. 2021;11:118.
- [CrossRef] [Google Scholar]
- Rainfall and temperature impacts on barley (Hordeum vulgare L.) yield and malting quality in Scotland. Field Crops Res. 2019;241:107559
- [CrossRef] [Google Scholar]
- Barley genetic resources: advancing conservation and applications for breeding. Agronomy. 2023;13:2901.
- [CrossRef] [Google Scholar]
- Comprehensive Characterization of Global Barley (Hordeum vulgare L.) Collection Using Agronomic Traits, β-Glucan Level, Phenolic Content, and Antioxidant Activities. Plants. 2024;13:169.
- [CrossRef] [Google Scholar]
- Barley with improved drought tolerance: Challenges and perspectives. Environ Exp Bot. 2022;201:104965
- [CrossRef] [Google Scholar]
- FAO, 2023. Crops and livestock products [WWW Document]. FAOSTAT Crops and livestock products. URL https://www.fao.org/faostat/en/#data/QCL (accessed 1.27.23).
- GGE biplot analysis of genotype x environment interaction in wheat-barley disomic addition lines. Aust J Crop Sci. 2012;6:1074-1079.
- [Google Scholar]
- Composition and Properties of A- and B-type Starch Granules of Wild-Type, Partial Waxy, and Waxy Soft Wheat. Cereal Chem. 2006;83:551-557.
- [CrossRef] [Google Scholar]
- Drought-Proofing Barley (Hordeum vulgare): the effects of stay green on starch and amylose structure. Cereal Chem. 2017;94:873-880.
- [CrossRef] [Google Scholar]
- ColorBrewer.org: An Online Tool for Selecting Colour Schemes for Maps. Cartogr J. 2003;40:27-37.
- [CrossRef] [Google Scholar]
- Genetic diversity for quantitatively inherited agronomic and malting quality traits. Developments in Plant Genetics and Breeding. 2003:201-226.
- [CrossRef] [Google Scholar]
- Hockett, E.A., 2000. Barley, in: Handbook of Cereal Science and Technology, Revised and Expanded. CRC Press, pp. 81–125.
- Impacts of temperature increase and change in precipitation pattern on crop yield and yield quality of barley. Food Chem. 2013;136:1470-1477.
- [CrossRef] [Google Scholar]
- Physiological and molecular responses of barley genotypes to salinity stress. Genes (Basel). 2022;13:2040.
- [CrossRef] [Google Scholar]
- JMP statistical discovery software. Wiley Interdiscip Rev Comput Stat 2011
- [CrossRef] [Google Scholar]
- GGE-biplot analysis of yield stability in environment trial of tropical wheat (Triticum aestivum L.) genotype under dry season in Indonesia. Research on Crops. 2018;19:680-688.
- [Google Scholar]
- Relationship between physiological characteristics and grain yield of barley (Hordeum vulgare L.) Cultivars. Bangladesh J Bot. 2022;51:737-745.
- [CrossRef] [Google Scholar]
- Exome-wide variation in a diverse barley panel reveals genetic associations with ten agronomic traits in Eastern landraces. J. Genet. Genomics. 2023;50:241-252.
- [CrossRef] [Google Scholar]
- Kumari, S.G., Makkouk, K.M., Najar, A., 2024. Barley, in: Viral Diseases of Field and Horticultural Crops. Elsevier, pp. 55–61. Doi: 10.1016/B978-0-323-90899-3.00076-8.
- Breeding Naked Barley for Food, Feed, and Malt. in: Plant Breeding Reviews. Wiley; 2019. p. :95-119.
- ClustVis: a web tool for visualizing clustering of multivariate data using Principal Component Analysis and heatmap. Nucleic Acids Res. 2015;43:W566-W570.
- [CrossRef] [Google Scholar]
- Crops that feed the world 4. Barley: a resilient crop? Strengths and weaknesses in the context of food security. Food Secur. 2011;3:141-178.
- [CrossRef] [Google Scholar]
- Effects of drought and high temperature on grain growth in wheat. Funct. Plant Biol.. 1984;11:553.
- [CrossRef] [Google Scholar]
- Mapping QTLs with main and epistatic effects underlying grain yield and heading time in soft winter wheat. Theor. Appl. Genet.. 2011;123:283-292.
- [CrossRef] [Google Scholar]
- Advances in genomics-based breeding of barley: molecular tools and genomic databases. Agronomy. 2021;11:894.
- [CrossRef] [Google Scholar]
- Screening barley varieties tolerant to drought stress based on tolerant indices. J Plant Nutr. 2022;45:739-750.
- [CrossRef] [Google Scholar]
- Sallam, A., Amro, A., EL-Akhdar, A., Dawood, M.F.A., Kumamaru, T., Stephen Baenziger, P., 2018. Genetic diversity and genetic variation in morpho-physiological traits to improve heat tolerance in Spring barley. Mol Biol Rep 45. Doi: 10.1007/s11033-018-4410-6.
- Determination of some malting quality traits of barley (Hordeum vulgare L.) breeding material and relationships between these traits. Black Sea Journal of Agriculture. 2020;3:155-161.
- [Google Scholar]
- Characterization of the genetic diversity present in a diverse sesame landrace collection based on phenotypic traits and EST-SSR Markers Coupled With an HRM Analysis. Plants. 2021;10:656.
- [CrossRef] [Google Scholar]
- Plant Physiology (6th ed,). Annals of Botany; 2015.
- Genetic associations underpinning the metabolite-mediated salt stress tolerance in barley. Plant Mol Biol Report 2023
- [CrossRef] [Google Scholar]
- TÜİK, 2022. Türkiye İstatistik Kurumu. Turkish Statistical Institute. https://data.tuik.gov.tr/Kategori/GetKategori?p=tarim-111&dil=1.
- Barley: Production, improvement, and uses. John Wiley & Sons; 2010.
- Genetic and Agro-morphological diversity in global barley (Hordeum vulgare L.) collection at ICARDA. Genet Resour Crop Evol. 2021;68:1315-1330.
- [CrossRef] [Google Scholar]
- Transcriptome and Metabolite Insights into Domestication Process of Cultivated Barley in China. Plants. 2022;11:209.
- [CrossRef] [Google Scholar]


