

Translate this page into:
Integrated analysis of wireline logs analysis, seismic interpretation, and machine learning for reservoir characterisation: Insights from the late Eocene McKee Formation, onshore Taranaki Basin, New Zealand
⁎Corresponding author. Johnndammy@gmail.com (John Oluwadamilola Olutoki),
⁎⁎Corresponding author. numair.siddiqui@utp.edu.my (Numair Ahmed Siddiqui)
-
Received: ,
Accepted: ,
This article was originally published by Elsevier and was migrated to Scientific Scholar after the change of Publisher.
Abstract
This study aims to integrate seismic and well data for re-assessment and delineating the geological and petrophysical characteristics of the Late Eocene McKee Formation. Despite the McKee Formation being a hydrocarbon-producing field, there have been no previous integrated studies conducted to characterize its deposits in the Taranaki Basin. To execute these tasks, the process involves the interpretation of seismic data, wireline analysis, and 3D porosity volume prediction using multi-layered feed-forward neural network models. The seismic data was interpreted and found to contain low displacement faults due to intricate geometric complexities, the contour map that was generated shows lateral extension and thickness variation, and the region of direct hydrocarbon indicators was detected using the root-mean-square. Additionally, the seismic inversion provides a comprehensive understanding of the acoustic impedance variations from low to high value, which signifies the presence of mudstone clasts content. Furthermore, in the wireline log analysis, the reservoir was found to be a Silici-clastic and carbonate field owing to the presence of dolomite, calcite, and quartz. After applying cutoffs, petrophysical parameters were evaluated. The estimated values for effective porosity, reservoir thickness, shale volume, and water and hydrocarbon saturation were 15.04 % to 17.29 %, 85.44 m to 122.41 m, 8.99 to 14.87 % and 12.97–27.10 %, and 72.9 % to 87.03 %, respectively. The outcome of this extensive research aids in accurately characterizing this region for the future prospectively of the field. This integrated study can be applied and adapted to other basins in New Zealand and the southwestern Pacific. The proposed workflow is also suitable for analogous scenarios in various basins worldwide.
Keywords
Seismic inversion, Porosity
Neural network model
McKee Formation
Kapuni field
Taranaki Basin

1 Introduction
Modelling to optimise oil and gas production, discover and advance new fields and fulfil the world's demand for hydrocarbons has become more challenging due to geological constraints such as the depth and quality of the reservoirs and because most of the readily accessible hydrocarbon reserves have already been found; therefore, oil and gas exploration technologies have undergone substantial changes (Makarian et al., 2023; D. A. Martyushev et al., 2023). In response to this, the present approach involves giving higher importance to hydrocarbon production growth and exploring challenging geological & tectonic settings to make discoveries (Martyushev et al., 2023a; Salman et al., 2023; Sarhan, 2021a). Consequently, reservoir assessments now involve the integration of geological, geophysical, and geostatistical data in comprehensive reservoir studies considering structural, elastic, and petrophysical properties (Abdel-Fattah et al., 2023; Haque et al., 2022; Shehata et al., 2023; Martyushev et al., 2023b).
Therefore, an interdisciplinary approach is applied in this research to analyse the petrophysical properties and structural settings of the Late Eocene McKee Formation located in the Taranaki Basin (Fig. 1). It’s a sandstone shoreface deposit that typically has a thickness of less than 100 m, they are predominantly massive, light colour, with high quartz content, and a grain size ranging from fine to coarse. These were primarily shaped by depositional influence, with diagenetic and depositional processes controlling the grain size, compositional framework, sorting, and primary fabrics. Additionally, some interbedded mud clasts, coals and carbonaceous materials can be found within these reservoir rocks. This Formation is found in wireline logs in the eastern and central Taranaki Graben. It is a member of the Kapuni Group, a geological unit that spans from the Palaeocene to the Eocene (Dong et al., 2018).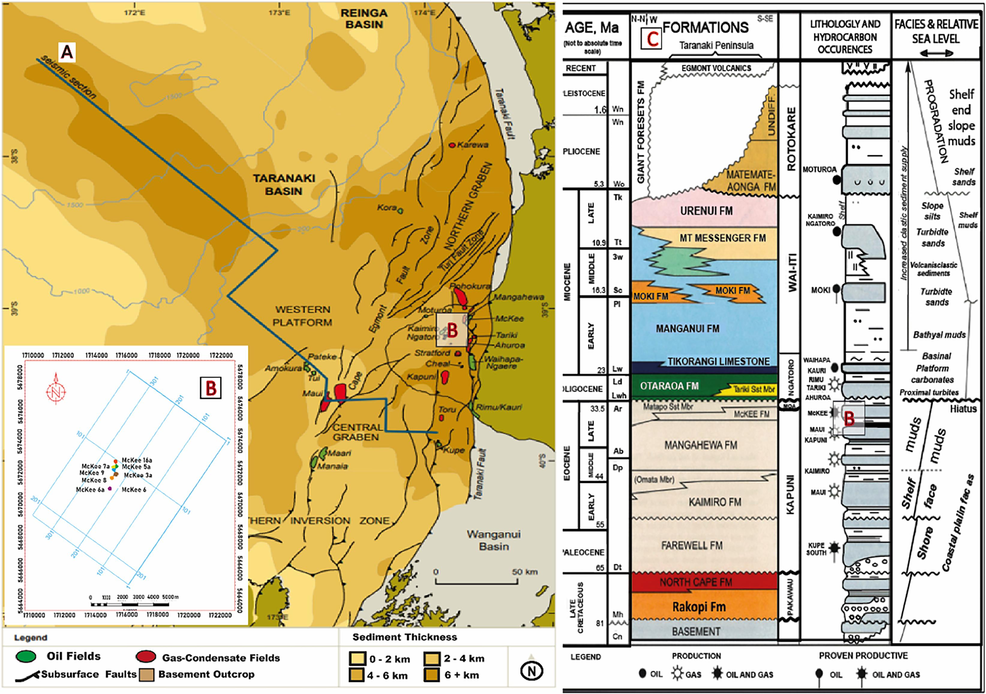
(A) The structural map displays the principal faults, sediment thickness, and locations of oil and gas fields in the Taranaki basin following (NZP&M, 2014); (B) The base map displays the data utilized in this research, such as the locations of the McKee wireline log and seismic survey; (C) The onshore Taranaki Basin Chrono-stratigraphic chart illustrates the principal stratigraphic units and their lateral extent in an east–west direction. (Dong et al., 2018).
The McKee field's structural development is found within a thrust-faulted anticline that's located within the Tarata Thrust Zone. The primary structure was formed through westward over thrusting on a low-angle “sled-runner” fault caused by regional compression during the Early-Mid Miocene period. Due to this, the field has become structurally intricate and is intersected by faults that have been thrust backwards (eastwards) from the main controlling fault. As a result, hydrocarbons in the field are trapped within north–south trending elongated high points contained within specific fault-controlled blocks (King et al., 2009). (Dong et al., 2018) using well, core and thin-section photomicrograph data, studied the petrophysical and petrographical properties of this reservoir.
However, no existing literature has integrated seismic and logging data to assess this reservoir's potential and distribution. This study focuses on 3D characterization of the McKee Field to address this gap, leveraging the integration of seismic data's lateral resolution and well logs' vertical resolution. Therefore, an integrated study of seismic inversion, structural interpretation, wireline log evaluation, and porosity volume was conducted, crucial for accurately evaluating and characterizing hydrocarbon reservoirs, enhancing the likelihood of successful exploration and development projects.
2 Geology and stratigraphy of the study area
The Taranaki basin can be broadly classified into two regions: the eastern mobile belt and the western stable platform, as depicted in Fig. 1A. The Western Stable Platform, which extends more than 100 km in width, constitutes the western portion of the basin entirely situated offshore. Although it has been affected by the late Cretaceous-Eocene normal faulting, which comprises the N-S to NE-SW trending Cape Egmont Fault Zone, it generally has a wide, simple structure and 2–5 km of Late Cretaceous–Recent sediments. The eastern mobile belt and the western stable platform are divided by the Cape Egmont fault zone, which trends N-NE (Dong et al., 2018).
The Late Eocene (35–38 Ma) McKee Formation which is the subject of this study, is layered with the coaly Mangehewa Formation (possible source rock). It is in the eastern mobile belt of the Taranaki Basin, in the Tarata Thrust Zone. it is made up of sediment from the inner shelf-coastal zone, which has a reservoir that is primarily sandy. This reservoir contains hydrocarbons trapped within north–south trending faulted blocks that extend laterally across the Taranaki Basin. Its steep inclination reaches up to 60 degrees (Dong et al., 2018).
3 Methodology
The study utilized Petrel software for seismic data interpretation and Hampson-Russell for seismic inversion. The Ministry of Business, Innovation, and Employment in New Zealand provided the seismic data in SEG-Y format and well-logging data in LAS format used. Seismic data polarity is SEG normal, where a peak or positive amplitude reflects increasing acoustic impedance boundaries. Alignment of coordinate systems between well reports and the Petrel platform's CRS was crucial before importing data, involving wireline log coordinate conversion via services provided by https://www.linz.govt.nz (Haque et al., 2022). Seismic data underwent quality control measures like Structural Smoothing to improve its overall quality for analysis because they were mostly of subpar quality, contained random noise and low resolution within the area of interest. This limitation stemmed from the challenging nature of the overthrust zone, featuring complex geometries, variations in velocities, limited data acquisition leading to low fold coverage, and rugged terrain exacerbating the challenge (Ghisetti, 2014; Jennings, 2003a).
3.1 Seismic Interpretation
The subsurface seismic dataset consists of a 3D seismic grid with a surface area of roughly 82.96 km2 (Fig. 1), which has 220 lines and 378 crosslines. Seismic interpretation process involves converting coordinates, loading data, establishing well-seismic connections, recognizing, and mapping horizons, and finalizing time-to-depth conversions. The alignment of seismic data with wireline logs data was accomplished by utilizing a synthetic seismogram, effectively connecting individual seismic reflectors with their corresponding stratigraphic markers. Synthetic seismograms were produced by convolving the reflectivity series obtained from density and sonic logs, with wavelets that had been extracted from the chosen zone of interest, which is roughly between 1450 and 1580 ms. The synthetic seismic traces derived were then compared to real seismic data at the McKee 5a well locations (Fig. 2) to map the horizons. To find promising hydrocarbon leads, two-way time (TWT) and depth contour maps were created using the underlying strata and structures. Both display depth variation and two-way travel time to the selected horizon.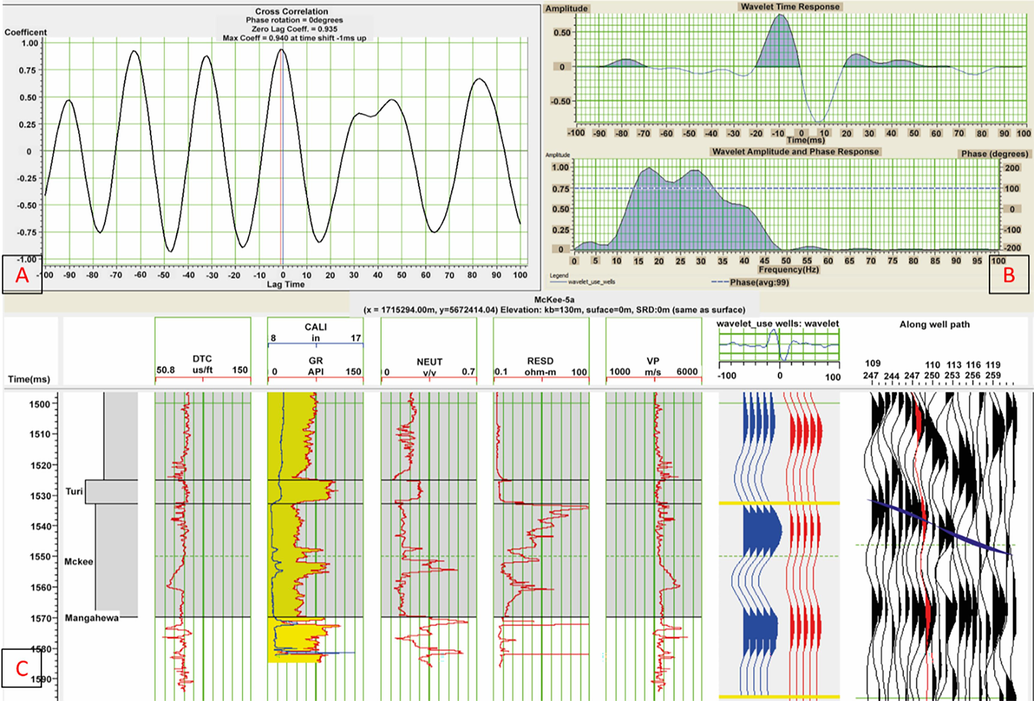
Synthetic Seismogram generated by convolving a wavelet derived from the seismic profile with a series of reflection coefficients obtained from sonic and density log data at well McKee 5a. (A) Cross-correlation and wavelet extracted (B) Wavelet estimate from the well logs (C) The correlation between the synthetic trace (blue) and the seismic trace (red) is displayed by the well-to-seismic tie. (For interpretation of the references to colour in this figure legend, the reader is referred to the web version of this article.)
3.2 Seismic inversion
Model-based inversion, used to invert seismic data, integrates well log and seismic data by modelling log data using seismic information inversely. Its precision relies on geological features, logging data, seismic data resolution, target signal-to-noise ratio, inversion technique flexibility, and chosen processing parameters. The process begins with generating a synthetic seismogram from calibrated sonic and density well logs (Fig. 2), followed by employing a suitable algorithm to generate inverted seismic sections. To enhance the inversion process, a frequency model incorporating low frequencies absent from seismic data is created. This model, especially useful in filling the frequently lost 0 to 15 Hz low-frequency range in seismic data acquisition, provides additional data sources, improving inversion quality and increasing neural network training and prediction accuracy.
3.3 Estimation of porosity using the MLFN modeling
Porosity is crucial for reservoir characterization, impacting hydrocarbon reserves, well placement, and production forecasting. Core data provides the most reliable estimates, but it's limited and costly. Previously, petrophysical parameters were estimated at uncored intervals through regression of core-log datasets using statistical methods, but this approach is unreliable due to limited wireline logging data. Incorporating seismic attributes has greatly improved property prediction accuracy and expedited predictions (Akinyemi et al., 2023; Rashid et al., 2022).
This study enhanced lateral porosity prediction in the field's undiscovered potential region by integrating seismic attributes with a multilayer feed-forward network (MLFN), also known as a multilayer perceptron (MLP). MLFN consists of interconnected neurons organized in layers, including input, hidden, and output layers, with the optimal number of nodes in the hidden layers (Hampson et al., 2001). In a Multi-Layer Feedforward Neural Network (MLFN), weights are connections between neurons, adjusted through iterations to efficiently map input data to desired output values, achieved via nonlinear error minimization (Lallahem et al., 2005). Equation (1) below is used to compute the desired output (Kushwaha et al., 2021).
3.4 Wireline log Analysis
Qualitative (i.e. assessment of rock and fluid types from log pattern) and Quantitative (estimation of water & hydrocarbon saturation and effective porosity) log analyses were conducted on McKee-2C, 3a, 4, 5a, 6, 7a, 8, 9, and 16a logs, alongside core data to study the formation. Various well-log data types, including resistivity, density, neutron, sonic, gamma-ray, and spontaneous potential logs, were analyzed using established equations and procedures from existing literature (Radwan et al., 2022; Sarhan, 2021b). The use of cut-off values aids in distinguishing the analyzed sequence into two distinct areas: the reservoir and non-reservoir zones and the property cut-off values used in this study were acquired by employing parameters from a comparable reservoir located within the same basin (Dong et al., 2018). The cut-off was as follows; 50 % for water saturation, 50 % for shale volume and 10 % for effective porosity. The lithology and mineral composition of the McKee sandstone were calculated using the M−N cross plot, where the M and N were calculated using the following equations.
4 Results
The structural architecture of the late Eocene McKee field along the Taranaki basin in New Zealand was analyzed by integrating geological and geophysical techniques.
4.1 Wireline log analysis
In the examined wireline logs, to differentiate between a sandstone section with an API gravity range of 0–75 and a shale section with a range of 75–150, a reference point of 75 API units was employed. The stratigraphic correlation cross-section of the McKee Formation based on the lithology (GR)-resistivity (Deep and shallow)-porosity (Density and Neutron) log is depicted in Fig. 3, and the wireline logs had varying net thicknesses and lateral extension. These thicknesses ranged from 85.44 m in McKee-2C to 122.41 m in McKee-4. The examined wireline logs' average effective porosity ranges from 15.62 % to 17.29 %, indicating generally fair to very good porosity quality. Interestingly, as Fig. 4 makes clear, the reservoir zone's clay content exhibits low values. The shale volume is 8.99 % in McKee-2C and 14.87 % in McKee 6A, according to the Larionov (1969) equation, which was used because the rocks in the basin are tertiary. The average water saturation is relatively low, ranging from 12.97 % in McKee-6A to 27.10 % in McKee-2C. This is deemed advantageous as it implies that hydrocarbons are expected to occupy most of the reservoir (Table 1). Furthermore, the average hydrocarbon saturation ranges from 72.9 % to 87.03 %.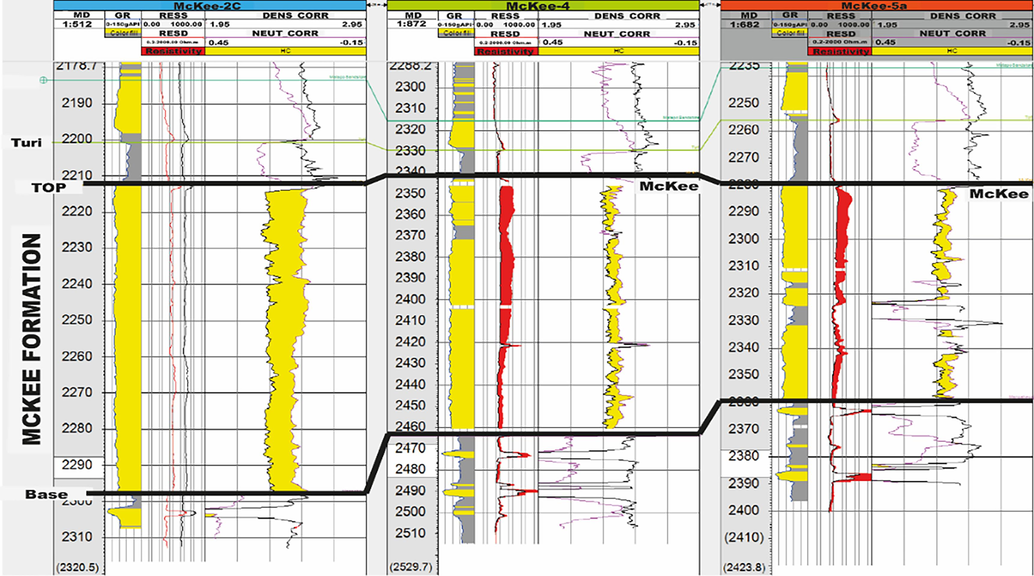
(A)Litho-stratigraphic Correlation chart of geological horizons along profile (McKee) based on Gamma Ray log.
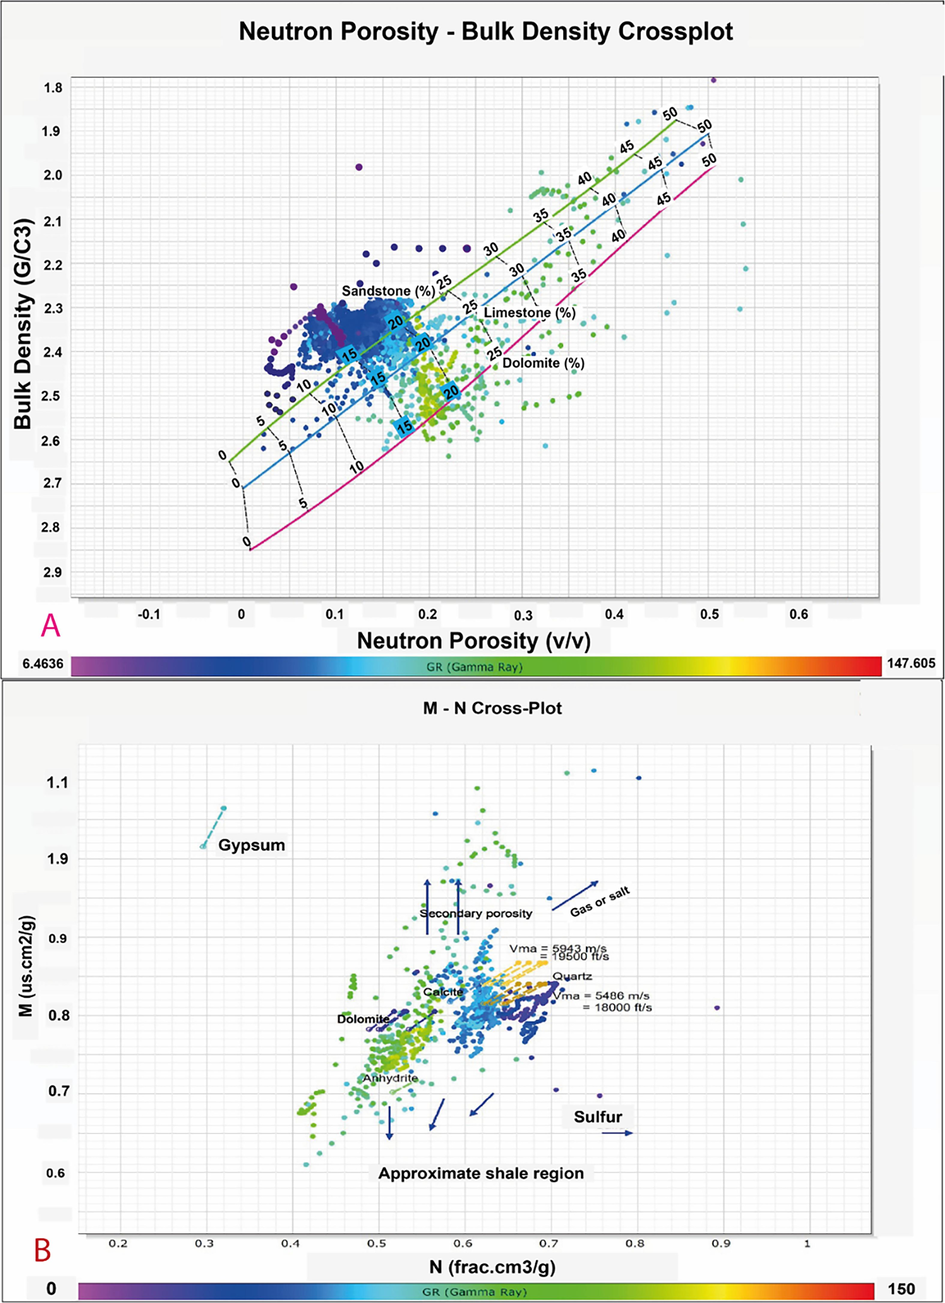
Cross-plot Analysis of (A)Neutron-porosity and Density log used for lithology identification and (B) Compressional sonic and density log used for lithology identification.
Well Name
Top (m)
Bottom (m)
Thickness (m)
(%)
(%)
(%)
(%)
McKee-2c
2212.50
2297.94
85.44
15.62
8.99
27.10
72.90
McKee-4
2341.59
2464.00
122.41
15.64
11.40
22.47
77.53
McKee-5a
2279.22
2359.00
79.78
15.89
12.02
17.74
82.26
McKee-6a
2161.92
2243.38
81.46
17.29
14.87
12.97
87.03
Average:
92.27
16.11
11.82
79.93
In general, the wireline logs analysis demonstrates favourable reservoir characteristics, such as high levels of hydrocarbon saturation and good porosity values. This emphasizes how promising the McKee Formation could be as a reservoir. With an estimated high hydrocarbon saturation level of roughly 70 %, the significant gap between resistivity curves at different depths points to the presence of mobile hydrocarbons within the pay zones.
4.1.1 Cross-plot analysis of various logs
Cross-plot analysis was carried out to determine the rock properties, lithological composition and attributes that better discriminate the McKee reservoir. Cross-plot of all neutron porosity and density log (Fig. 4A) was done and it showed a high presence of hydrocarbon sand, a wide range of porosity, with only a few points oriented towards the limestone line which makes it a good reservoir. To aid the interpretation, a corresponding plot was generated specifically for filtered data points characterized by the GR and calliper log (6 ≤ 8 in.). Some quantities of non-clastic materials were identified in certain analysed sand formations. The inclusion of limestone clay within these sand bodies leads the provided data towards the shale zone situated below the sandstone boundary. It reveals the coexistence of sandstones and carbonates, suggesting the simultaneous presence of intergranular and secondary porosities in equal proportions. These findings were further assessed in comparison to the tri-porosity M−N technique, which proved effective in studying lithology. Additionally, the gas sand or gas effect is readily apparent in neutron-density cross-plots.
The M and N cross-plot of the McKee reservoir (Fig. 4B) shows the predominant mineral composition where the arrows show the effect of the gas, salt, sulphur, secondary porosity and clay, most of the data points on the plot are typically located within the calcite, anhydrite, Quartz, and dolomite sections, this demonstrates the reservoir heterogeneous nature (D. Martyushev et al., 2023). The presence of gas was also evident in the northwest direction of the data points. Based on this observation, the dominant lithology within the Eocene reservoir under investigation is Sandstone, there are GR points that lean towards calcite (limestone), while also containing occasional shale intercalations across all wireline logs. The presence of secondary porosity can be observed in all wireline logs through a small number of data points, which can be attributed to the dissolution of quartz (Dong et al., 2018; Jumat et al., 2018). Apart from sandstones and carbonates, some data points demonstrate a downward trend, suggesting the influence of shale. The results from the M−N cross plot align with those from the NPHI vs. RHOB cross plots.
4.2 Seismic structural interpretation
By analysing bedding planes and tying the seismic, and logging data, the horizon of the McKee Formation was ascertained (Fig. 2). As shown in Fig. 5A, the red-coloured peak represents an increase in impedance. This horizon was extended to all the nearby seismic lines and was oriented from southwest to northeast. The seismic data quality made it difficult to image faults. As a result, fault polygons were excluded from the input data due to the lack of discernible faults intersecting surfaces that exhibit significant displacement. Chaos and Iso-frequency seismic attributes volume extracted at the McKee Formation top (Fig. 5B, C) illustrates the areas of visible continuity/low disturbance and areas of discontinuity/highly chaotic which shows the framework complexity of the Field’s geological structures (Baur, 2012; Higgs et al., 2012).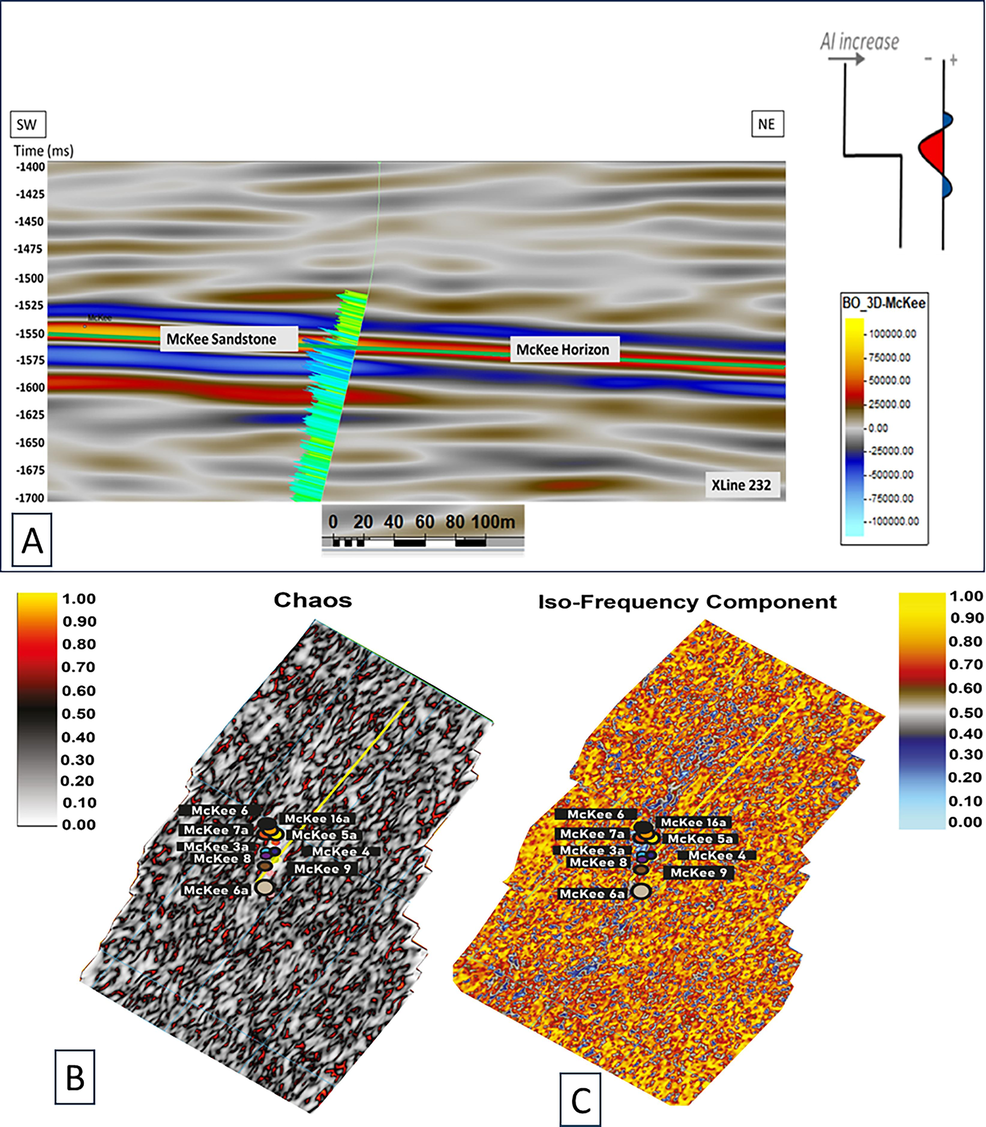
(A) Vertical transect (SW-NE) of the Seismic amplitude expression section with interpretations of the Horizon mapping at Xline 232, showing the location of McKee5A penetrating the main reservoir. (B)Chaos and (C)Iso-frequency seismic attributes volume extracted at the top of the McKee Formation showing the areas of high and low continuity and facies changes of the seismic data.
Contour maps (Fig. 6) were generated in Two Way Time (TWT) and depth. Surfaces in time were converted to depth using an average velocity model derived from check shots velocity data and depth changes in wireline logs. Darker colours indicate higher time values and deeper depths, while lighter shades represent lower time values and shallower depths. Depth surfaces of the McKee Formation are presented in Fig. 6a. TWT maps show values ranging from 1500 to 1580 ms at the top, while depth maps (Fig. 6b) range from 1960 to 2100 m. Contour lines within the depth range of 2000 to 2150 m are closer together, suggesting a steep slope and potentially indicating an abrupt discontinuity.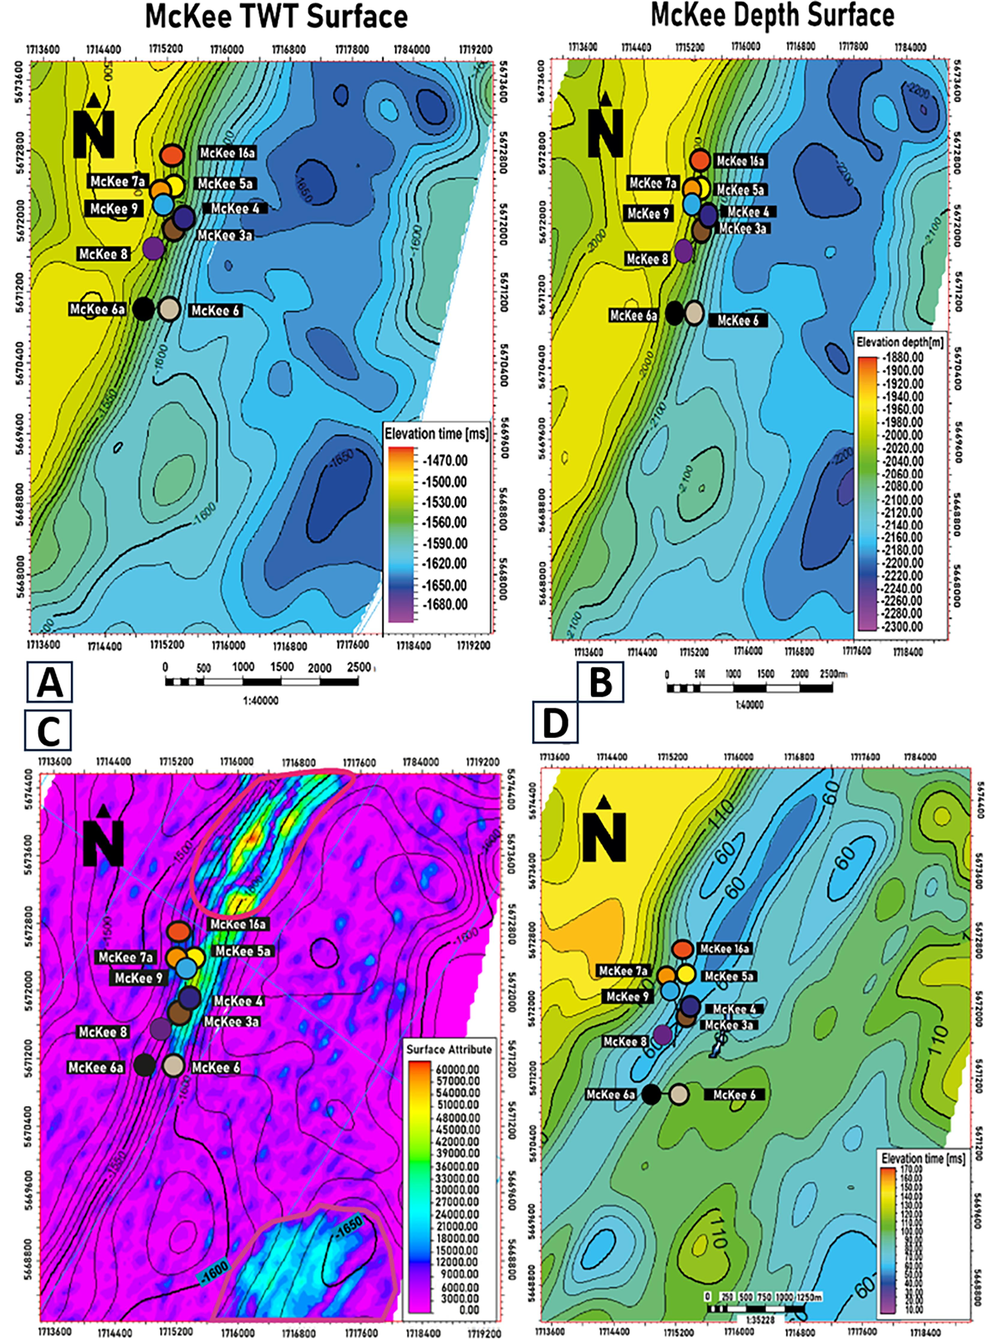
Depth map (A) and Two-way Time structure map (B) of the top McKee horizon. (C) RMS Amplitude Map (D)Isochron Contour map of McKee Formation sediment depicting significant variations in thickness characteristics.
This investigation utilizes isochron and RMS seismic attribute maps to understand the McKee Field comprehensively. RMS amplitude attributes assist in identifying potential hydrocarbon zones, with high amplitudes highlighted in red in Fig. 6C, indicating areas of interest, particularly in the northern, southeastern, and some northwest regions. Isochron maps (Fig. 6D) were generated by subtracting the top horizon from the bottom horizon of the McKee Formation, revealing a thickness ranging from 10 to 170 m, with pronounced thickening towards the east and southeast, aligning with sedimentary deposition patterns. This thickness pattern aligns with the progressive thickening from the shallow marine inner-shelf to the coastal deposits, moving towards the basin. Depth and TWT increase towards the crest, southeastern (structural high or anticline), and eastern directions, indicating potential hydrocarbon closures. These maps guide drilling location selection by revealing subsurface structures critical for identifying potential hydrocarbon migrations and accumulations.
4.3 Seismic inversion
The Low-frequency models created exhibit matching acoustic impedance (Fig. 7A) with compression sonic log overlays from the McKee wireline log, showing a range of high to low acoustic impedance values in the study area. Interpolation of acoustic impedance trends in wireline logs was done using the distance inverse square method. The seismic inversion results (Fig. 7B) illustrate seismic reservoir tops and contrast in acoustic impedance. The model's fit with the McKee 4 wireline log is compromised due to poor tie caused by high noise levels in the seismic data. Impedance volumes represent subsurface layer properties, with variations used to infer saturation and porosity differences in reservoirs. High-impedance regions typically correlate with low porosity due to rising acoustic impedance alongside velocity and density. Log correlation of the late Eocene McKee Formation's uppermost part determined interpreted reservoir horizons. The impedance model effectively delineates reservoir and non-reservoir facies, with the reservoir exhibiting moderate to high impedance values (8250 to 9200) (g/cc) *(m/s). This can be attributed to rock cementation causing densification or compaction, aligning with carbonate rock presence in the reservoir as indicated by mineralogy cross plots (Fig. 5) (Dong et al., 2018; Nicol et al., 2022). Acoustic impedance values may not fully represent the subsurface, as indicated by colour deviations in wireline log sections (Fig. 7B), particularly marked with black circles. Mudstone clasts rock abundance at certain depths could impact p-wave log readings. Fig. 7C depicts an Inverted Acoustic Impedance time slice correlating with the top of McKee reservoirs, showing reservoir distribution maps and well locations. These attributes aid in identifying potential hydrocarbon resource locations based on impedance value variations, primarily within the range of (8468.84 to 9367.85) (g/cc) *(m/s) for McKee reservoir sand.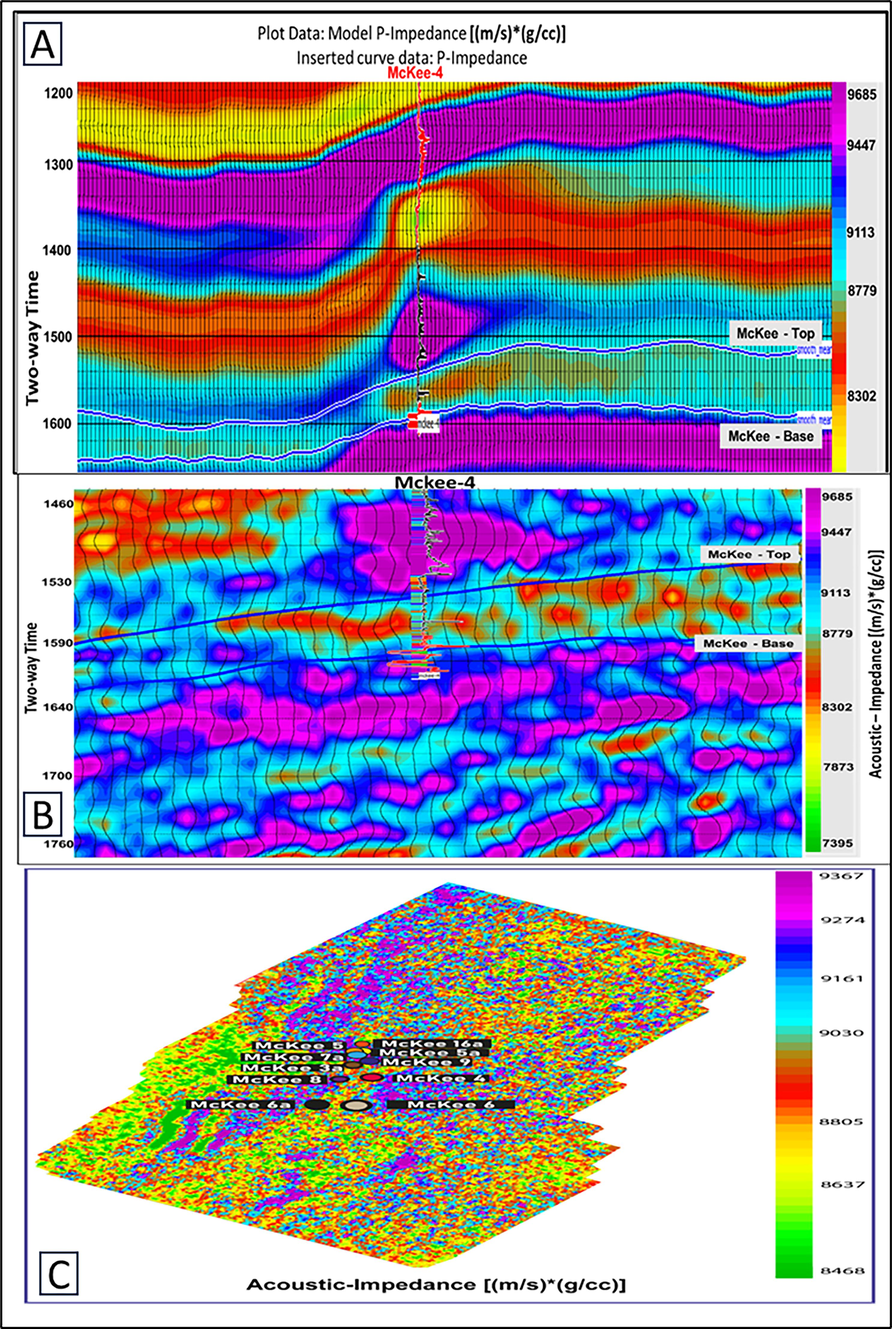
(A) Initial background P-impedance model at inline 117 overlain by P-wave velocity log from McKee 4 location which shows matching characteristics (B) Using seismic post-stack model base inversion, inverted impedance contrast is observed that was mapped laterally (C)Acoustic Impedance distribution map at McKee Formation slice.
Upon examining the results of the Acoustic Impedance map (Fig. 7C), it was observed that wells are located between 8468 (g/cc) *(m/s) and 9915 (g/cc) *(m/s) where the McKee 5, 5a, 7a, 9 is located on high sections of high Impedance the other wireline log (McKee 2c, 3a, 4, 6, 6a and 16a) wireline logs are in sections of low impedance. Certain areas of the reservoir time slice that correspond to the identified prospects have distinctively low acoustic impedance, which indicates high porosity and fluid contents. Seismic amplitudes in this range are often discontinuous due to Formation complexity, affecting seismic data acquisition.
Reducing the uncertainty of important subsurface parameters that have a significant impact on-field performance is one of the benefits of this current study. Geophysical data from seismic inversion improves reservoir characterization, identifying regions with low impedance values for optimal wireline log placement. This leads to improved well deliverability, reduced project costs, and increased economic feasibility. High impedance values in certain sections may be due to missing wireline log data in corresponding seismic areas.
4.4 Porosity prediction from seismic data
MLFN was utilized in a multi-attribute analysis to identify porosity predictors. The model was trained using porosity data from three wireline logs correlated with five seismic attributes. Porosity was computed for various seismic attribute combinations, with the combination yielding the lowest error considered optimal (Table 2). The trained model with five seismic attributes achieved a correlation coefficient of 0.855 for porosity prediction (Fig. 8A). The study investigated porosity prediction accuracy in the McKee reservoir. It found that errors averaged 4.7 %, with a maximum of 6.65 % and a minimum of 1.3 %. Despite resolution limitations, there was a strong correlation in the McKee 4 wireline log. Predicted porosity values tended to be underestimated by 3 to 4 units compared to porosity logs (Fig. 8A), ranging from 15 to 22.8 % across the cross-section (Fig. 8B). Porosity distribution was influenced by depositional and diagenetic mechanisms, with diagenesis potentially reducing initial porosity. Porosity values correlated with low gamma ray readings, indicating reservoir presence. High porosity values in the seismic section suggested the presence of coal, known to be significant in the McKee reservoir (Webster et al., 2011). Assessing porosity becomes challenging in reservoir rocks when coal measurements are present or when the reservoir rock exhibits various types of porosity (Ashraf et al., 2022). The analysis of predicted porosity from neighbouring wells like McKee4 and 5a suggests a fairly accurate capture of wireline log porosity responses. However, uncertainties are present in the prediction due to the discontinuous nature of seismic data and the limited number of wells in the study area.
Seismic Attributes
Training Error
Validation Error
Integrated Absolute Amplitude
6.981534
8.992211
(Inverted Seismic) **2
6.639899
8.993153
1/(curvature_times)
6.3456332
9.229737
(Convolve_prewitt) **2
6.127339
9.660459
Log(sythentic_model)
5.77043
7.707490
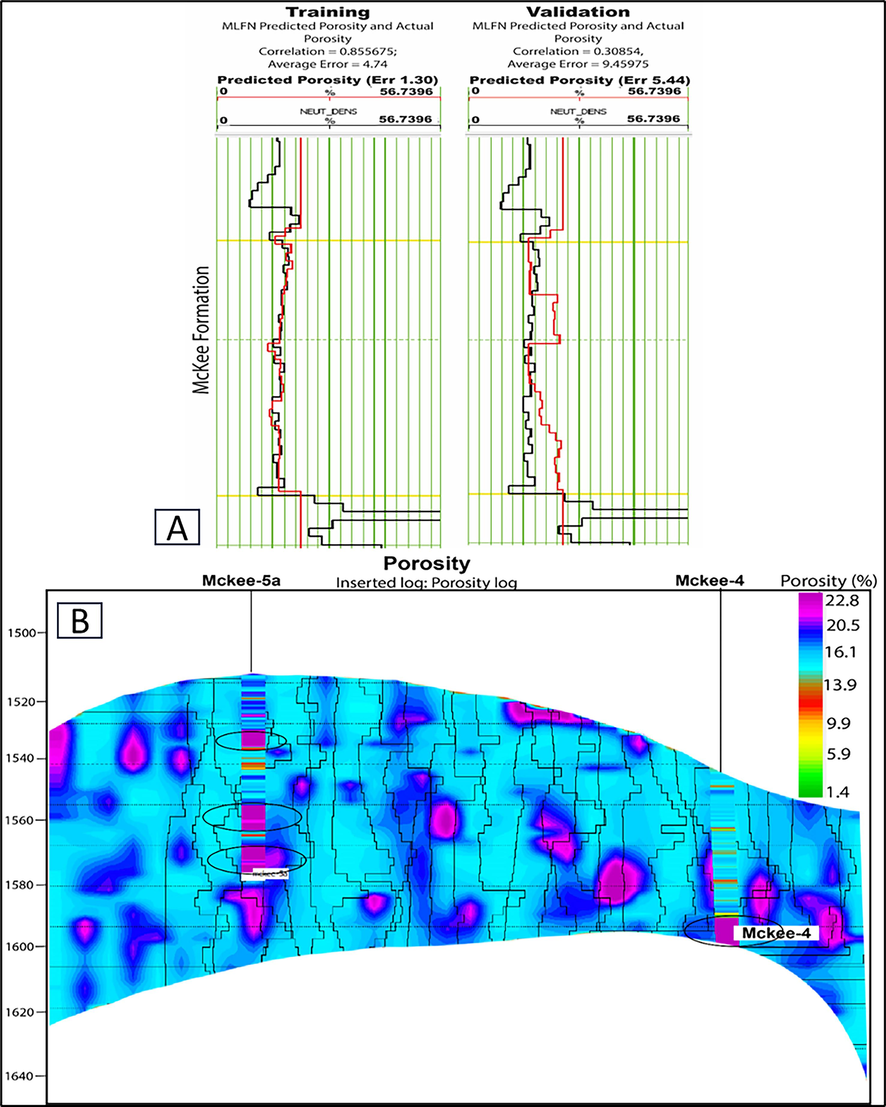
(A) Training and validation errors analysis of the predicted Porosity data of the studied field, showing a training error of 1.30 and validation error of 5.44 at the McKee 4 wireline log (B) MLFN predicted porosity distribution within a McKee Formation time window of the seismic section, indicating the McKee Formation.
5 Discussion
5.1 Structural interpretation and depositional evolution of the reservoir
Structure Interpretation reveals that this Field has undergone a history characterized by tectonic complexity (Fig. 7B, C) caused by over-thrusting as also discussed by (Jennings, 2003a). Identifying faults was difficult due to significant discontinuities, low-angle displacement, and limited resolution. Little evidence suggests syn-depositional faulting in the Cape Egmont zones during the late Miocene to early Pliocene, possibly due to reduced activity along faults associated with dextral transforming, which could be related to a southwestern-plunging plate boundary in Northland (Knox, 1982; O’Neill et al., 2023).
Its deposition was influenced by a noteworthy structural factor, due to the diversity in seismic patterns, changes in lateral facies and thickness over short distances exhibiting a notable rise towards the crest of the research region, where the rate of subsidence experiences an increase as seen in the isochron map (Fig. 8B), which primarily exhibit vertically stacked transgressive patterns with varying geometries (Higgs and King, 2018; Lever, 2007).
Traditional mapping techniques for such structural traps have significantly aided in the successful drilling of wireline logs (Abdel-Fattah et al., 2020). McKee Field is situated in the northern part of the Taranaki basin, southeast of Waitara. The area's structural pattern is governed by highs and lows oriented towards the northeast and east, with most structural highs located in the northeast regions and most structural lows in the east, as depicted in the time and depth contour maps (Fig. 8B). Given that the structural high (Fig. 8C) has bright spots, the prospects' geological feasible amplitude anomalies are deemed viable. These prospects were thick with significantly thick and largely (Fig. 8D).
5.2 Petrophysical characterization and seismic inversion to delineate the reservoir properties distribution.
The petrophysical analysis of the McKee Formation indicates its hydrocarbon potential through wireline log studies employing predetermined calculations, cross-plots, and charts. The dia-porosity cross-plot is effective in detecting lithological variations, revealing shoreline sandstones with interbedded mudstone and coal (Fig. 4). The reservoir in the research region is characterized by calcareous quartz siltstones/sandstones, containing fine-grained sand, limestone, and dolomite. It has an average net thickness of approximately 106.01 m, effective porosity of about 17.75 %, low average shale values of 16.75 m, and hydrocarbon saturation of around 81.80 % (Table 1). These promising petrophysical factors suggest favourable conditions for hydrocarbon accumulation and preservation (Rider, 1986).
Post-stack seismic inversion and MFLN techniques were also used to extract the petrophysical properties of the rocks' subsurface and to locate individual reservoir zones. The seismic inversion reveals differences in acoustic impedance (Fig. 7B) spanning a broad range of values, which stem from the distinct depositional, diagenetic, and petrophysical attributes of compacted sandstones within the area as also discussed by (Dong et al., 2018), which can serve as an indicator revealing fluctuations in the level of compactness exhibited by these sandstones. The Acoustic Impedance map (Fig. 7C) of the McKee horizon reveals lateral variations in impedance near and away from well locations, suggesting potential hydrocarbon-bearing sands in areas with very low impedance values. High acoustic impedance indicates denser sandstone facies crucial for reservoir characterization. Distribution maps of acoustic impedance identify exploration-worthy regions with low impedance. Porosity predictions using conventional seismic attributes demonstrate lateral variation within the study area (Fig. 8B). This prediction can aid petroleum engineers in having a better forecast of where to drill.
The McKee sandstone's high reservoir quality is due to secondary dissolution pores connecting to the main intergranular network, increasing porosity. However, extensive diagenetic changes like pressure solution of quartz, clay mineral development, grain fracturing from overthrusting, and carbonate cementation decrease reservoir quality along with compaction. These effects are localized and do not significantly impact the overall reservoir quality of the McKee Formation. (Dong et al., 2018; Hopcroft, 2009).
The results obtained also agree with the reservoir summary reports about it being a locally moderate reservoir (Dong et al., 2018; Jennings, 2003b; Smale and Morton, 1987). However, the generated porosity sections offer useful perceptions of the standard of the reservoir within the McKee Formation sandstones in the investigated area. These results can be used as an extra variable (by co-kriging) in geostatistical methods to reduce uncertainty in tight sandstone static reservoir models.
6 Conclusion
The McKee Formation underwent an integrated characterization to evaluate the viability of unexplored areas as an onshore Taranaki Basin-producing reservoir. Based on the results the following was deduced.
This assessment considered the petrophysical analysis of the McKee sandstone as a reservoir. Cross-plots, in conjunction with wireline log analysis, indicate a variation in lithology in the available wells, ranging from sandstone interbedded with shales and carbonates which shows the heterogeneity of the reservoir. Hydrocarbon zones with thicknesses of 85.44 to 122.41 m minimal shale content, low water saturation, and high porosity have been confirmed by petrophysical analyses. Based on the petrophysical data obtained, the chosen reservoir zones exhibit a moderate to good porosity ranging with a relatively low presence of shale, and the average hydrocarbon saturation falls within the low to high-range indicating good mobility. The presence of clay minerals as seen in the reservoir may cause a reduction in the reservoir quality.
3D seismic data reveals that the McKee was mostly deposited in the structural highs, and sweet spots were identified for exploring hydrocarbons using root-mean-square and isochron contour maps. The potential of stratigraphic plays that are exploitable hydrocarbon prospect areas based on the efficient reservoir qualities in terms of high RMS amplitudes and good sand thickness, as interpreted from seismic attribute transforms of the field. Numerous low-displacement stratigraphic-scale faults may serve as conduits for the migration of hydrocarbons.
Post-stack inversion techniques led to a more refined understanding of reservoir acoustic impedance variation in the studied area. The reservoir shows the presence of moderate-to-high acoustic impedance value which can be attributed to the presence of carbonate rocks in the reservoir as seen in Fig. 6. The presence of hydrocarbons in delineated reservoirs was evident through amplitude anomalies and relatively low impedance value observed on the McKee Horizons slice, a conclusion further supported by inversion results that refined reservoir characterization.
The porosity was predicted thanks to the relatively low training and validation error values. It suggests that reservoir porosity can be characterised through neural network analysis using seismic data, which contributes to a better comprehension of the reservoir's lateral variation in attributes distant from the wireline logs. The predicted porosity cube shows the presence of low to high porosity value, coals were deduced to have been deposited within the reservoir owing to the high porosity value.
The incorporation of RMS amplitude, acoustic impedance, and lateral prediction of porosity attributes for delineated sands. The reservoir parameters derived and calibrated to well control offer enhanced geological insights into the distribution and stratigraphic architecture of the McKee horizon. This study underscores the re-evaluation of the hydrocarbon-bearing reservoir for commercial oil production and accumulation. Additionally, it identifies a substantial shale bed both below and above the oil-bearing reservoirs, which could serve as a source or seal rock.
It's crucial to remember that there is inherent uncertainty in the study's findings, especially given the poor quality of the seismic data and the small number of wells in the study area (Knox, 1982).
CRediT authorship contribution statement
John Oluwadamilola Olutoki: Conceptualization, Data curation, Formal analysis, Methodology. Numair Ahmed Siddiqui: Funding acquisition, Supervision, Writing – review & editing. AKM Eahsanul Haque: Data curation, Formal analysis, Supervision, Writing – review & editing. Oluwaseun Daniel Akinyemi: Software, Writing – review & editing. Hassan Salisu Mohammed: Visualization, Writing – review & editing. Yasir Bashir: Writing – review & editing. Mohamed A.K. El-Ghali: Supervision, Writing – review & editing.
Acknowledgement
This work was supported by Universiti Teknologi PETRONAS and the Institute of Hydrocarbon Recovery (IHR) with GR&T Grant, YUTP 015LCO-363 Grant.
Declaration of competing interest
The authors declare that they have no known competing financial interests or personal relationships that could have appeared to influence the work reported in this paper.
References
- Integrated seismic attributes and stochastic inversion for reservoir characterization: Insights from Wadi field (NE Abu-Gharadig Basin, Egypt) J. Afr. Earth Sc.. 2020;161:103661
- [CrossRef] [Google Scholar]
- Structural and petrophysical characteristics of the Turonian “AR/G″ reservoirs in heba field (Western Desert, Egypt): Integrated approach for hydrocarbon exploration and development. J. Afr. Earth Sc.. 2023;207:105072
- [CrossRef] [Google Scholar]
- Machine learning application for prediction of sonic wave transit time - A case of Niger Delta basin. Results Eng.. 2023;20:101528
- [CrossRef] [Google Scholar]
- Ashraf, U., Anees, A., Shi, W., Wang, R., Ali, M., Jiang, R., Vo Thanh, H., Iqbal, I., Zhang, X., Zhang, H., 2022. Estimation of porosity and facies distribution through seismic inversion in an unconventional tight sandstone reservoir of Hangjinqi area, Ordos basin . Frontiers in Earth Science.
- Baur, J.R., 2012. Regional seismic attribute analysis and tectono-stratigraphy of offshore south-western Taranaki Basin, New Zealand.
- Integrated reservoir characterization study of the mckee formation. Onshore Taranaki Basin, New Zealand. 2018;1–18
- [CrossRef] [Google Scholar]
- Ghisetti, F., 2014. Structural Analysis of the Mc Kee Overthrust in the Kewa Prospect -.
- Use of multiattribute transforms to predict log properties from seismic data. Geophysics. 2001;66:220-236.
- [CrossRef] [Google Scholar]
- Integrated wireline log and seismic attribute analysis for the reservoir evaluation: A case study of the Mount Messenger Formation in Kaimiro Field, Taranaki Basin, New Zealand. J. Nat. Gas Sci. Eng.. 2022;99:104452
- [CrossRef] [Google Scholar]
- Sandstone provenance and sediment dispersal in a complex tectonic setting: Taranaki Basin, New Zealand. Sediment Geol.. 2018;372:112-139.
- [CrossRef] [Google Scholar]
- Sequence stratigraphy and controls on reservoir sandstone distribution in an Eocene marginal marine-coastal plain fairway, Taranaki Basin, New Zealand. Mar. Pet. Geol.. 2012;32:110-137.
- [CrossRef] [Google Scholar]
- Hopcroft, B.S., 2009. Lithology and provenance of late Eocene-Oligocene sediments in eastern Taranaki Basin margin and implications for paleogeography.
- Jennings, R., 2003a. PR 2822 Quantitative Interpretation of the McKee Field Kewa prospect.
- Jennings, R., 2003b. PR 2822 Quantitative Interpretation of the McKee Field Kewa prospect.
- Integrated reservoir characterization of the Paleocene Farewell Formation, Taranaki Basin, New Zealand, using petrophysical and petrographical analyses. J. Pet. Explor. Prod. Technol.. 2018;8:685-701.
- [CrossRef] [Google Scholar]
- King, P., Bland, K., Funnell, R., Archer, R., Lever, L., 2009. Opportunities for underground geological storage of CO2 in New Zealand-Report CCS-08/5-Onshore Taranaki Basin overview. GNS Science Report 58.
- Taranaki basin, structural style and tectonic setting. N. Z. J. Geol. Geophys.. 1982;25:125-140.
- [CrossRef] [Google Scholar]
- Estimation of subsurface rock properties from seismic inversion and geo-statistical methods over F3-block, Netherland. Explor. Geophys.. 2021;52:258-272.
- [CrossRef] [Google Scholar]
- On the use of neural networks to evaluate groundwater levels in fractured media. J. Hydrol. (amst). 2005;307:92-111.
- [CrossRef] [Google Scholar]
- Review of unconformities in the late Eocene to early Miocene successions of the South Island, New Zealand: Ages, correlations, and causes. New Zealand J. Geol. Geophys. N Z J. GEOL. GEOPHYS.. 2007;50:245-261.
- [CrossRef] [Google Scholar]
- An efficient and comprehensive poroelastic analysis of hydrocarbon systems using multiple data sets through laboratory tests and geophysical logs: a case study in an iranian hydrocarbon reservoir. Carbonates Evaporites. 2023;38
- [CrossRef] [Google Scholar]
- Evaluation of facies heterogeneity in reef carbonate reservoirs: A case study from the oil field, Perm Krai Central-Eastern Russia. Geoenergy Sci. Eng.. 2023;227:211814
- [CrossRef] [Google Scholar]
- Martyushev, D., Ponomareva, I., Chukhlov, A., Davoodi, S., Osovetsky, B., Kazymov, K., Yang, Y., 2023. Study of void space structure and its influence on carbonate reservoir properties: X-ray microtomography, electron microscopy, and well testing 106192. Doi: 10.1016/j.marpetgeo.2023.106192.
- Nicol, A., Dempsey, D., Yates, E., Higgs Karen, Beggs, M., Adam, L., 2022. Underground Hydrogen Storage in the Taranaki region, New Zealand.
- Tectonostratigraphic controls on pore fluid pressure distribution across the Taranaki Basin, New Zealand. Basin Res.. 2023;35:1128-1153.
- [Google Scholar]
- Seismic interpretation, reservoir characterization, gas origin and entrapment of the Miocene-Pliocene Mangaa C sandstone, Karewa Gas Field, North Taranaki Basin New Zealand. Mar. Pet. Geol.. 2022;135:105420
- [CrossRef] [Google Scholar]
- Reservoir quality prediction of gas-bearing carbonate sediments in the Qadirpur field: Insights from advanced machine learning approaches of SOM and cluster analysis. Minerals. 2022;13:29.
- [Google Scholar]
- Rider, M.H., 1986. The geological interpretation of well logs.
- Sequence stratigraphy and petrophysical investigation of fluvial sediments: a case study Nubia Sandstone, Ras Budran Field, Gulf of Suez Egypt. J. Iberian Geol.. 2023;49:365-385.
- [CrossRef] [Google Scholar]
- Geophysical assessment and hydrocarbon potential of the cenomanian bahariya reservoir in the abu gharadig field, western desert Egypt. J. Pet. Explor. Prod. Technol.. 2021;11:3963-3993.
- [CrossRef] [Google Scholar]
- Assessing hydrocarbon prospects in Abu Madi formation using well logging data in El-Qara field, Nile Delta Basin Egypt. J. Pet. Explor. Prod. Technol.. 2021;11:2539-2559.
- [CrossRef] [Google Scholar]
- Geophysical assessment for the oil potentiality of the Abu Roash “G” reservoir in West Beni Suef Basin, Western Desert Egypt. J. African Earth Sci.. 2023;199:104845
- [CrossRef] [Google Scholar]
- Heavy mineral suites of core samples from the McKee Formation (Eocene—lower Oligocene), Taranaki: implications for provenance and diagenesis. N. Z. J. Geol. Geophys.. 1987;30:299-306.
- [Google Scholar]
- Overpressures in the Taranaki Basin: Distribution, causes, and implications for exploration. Am. Assoc. Pet. Geol. Bull.. 2011;95:339-370.
- [CrossRef] [Google Scholar]


