

Translate this page into:
Inspection of reinforced concrete structures using ground penetrating radar: Experimental approach
⁎Corresponding author. malmalki@kacst.edu.sa (Majed A. Almalki),
-
Received: ,
Accepted: ,
This article was originally published by Elsevier and was migrated to Scientific Scholar after the change of Publisher.
Abstract
This study aims to the practical detection of sub-meter scale voids located inside reinforced concrete structures with different diameters and depths using different frequency antennas of 800, 1000, 1200, and 1600 MHz. The experiment was performed on two concrete blocks with medium-sized voids between 70 and 100 mm diameter, and small-sized voids between 10 and 25 mm diameter. A GPR survey was conducted by dividing each block into two grids of profiles with 50- and 100-mm profile spacing. Then, GPR data was collected along both the horizontal and vertical directions of each block with multi-frequency antennas. The gathered data was processed in 2D and 3D to detect the exact location, dimension, and brightness of these voids. The results showed that GPR has the potential to be quite effective in automating the identification and location of embedded voids within concrete blocks. The accuracy with which the system was able to identify void locations depended mainly on the frequency of the antenna used and the diameter of the void, while the depth of penetration was inversely proportional to the frequency of the used antenna, with estimated depths ranging from 25 cm (using a 1600 MHz antenna) to 1.5 m (using 800 MHz antenna). Moreover, a GPR survey was conducted to evaluate two sites inside residential buildings before and after the rehabilitation process. The radar scan exhibited a notable proficiency in identifying the positions of rebar sites, whether they were situated at a single level or two levels, inside certain areas of construction. The study revealed the ability of GPR to identify the depth of the reinforcing steel within the cement material, particularly in areas where the soil has experienced subsidence.
Keywords
Small-medium-scale void-size
Reinforced concrete structures
GPR

1 Introduction
Ground-penetrating radar (GPR) is a well-established characterization and analysis tool in non-destructive test applications (Brian et al., 2018). GPR is now a widely accepted field of scanning technology for surveying and imaging subsurface conditions (Annan, 1992, Tzanis, 2017, Yang et al., 2020). GPR is an effective non-destructive testing method that is characterized by its rapidity, continuity, high detection accuracy, and ability to overcome the shortcomings of the core sampling and impact echo methods. The unique advantage of GPR causes concern for many scholars. Recently, GPR has been used in a wide range of civil engineering and geotechnical applications (Li et al., 2003; Rao et al., 2007; Wu and Chang, 2007; Rister and Graves, 2008; Alhasanat et al., 2013, Tian et al., 2018), and in reinforced concrete tests applications, due to its capabilities, benefits and fast performance in the non-destructive exploration of all defects that may be found inside the cement layers.
GPR can also be used to conduct a real-time concrete inspection survey using radar to locate rebar, pipes, tension bars, dowels, and plastic and fiber-optic conduits (Bungey and Millard, 1993; Muldoon et al., 2007; Bala et al., 2015). There are few studies on concrete inspection surveys to detect voids/cavities within and under concrete slabs (Watanabe et al., 2004; Pollock et al., 2008; Roger et al., 2011; Abdul Razak et al., 2015, Nobes, 2017). Radar surveys can be conducted on airport runways, tunnels, abutments, dams, pavements, and garages (Millard et al., 2002; Loizos et al., 2007; Evans, 2009; Lee, 2011). Asphalt roads and bridges can also be scanned (Parry and Davis, 1983; Maser and Scullion, 1992; Hugenschmidt and Mastrangelo, 2006; Loken, 2007; Hoegh et al., 2015). The concrete slabs can be inspected for issues including relative thickness, deterioration, and structural problems (Roddis et al., 1992; Loizos and Plati, 2007)
The present study introduces some experimental efforts for civil engineering purposes to identify the exact location of the internal voids of various sizes and depths inside concrete structures and the evaluation of residential buildings.
2 Experimental setup
Two reinforced concrete blocks were prepared to check the ability of the GPR technique to detect the location and extension of the internal voids. Two blocks of concrete were prepared and then voids of the required sizes were made using a drilling machine (see Fig. 1). Block No.1 includes two internal voids: the first one had a diameter of 70 mm and extended horizontally inside the block for a distance of 1000 mm (along both sides of the block). It was located at a vertical depth of 280 mm from the top surface of the block (Fig. 1a) and a lateral distance of 380 mm from the front. The second void was designed with diameter of 70 mm and extended horizontally inside the block for 250 mm. This void was located at a depth of 200 mm from the top of the block and a lateral distance of 750 mm from the front. Block No.2 had two voids with different specifications: the first void had a diameter of 100 mm extended horizontally inside the block for 250 mm (Fig. 1b), and was located at a vertical depth of 220 mm from the top of the block and a lateral distance of 700 mm from the southern end of the block (Fig. 2). The 2nd void was 700 mm in diameter, 600 mm deep, and 180 mm lateral from the block's southern edge. It was placed at a distance of 1000 mm from the top of the block. Both blocks were surveyed according to the size of the internal voids: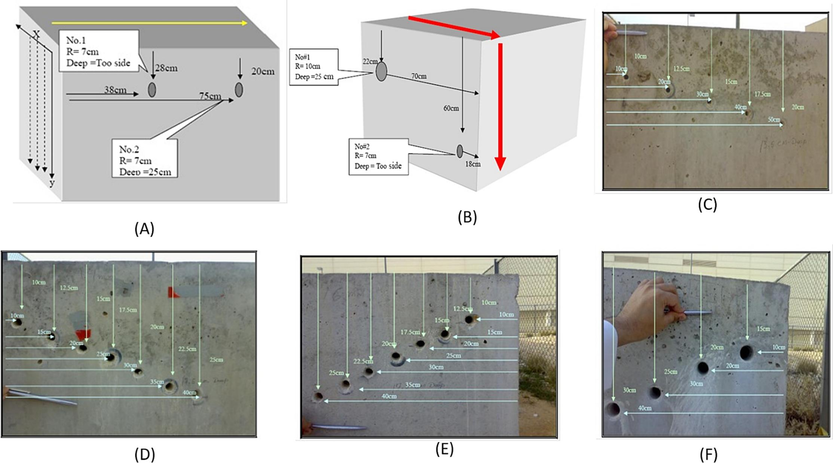
A) locations of voids inside blockNo.1, b) Sketch diagram for block No.2 shows the voids and survey lines, c) Locations of voids with 10 mm inside the concrete block, d) Locations of voids with 14 mm inside the concrete block, e) Locations of voids with 16 mm inside the concrete block, f) Locations of voids with 25 mm inside the concrete block.
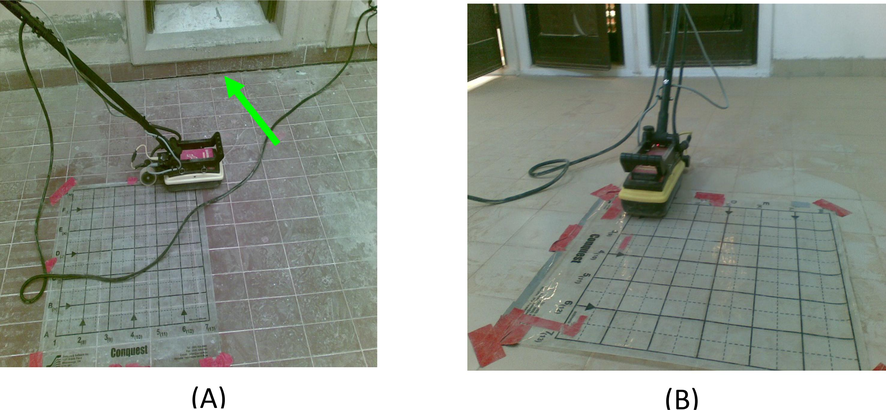
Shows the radar scan of the conquest instrument, (a) at site no. 1, and the arrow indicates the shape of the building's subsidence, (b) at site no. 2 and shows that there is no subsidence, as it does not rest on an earthen floor, but is the ceiling of another lower room.
2.1 Small-scale void-size (10, 14, 16, and 25 mm)
Several voids of various sizes and dimensions were prepared within separate concrete blocks and these blocks were then scanned with different frequency antennas to estimate the accuracy level. The specifications of these voids are: 1) five voids had diameters of 10 mm and were distributed (Fig. 1c) at a lateral depth of 135 mm inside the concrete block, 2) seven voids had a diameter of 14 mm and were located at a lateral depth of 175 mm (Fig. 1d), 3) seven voids with a diameter of 16 mm and a lateral depth of 175 mm inside the concrete block (Fig. 1e), and 4) four voids with a diameter of 25 mm and a lateral depth of 400 mm (Fig. 1f). These voids were surveyed using 800, 1200, 1500, and 1600 MHz of radar antenna frequencies.
2.2 Medium-scale void-size (70 mm and 100 mm)
The uppermost surface of block No.1 was divided into two grids of radar profiling in an x-axis and y-axis as follows; the first grid consisted of 14 profiles with 100 mm spacing, while the second grid was composed of 28 profiles with a 50 mm interval. This block was scanned using sequences of antenna with frequencies of 800 , 1000 , 1200 , and 1600 MHz with the optimum parameters along both grids. Block No.2, was surveyed along a grid of horizontal and vertical profiles using 800, 1200, and 1600 MHz antenna frequencies.
2.3 Evaluation of residential building
GPR survey has been applied at two sites inside building located within the residential district of King Abdulaziz City for Science and Technology. It was noted that there were voids inside the reinforced concrete, as well as gaps between the concrete and the underlying ground surface as a result of soil subsidence, one of the indicators of which was the presence of fractures and cracks in the observable surface of the concrete where the building was constructed on fill materials in an ancient wadi.
Conquest GPR instrument with the frequency of 1000 Hz was used to evaluate whether those sites present voids or not and to check their location before and after the rehabilitation process. Fieldwork procedures depend mainly on identifying suitable sites for taking readings of high importance, which are often near areas of cracks or subsidence in concrete blocks. To start conducting radar surveys, two sites were identified, for which surveys are taken before and after the rehabilitation process, with specific geometric dimensions and in the form of a network of raster lines, one of which has an area of 120 cm × 120 cm, while the other has an area of 60 cm × 60 cm, with line- spacing equal to 5 cm so that we get a total of 26 scan lines in both directions x and y (Fig. 1) and these sites are as follows;
Site No. (1) is situated in the middle of the building (Fig. 2a), where the surface was affected by the soil subsidence. Therefore, three radar surveys were taken as follows; the first scan with dimensions of 120 cm × 120 cm aims to know the change in the depth of steel; the second survey with a grid of 60 × 60 cm to identify the voids before rehabilitating the building, while the third survey of 60 × 60 cm dimensions to examine the voids after the rehabilitation process.
Site No. (2) lies in a room corner, the floor of which represents the roof of a neighboring building (Fig. 2b) and a single scan was made with dimensions of 60 × 60 cm on a point that may have a void in it.
3 Data processing and analysis
GPR-data processing aims to find obvious reflections from the sub-surface targets in the original data, where the processing steps represent the improvement of some properties and benefits that are present in the radar record and that give a good indicator for some sub-surface characteristics (Annan, 1992; Fisher et al., 1992). This in turn improves the true signal and reduces the noise accompanying the signal while at the same time will keep all the radar record elements from losing. The interpretation of data aims also to join the radar section inputs with the actual structures of the target, hence the detection of the physical parameters (e.g. the velocity of the electromagnetic waves that reflect the actual depth of the target, definition of dielectric constant for that medium). The reading of the radar section depends mainly upon the gained experience of the interpreter and his judgment of information detection.
ReflexW software (Sandmeier, 2002) was used in the present study to process the gathered radar data since this software is characterized by high capabilities for matching between different systems of radar collected data. The data processing includes the following sequences:
- Declipping/Threshold.
- Subtract-DC-shift.
- Correct maximum phase.
- Bandpass frequency depends on the antenna used.
- Subtract-mean(dewow).
- Move the start time to zero level by subtracting the time for direct waves to travel between the source and receiver in nanoseconds (this time is depending on the size of the antenna used).
- Energy decay with scaling value equal to 1.
- Average XY-filter with several traces 10 and 5 in the x and y direction, respectively.
- Stack traces to enhance the S/N ratio.
- Subtracting average every 200 traces.
- Background removal.
- Migration.
- Bandpass frequency filter to enhance removing the remaining artifacts.
The data was analyzed in 2D and 3D to define the changing level for both the brightness and location accuracy of the voids.
4 Results
These two blocks have been surveyed along the same lines to detect the internal voids by different GPR devices such as CX11 (with antenna of 1200 and 1600 MHz), Conquest (with antenna of 1000 MHz), Ramac (with an antenna of 800 MHz), and HandyScan with antenna of 1500 MHz) and the results are then compared.
4.1 Medium-scale void-size (70 mm and 100 mm)
For block No.1, using an 800 MHz antenna, the location of both voids could be detected at a depth of 280 mm for the first void and 200 mm for the second one (Fig. 3a). When a 1000 MHz antenna was used the accuracy level of the data increased in the second step for both 2D and 3D, due to the good coverage of the survey concerning the 28-grid lines with a spacing of 50 mm. The first void was represented more accurately in the second step (Fig. 3b & 3c) while the level of accuracy decreased significantly concerning 14-grid radar profiles for the same void (Fig. 3d & 3e). When a 1200 MHz antenna was used, the depth of penetration increased up to 500 mm (Fig. 3f). The degree of brightness decreased in the upper part of block No.1, however, due to the decrease in the frequency range compared to what is considered to be the optimum value in the case of deeper targets. When a 1600 MHz antenna was used, it was noticed that the buried voids could be detected to a depth of 450 mm (Fig. 3g). The accuracy level of data decreased with the increasing depth (e.g., see void No.2 which was represented with low accuracy at a depth of 280 mm, and compared with void No.1 at a depth of 200 mm).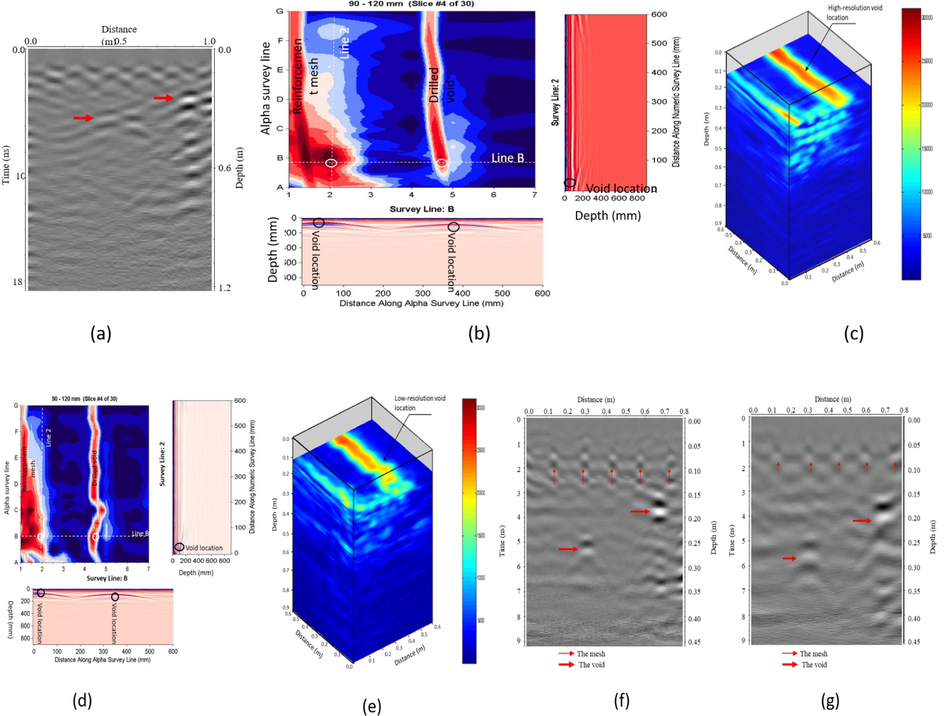
A) Radar section for block No.1 with 800 MHz, B) 2D radar slice section shows the extension of void No.1 (right) inside concrete block No.1 using 1000 MHz on the northern front, 2D radar section at survey line no.2 shows the location void along the line, and 2D radar acquires alone the alpha survey line (b) and shows the location of two voids that highlights in circles, C) 3D radar section shows the extension of void No.1 inside block No.1 using 1000 MHz (grid of 28 radar lines), D) 2D radar slice section shows the extension of void No.1 (right) inside block No.1 using 1000 MHz (grid of 14 radar lines), and 2D radar sections as described in Fig. 3b, E) 3D radar section shows the extension of void No.1 inside block No.1 using 1000 MHz (grid of 14 radar lines), F) GPR section with frequency 1200 MHz acquired at the top of block No.1, G) GPR section with frequency 1600 MHz acquired at the top of block No.1.
For block No.2 and using 800 MHZ, it was noticed that both voids could be detected at a depth of 220 mm (for the first void) and 600 mm for the second one (Fig. 4a). The second void could be detected more clearly at this frequency than with the other frequencies (Fig. 4b). The accuracy in the detection of the first void decreases gradually with a decreasing frequency value. The radar profiles were also conducted vertically for this block. Using 1200 (Fig. 4b) and 1600 MHz (Fig. 4c) antennas it was clear that the accuracy level with which the first void was detected decreased compared with when the 1600 MHz antenna was used. This is because the lower frequency antenna (1200 MHz) gives a great depth of penetration, although accompanied by a decrease in the accuracy level of the data. The first void had a depth of 220 mm while the second one was located at a depth of 600 mm. The radar section for the 1600 MHz antenna illustrates that a higher accuracy level can be noticed for the first void but the second void does not appear clearly in the radar section. This is due to the increase in depth and the small size of the second void, as well as the higher frequency antenna, which has a limited penetration depth. This block was also surveyed vertically and the apparent depths of the voids changed with the vertical survey, in that the depth of the first void is shown as 700 mm and the second one as 180 mm. Fig. 4d indicates that the second void can be differentiated well by a 1600 MHz antenna but the first one cannot be seen clearly due to its increasing depth.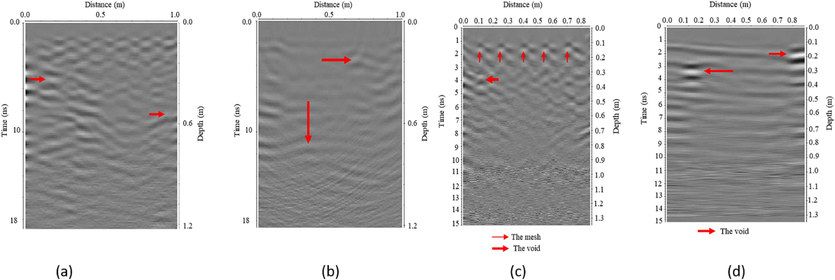
A) Vertical Radar section for block No.2 with 800 MHz, B) Horizontal Radar section for block No.2 with 800 MHz, C) Horizontal survey for void No.1 in block No.2 with 1200 MHz antenna, D) Radar section for voids No. 1 and 2 in block No.2 with 1200 MHz antenna. Note that the survey line is taken from the bottom to the top of block No.2 in the vertical direction.
4.2 Small-scale void-size (10, 14, 16, and 25 mm)
While the 800 MHz antenna was more effective at detecting the location of voids with large sizes (Fig. 5a), the smaller voids (with a size of 25 mm) could be detected by this antenna at depths greater than 250 mm (Fig. 5b). When a 1200 MHz antenna was used, the accuracy level decreased for the smaller-sized voids (10 mm and 14 mm) nearer to the surface (at depth ranges from 100 to 200 mm). The accuracy level increased, however, for voids with a size of 16 and 25 mm (Fig. 5c), while it was difficult to detect voids with smaller size ranges, from 10 to 14 mm, and those located at a distance of less than 100 mm from the surface of the blocks. A 1500 MHz antenna, meanwhile (Fig. 5d), achieved a maximum depth of penetration of 250 mm. This antenna was characterized by its ability to detect voids with a size as small as 10 mm at depths up to 150 mm inside the concrete block, while also it could detect larger voids (up to 16 mm and 25 mm) at depth ranges from 100 mm to 250 mm. A 1600 MHz antenna, however, had an adequate level of accuracy for the detection of voids of 10 mm located at different depths (Fig. 5e). This antenna was better at detecting voids of 25 mm diameter at depths up to 250 mm (Fig. 5f).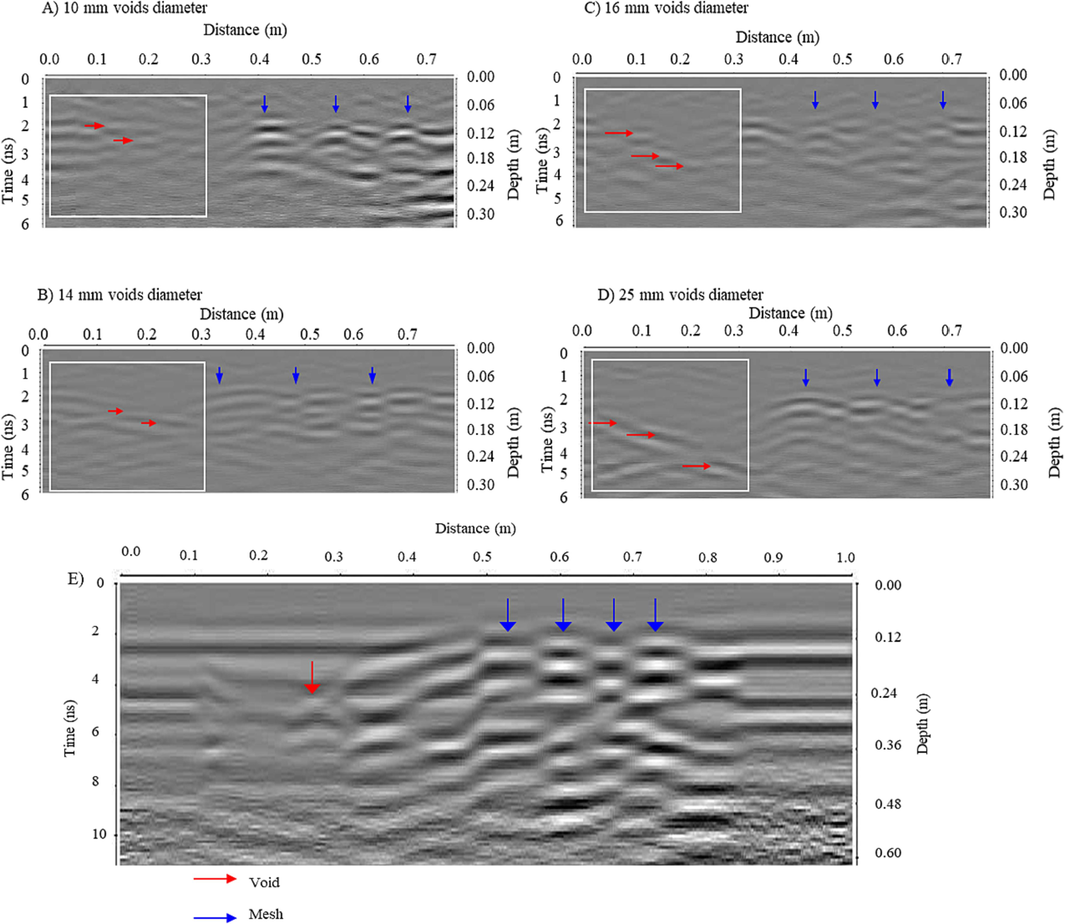
A) Radar section with 1200 MHz for voids has 10,14,16 and 25 mm arranged from top to bottom, B) Radar section with 1600 MHz for voids have 10,14,16 and 25 mm arranged from top to bottom, C) Horizontal survey for void No.1 in block No.2 with 1600 MHz antenna, D) Vertical survey for void No.2 block No.2 with 1600 MHz antenna, E) Radar section for the voids with 25 mm and depth 30 cm with 800 MHz.
4.3 Evaluation of residential buildings
4.3.1 The inhomogeneity of the depth of the reinforcing steel
Radar survey No. 1 in one of the corners of the building shows a sudden difference in the depths of the reinforcing steel, which is located near an area with a subsidence of the floor. It is distinguished from Fig. 6a that the left part of the reinforcing steel is not clear, which is due to the lowering of the reinforcing steel level to a deeper level, which may be the result of subsidence of the concrete floor or poor construction work. Fig. 6b also shows two-dimensional imaging of the same test site, where the low steel level can be located on the left side of the image and is defined between raster lines 1 to 6 and from A to K.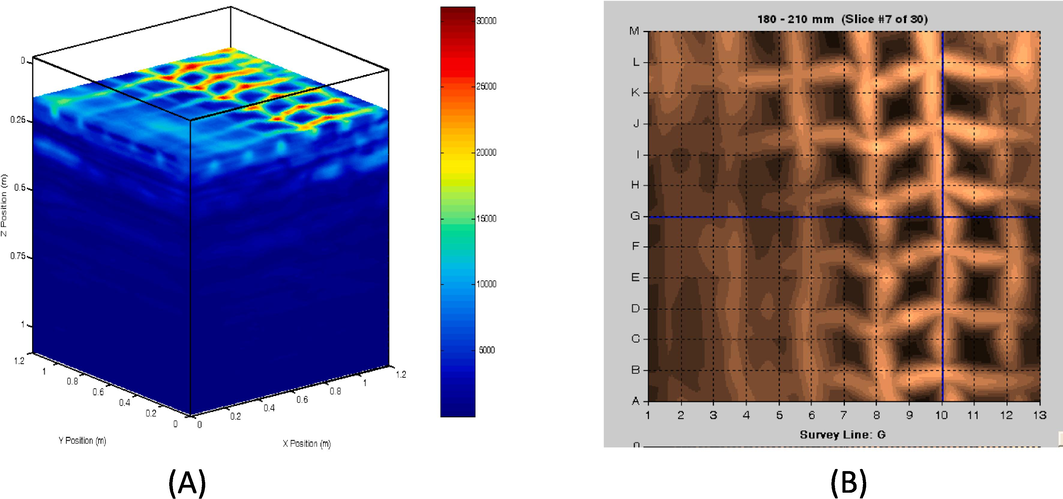
A) shows 3D imaging of reinforced concrete components, indicating a decrease in the depth of the reinforcing steel level, (B) a 2D image of reinforcing steel showing the difference in the level of steel depth on the left side of the figure at a depth of up to 18 cm.
4.3.2 The impact of the site rehabilitation process and identification of voids
Fig. 7a indicates reflection from the concrete at a depth of approximately 0.25 m, which is a gap that occurred as a result of subsidence in the soil, and after the rehabilitation process we see that it has partially disappeared as in Fig. 7b and this shows us the ability of the survey. The radar is used to identify the gaps within the concrete installation. Similarly, in Fig. (8a & 8b) in site No. 2, it is noticed that the gaps are indicated by the arrows, and the gap appears by deducting part of the 3D radar section to identify it. It is also possible to note the effect of the void, which fades after the rehabilitation process.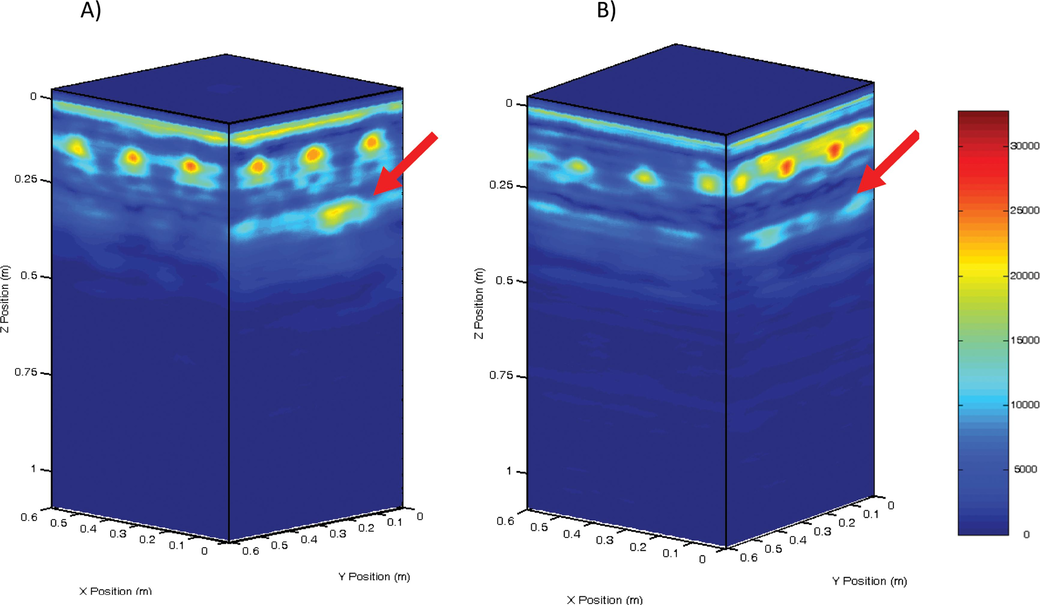
GPR imaging of site No. 1; A) before the rehabilitation process, showing the presence of a void, (B) after the rehabilitation process.
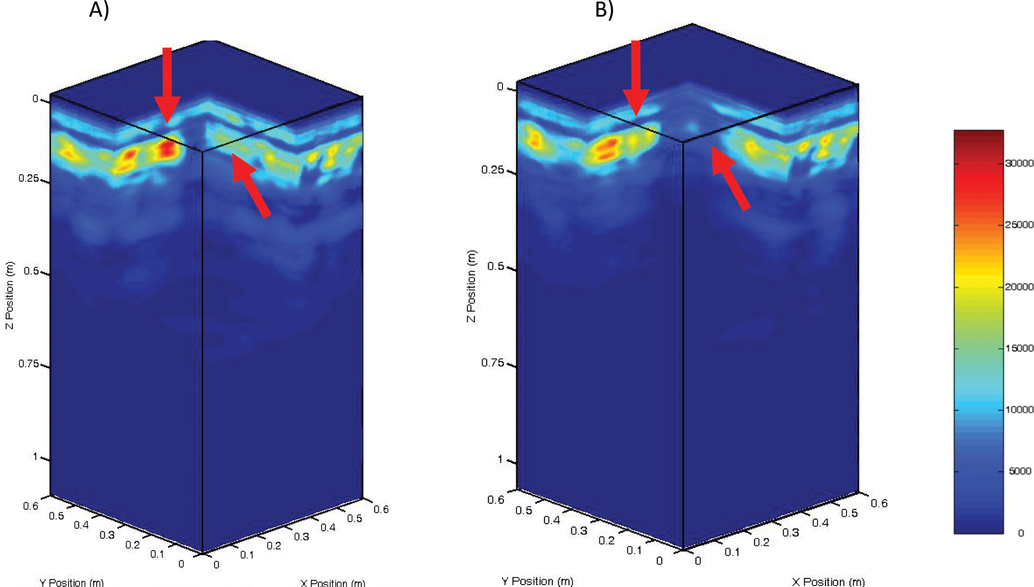
3D GPR images for the concrete before ( A) and after (B) the rehabilitation process at site No. 2.
4.3.3 Determine the distance between the reinforcing steel
The amount of steel used in reinforced concrete can be defined by knowing the total area of the concrete structure and measuring the distance between the reinforcing steel in the radar section. The dotted vertical and horizontal lines in Fig. 9a show the radar survey network of the site with a line spacing of 5 cm. Therefore, the distance between the rebar is 20 cm × 20 cm. It is also possible to see the site of random sampling, which caused damage to the steel, as shown by the arrow. Moreover, the appropriate sites for taking the test sample can be identified (Fig. 9b) without causing any damage to the steel grid, regardless of the increase in the number of steel levels (as indicated by the yellow arrow).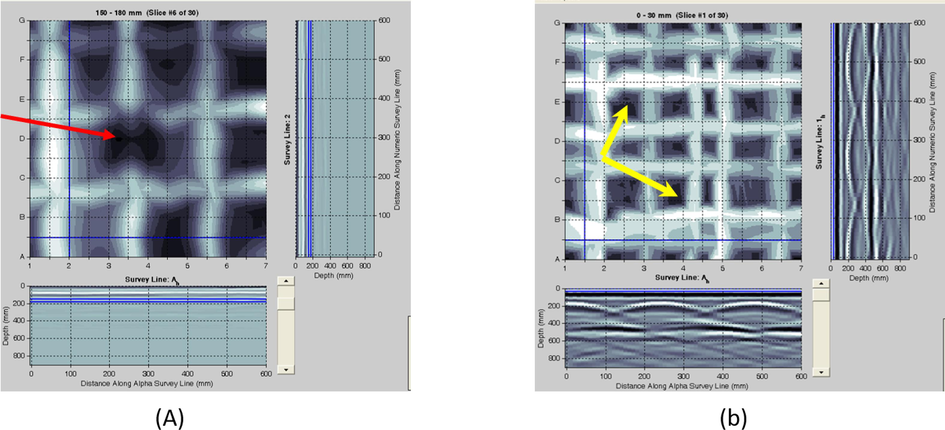
A) The arrow indicates the cut in the steel grid as a result of core sampling, and (B) the steel network during 2D imaging.
5 Discussion and conclusions
The results for the 800 MHz antenna were compared with the results for 1200 and 1600 MHz in the vertical direction of the survey. The first void, at a depth of 700 mm (in the vertical survey) can be detected with a relatively low accuracy level. It is apparent also that the accuracy level for the second void when 800 MHz is used decreases compared to the other frequencies. According to the results of this study, it can be concluded that: The frequency value used plays an important role in determining the resolution of the target. For deep targets whose depth ranges from 30 cm to 60 cm, using low-frequency values (800 MHz) is considered better. While frequencies 1000-1200-1600 MHz are suitable for shallow depths of up to 45 cm. The response of the radar signals to the target increases according to the size of the target whereas the type of target plays an important role in increasing or decreasing the accuracy level. By using 1600 MHz antena frequency, we found that the difficulty in identifying small voids of 10-25 mm is increased as the depth become greater than 17 cm. Voids with a size of 25 mm can be distinguished on the radar section using both frequencies 800-1200-1500-1600 MHz. The frequency of 1600 MHz is considered more accurate than the frequency of 1200 MHz (CX11 device) when searching for voids of 10 mm in size and up to 17 cm in depth.
The accuracy of radar data using the HandyScan device decreases depending on the depth and size of the target as follows: the best penetration depth obtained using the HandyScan device with antenna of 1500 MHz is 25 cm, and this is what was observed when searching for gaps with a size of 25 mm. The maximum penetration depth obtained to distinguish a gap size of 16 mm using the HandyScan device is 15 cm. Using the Ramac device with a frequency of 800 MHz, the void was identified with a size of 25 mm and a depth of no less than 30 cm, while the voids with sizes of 10-14-16 mm were identified, the frequency given did not represent a clear response to these size of voids.
Through the survey of two sites (No. 1, 2) inside the building located in the residential area of King Abdulaziz City for Science and Technology, using the Conquest radar scanning device at a frequency of 1000 Hz, GPR images were used to evaluate those sites from the possibility of the presence of voids, and the change in the behavior of electromagnetic waves before and after the rehabilitation of the building. The radar scan was characterized by its high ability to locate rebar sites, whether with a single level or two levels, in some building locations. It was found that the instability or difference in the depth of the reinforcing steel through the cement material, especially in the sites with subsidence of the soil, can be distinguished with high accuracy on the radar section, and thus knowing the extent of the impact of the reinforced concrete as a result of the subsidence of the soil.
The engineering dimensions of the reinforcing steel were imaged in some locations, which are in the form of two grids that take the dimensions (20 cm × 20 cm) and at a depth of (10 cm and 20 cm) inside the concrete. The average thickness of the concrete for the building was 30 cm. Voids are formed inside the reinforced concrete as well as between the lower concrete surface and the ground as a result of soil subsidence, which is one of its indicators is the presence of fractures and cracks in the apparent surface of the concrete. Radar scanning was used to determine this expected type of void, as some of them were imaged before and after the building rehabilitation process.
GPR is an effective imaging method for many applications where the evolution of GPR applications for concrete structures surveys has grown to recover geometrical information including rebar location, reconstruction of detailed structural elements, as well as locating the geometrical extemtions of internal defects such as void, honeycombing, and delamination. These recent applications appeared with the evolution of GPR technology with new high-frequency ground-coupled antennas (>1 GHz). Moreover, GPR is used to inspect buildings in three major areas; the first is to locate unseen objects and structures for the sake of heritage conservation and construction compliance checks. The second is the mapping of deterioration which serves as a decision-making tool for preventive/ad-hoc maintenance. The third is an assessment of structural damage after natural disasters like flooding, earthquakes, and landslides. The key advantage of GPR in geotechnical applications is to provide detailed information about the subsurface layers and supporting conventional well logging techniques. The aim of this is to make a detail cross section for the unknown gap of layers between the drilled boreholes which are normally expensive and technically limited in numbers. In addition, GPR found to be useful in identifying underground utilities including high-pressure water supply pipes, gas pipes, power cables, sewers and stormwater drainage, telecommunication cables, street lighting, traffic lighting cables, etc. Different types of concrete structure can be scanned by GPR, such as both plain concrete structures and reinforced concrete structures. In such structures, GPR can be easily utilized to determine concreate discontinuities, utilities, internal defects such as void or cracks based on the changes of electromagnetic waves properties.
CRediT authorship contribution statement
Majed A.Almalki: Conceptualization, Funding acquisition, Data curation, Writing – original draft, Investigation, Formal analysis, Methodology, Supervision, Resources, Project administration, Software. Khalid F. Almutairi: Writing – review & editing, Visualization, Validation, Software.
Acknowledgments
This work was supported by the King Abdulaziz City for Science and Technology (KACST). The author thanks the anonymous reviewers for their time-consuming and constructive comments.
References
- Abdul Razak, N., Senin, S.F., Hamid, R., 2015. Detection of sizes and locations air voids in reinforced concrete slab using ground penetrating radar and impact-echo methods. Jurnal Teknologi (Sciences& Engineering) 74:3 (2015), 63–67.
- Multi-frequency GPR images for civil engineering applications. Can. J. Basic Appl. Sci.. 2013;1(2):118-124.
- [Google Scholar]
- Rebar detection using GPR an emerging non-destructive quality control approach. Int. J. Eng. Res. Appl. (IJERA). 2015;1(4):2111-2117.
- [Google Scholar]
- Detecting voids within a historical building façade: a comparative study of three high-frequency GPR antenna. J. Cult. Herit.. 2018;32
- [Google Scholar]
- Radar inspection of structures. Proc. Int. Civ. Engnrs. Struct. Build.. 1993;99:173-178.
- [Google Scholar]
- Evans, R.D., 2009. Optimizing Ground Penetrating Radar (GPR) to Assess Pavements. Ph.D. Thesis, Loughborough University, 219 P.
- Evaluating asphalt concrete air void variation via GPR antenna array data. Case Stud. Nondestructive Test. Evaluat.. 2015;3:27-33.
- [Google Scholar]
- A Case study of ground penetrating radar for non-destructive testing applied to underground culvert structures. J. Emerg. Trends Eng. Appl. Sci. (JETEAS). 2011;2(6):1079-1082.
- [Google Scholar]
- Case discussion of applying GPR data interpretation on surveying underground cavities. Annual Meet. Acad. Seminar Geol. Soc. China 2003:89-94.
- [Google Scholar]
- Accuracy of pavement thickness estimation using different GPR analysis approaches. In: Proceedings of 40th International Assembly on Non-Destructive Testing & Engineering. 2007. p. :147-157.
- [Google Scholar]
- Loken, M., 2007. Use of ground penetrating radar to evaluate Minnesota roads. Final report, Minnesota Department of Transportation, 45 P.
- Maser, K., Scullion, T., 1992. Influence of Asphalt Layering and Surface Treatments on Asphalt Base Layer Thickness Computations Using Radar. Report No. TX-92-1923-1, Texas Transportation Institute (September 1992).
- Millard, S.G., Davis, J., Huang, Y., Bungey, J.H., 2002. A wide band system for measuring the dielectric properties of concrete. Proc. SPIE 4758, Bellingham USA, 416-421.
- Identifying voids in plastic ducts in post-tensioning prestressed concrete members by resonant frequency of impact-echo. SIBIE And Tomography Constr. Build. Mater.. 2007;21:527-537.
- [Google Scholar]
- Ground penetrating radar response from voids: a demonstration using a simple model. NDT and E Int.. 2017;91:47-53.
- [Google Scholar]
- GPR systems for Road and bridges. In: Proceedings of the 4Th International Conference on GPR. 1983.
- [Google Scholar]
- Pollock, D.G.; Dupuis, K.J.; Lacour, B., Olsen, K.R., 2008. Detection of voids in prestressed concrete bridges using ground penetrating radar. Research report; project DTFH61-05-C-0008, Task No. 8, Washington State University, 77 p.
- Rao, P., Kumar, V.S, Kishore, R., Bhikshma, V., 2007. Ground penetrating radar and its applications in civil engineering. The Indian Concrete Journal, November 2007, PP- 35-40.
- Rister, B.W., Graves, R.C., 2008. Investigation of the extended use of ground penetrating radar for measuring in-situ material quality characteristics. Final report, Kentucky Transportation Center, University of Kentucky, 33 P.
- Roddis, W.M., Master, K.R., Gisi, A.J., 1992. Radar Pavement Thickness Evaluation for Varying Base Conditions. Transportation Research Record 1355, Transportation Research Board, National Research Council, Washington, D.C. pp. 90-98.
- Insulated Concrete Form Void Detection Using Ground Penetrating Radar. In: PIERS Proceedings. 2011.
- [Google Scholar]
- ReflexW, V2.5, Program for Processing and Interpretation of. Karlsruhe: Reflection and Transmission data. Software and Documentation; 2002.
- Tian X., Zhao, W., Du, Y., Wang, B., 2018. Detection of mortar defects in ballastless tracks of high-speed railway using transient elastic wave method. J. Civil Struct. Health Monit. 8(1) (2018) 151–160.
- A versatile tuneable curvelet-like directional filter with application to fracture detection in two-dimensional gpr data. Signal Process.. 2017;132:243-260.
- [Google Scholar]
- Detecting voids in reinforced concrete slab by SIBIE. Constr. Build. Mater.. 2004;18:225-231.
- [Google Scholar]
- Yang, Y., Junwei Lu, Rongzhe Li, Weigang Zhao, Deli Yan, 2020. Small-Scale Void-Size Determination in Reinforced Concrete Using GPR. Advances in Civil Engineering Volume 2020, Article ID 2740309, 11 pages. https://doi.org/10.1155/2020/2740309.


