Translate this page into:
Inhibition of X80 steel corrosion in oilfield acidizing environment using 3-(2-chloro-5,6-dihydrobenzo[b][1]benzazepin-11-yl)-N,N-dimethylpropan-1-amine and its blends
⁎Corresponding author. ebituen@gmail.com (Ekemini B. Ituen)
-
Received: ,
Accepted: ,
This article was originally published by Elsevier and was migrated to Scientific Scholar after the change of Publisher.
Peer review under responsibility of King Saud University.
Abstract
Corrosion of X80 steel was investigated in simulated acidizing fluids containing different concentrations of 3-(2-chloro-5,6-dihydrobenzo[b][1]benzazepin-11-yl)-N,N-dimethylpropan-1-amine (3CDA) at different temperatures using weight loss and electrochemical techniques. X80 steel used corroded at higher rates in the uninhibited acid solution than in the inhibited solutions. Inhibition efficiency of 3CDA was highest (88.8%) at 10 × 10−5 M concentration at 30 °C and decreased as temperature decreased. Some intensifiers were added to improve the inhibition efficiency at high temperatures. The 3CDA acts as mixed type inhibitor and adsorbs spontaneously on steel surface by physical and chemical interactive forces. Techniques such as FTIR, SEM and EDAX were also employed to characterize the potential of 3CDA as efficient steel corrosion inhibitor for oilfield application.
Keywords
Corrosion inhibitor
Adsorption
EIS
SEM/EDAX
FTIR
1 Introduction
The choice of materials for construction of pipelines, liners, casing strings and tubing is important in the oil and gas industry. Factors such as cost, metallurgical issues and corrosion resistance are usually considered. Owing to its mechanical strength, steel is the most reliable metal used for construction of these materials. To achieve other desired properties such as resistance to corrosion and reduced weight, trace amounts of other elements like chromium, sulphur, phosphorus, and manganese can be added to iron to obtain steel of different grades. Such steel grades like API 5L X70, X80, X60, X65, X52 and X42 have now been extensively preferred for line pipe applications (Heidersbach, 2010; Kennedy, 1993; Siciliano et al., 2008). Others include API-5CT J55, J55N, N80-P110 and K55 for welded casing and tubing pipes and low carbon steel or mild steel for pipework and storage facility construction (Smith, 1999; Ueda et al., 2000). The difference in the relative amounts of elements used to fabricate the alloys determines the difference in their properties (Nešić, 2007). However, these alloys still corrode or fail and may require replacement or maintenance, which could warrant shutting down of plant, down production time and other risks which no industry would like to take (Azevedo, 2007; Kermani and Harr, 2008).
It is not possible to recover hydrocarbons from wells indefinitely because, in future, the well may loose its natural pressure. When this happens, it is more economical to apply chemistry knowledge to maintain production than to abandon the well and drill new ones. The knowledge commonly applied include acidizing, fracturing, flooding and other secondary and enhanced oil recovery operations. Acidizing is a common practice, in which acid (usually HCl) is forced into the well through its bore to either to clean/descale the steel pipe work or to dissolve formation rocks and create new channels for oil to flow out (Ituen et al., 2016a,b). Hydrochloric acid concentration of about 5–15% is frequently used depending on the type of acidizing operation involved (Finšgar and Jackson, 2014). Since HCl in both is very corrosive, its contact with the steel pipe works generates corrosion problems. Thus, corrosion is a major global challenge to the petroleum industry. Its consequences include spills, materials failure, loss of integrity of materials and flow problems. Production cost may also increase if there is need to clean/remediate the environment due to spillage. It is easier and simpler to add small amounts of corrosion inhibitors to the acidizing fluid to reduce corrosion rate and increase materials longevity.
Most oilfield corrosion inhibitors are derived from organic compounds containing electron rich atoms sites (such as nitrogen, oxygen, multiple bonds and aromatic or heterocyclic rings) in their molecular structures (Finšgar and Jackson, 2014). These are regarded as potential active sites for adsorption on metal surface and interaction with low lying metal vacant orbitals leading to formation of thin protective film on the metal surface (Muralisankar et al., 2017). Many efficient organic corrosion inhibitors reported in literature are either toxic or very expensive. Therefore, in search for non-toxic and cheap corrosion inhibitors, scientists have tried plants materials (Alaneme et al., 2016; Bammou et al., 2014; Hussin et al., 2016; Jokar et al., 2016; Rajeswari et al., 2014) and some non-toxic organic compounds (Barouni et al., 2008; Fouda et al., 2011; Ituen et al., 2016a,b; Müller, 2002; Sathiyabama and Rajendran, 2012) but some of them are inefficient at high (down-hole) temperatures.
In the present study, 3-(2-chloro-5,6-dihydrobenzo[b][1]benzazepin-11-yl)-N,N-dimethylpropan-1-amine (3CDA) is being investigated as alternative corrosion inhibitor for mild steel in HCl. It is a non-toxic and cheap compound, also called clomipramine, which has been isolated and characterized from Griffonia simplicifolia seed extracts (Adotey, 2009). It has been reported as an active drug for treatment of obsessive-compulsive disorder, depression, cataplexy and phobias (Kellner, 2010; Pittenger et al., 2005; Schachter and Parkes, 1980) without potential danger to health. We were motivated to investigate 3CDA because there are potential active sites in its molecular structure (see Fig. 1), it is non-toxic and it has not been reported as corrosion inhibitor for X80 steel in HCl. The acidizing solution is simulated in the laboratory using HCl of different concentrations (3.7% and 15%), which fall within the range of concentrations usually encountered in the field[10]. Some intensifiers are blended with 3CDA to improve its efficiency at high temperature. X80 steel is used in this study because it is widely used for construction of casings, tubing and large-diameter high strength pipelines (Witek, 2015).![Molecular structure of 3-(2-chloro-5,6-dihydrobenzo[b][1]benzazepin-11-yl)-N,N-dimethylpropan-1-amine.](/content/185/2019/31/1/img/10.1016_j.jksus.2017.06.009-fig1.png)
Molecular structure of 3-(2-chloro-5,6-dihydrobenzo[b][1]benzazepin-11-yl)-N,N-dimethylpropan-1-amine.
2 Experimental
2.1 Reagents and preparation
Analytical grade (37%) HCl supplied by BDH, England was used in this study. It was diluted to concentrations of 1 M (3.7%) and 4.4 M (15%) using double-distilled water. Powdered industrial grade 3-(2-chloro-5,6-dihydrobenzo[b][1]benzazepin-11-yl)-N,N-dimethylpropan-1-amine was supplied by Meryers Co. Ltd., China and was used as supplied to prepare different concentrations of 3CDA (1 × 10⁻⁵, 3 × 10⁻⁵, 5 × 10⁻⁵, 8 × 10⁻⁵ and 10 × 10−5 M) in acid solutions. The compounds used as intensifiers are Analar grade potassium chloride, (KI) supplied by Meyer Chemical Technology Co. Ltd. China; Analar grades of sodium gluconate (NaG) and Glutathione (GLU) supplied by Wuhan Yuancheng Gongchuang Technology Co. Ltd. China; and industrial grade polyethylene glycol (PEG, M.wt 4000) supplied by Richest group Ltd., China. They were each prepared (as supplied) into concentration was 1 × 10⁻⁶ M and blended with 3CDA at the ratio 1:1 in the HCl.
2.2 Steel specimens and surface finishing
The composition of X80 steel used was C (0.065), Si (0.24), Mn (1.58), P (0.011), S (0.003), Cu (0.01), Cr (0.022), Nb (0.057), V (0.005), Ti (0.024), B (0.0006), Fe (balance). The coupons (dimension 2 cm × 2 cm) were supplied by supplied by Qingdao Tengxiang Instrument and Equipment Co. Ltd., China. The surface was prepared following NACE Recommended Practice RP-0775 and ASTM G-1 & G-4 for surface finishing and cleaning of weight-loss coupons. Other coupons were abraded to mirror surface using CC-22F P2000 grade and 1 cm2 of the surface area was exposed for electrochemical studies. Coupons for SEM/EDAX tests were of dimensions 2 cm × 1 cm. Prepared specimens were enclosed in sealed water-proof bags and stored in moisture free desiccator prior to use.
2.3 Weight loss tests
The ASTM standard procedures for weight loss measurement were followed (Ahmad, 2006). Immersion time of the pre-weighed coupons in all test solutions was five hours. The experiments were carried out at different temperatures (i.e. 30, 45, 60, 75 and 90 °C) maintained using a water bath. The corroded coupons were retrieved, washed in 20% NaOH solution containing about 200 g/L of zinc dust until clean, dried in air after rinsing in acetone and reweighed. Triplicate measurements were taken per test solution and the average weight loss (
) was calculated. Corrosion rate (CR) of iron, percentage inhibition efficiency (
) and degree of surface coverage (θ), were calculated using Eqs. (1)–(3) respectively.
2.4 Electrochemical tests
The usual three electrode set up comprising of saturated calomel electrode (SCE) as reference electrode, platinum as counter electrode and the X80 steel as working electrode was used. Gamry Reference 600-18042/ZRA Potentiostat/Galvanostat was used for all electrochemical tests. The system was allowed to attain steady open circuit potential (OCP) between 0 and 1800 s before measurements were made. EIS was conducted at frequency of 10 kHz to 10 mHz at 30 °C. Polarization measurements was conducted between −0.15 V and +0.15 V vs. EOC at scan rate of 0.2 mV/s (Rajeswari et al., 2014). Experiments were conducted in 1 M HCl without and containing 1 × 10⁻⁵, 5 × 10⁻⁵ and 10 × 10−5 M 3CDA. The data generated were analyzed using E-Chem Analyst software. Nyquist plots were constructed and charge transfer resistances were obtained from analysis of the curves. Values of charge transfer resistances obtained were used to compute the inhibition efficiency according to Eq. (4). Double layer capacitance
of the adsorbed film was calculated from constant phase element (CPE) constant (
) and charge transfer resistance (
) using Eq. (5). Corrosion current densities were obtained from analyses of Tafel plots and used to also calculate inhibition according to Eq. (6).
2.5 FTIR study
FTIR spectrum of the pure 3-CDA and that of the surface film formed on X80 steel surface after immersion (both mixed with potassium bromide) were recorded using and TENSOR II FTIR Spectrophotometer.
2.6 SEM/EDAX study
SEM morphologies of X80 steel surface were recorded in the vacuum mode after immersion in 1 M HCl for 5 h and repeated after steel immersion in 10 × 10−5 M 3CDA solution. Also, EDAX profiles of the steel surface ab initio and the corrosion products in the inhibited and uninhibited solutions were recorded.
3 Results and discussion
3.1 Weight loss measurement
The weight loss technique has been regarded as the most reliable method to simulate corrosion of metals and estimate the efficiency of corrosion inhibitors Ahmad, 2006). This is because with weight loss technique, it is simple and more accurate to determine the amount of metal lost to the acidizing fluid as a function of time, described as corrosion rate. The corrosion rate of X80 steel obtained is high in the free acid solution, but decreases on addition of 3CDA, depending on its concentration. Results presented in Table 1 show that addition of higher concentration of 3CDA leads to more decrease in corrosion rate of X80 steel. This demonstrates that 3CDA inhibits X80 steel corrosion in all the acid solutions. The efficiency of inhibition is higher when 3CDA concentration is increased. However, at fixed 3CDA concentration, the efficiency decreases as the acidic fluid strength increases. For example, 10 × 10−5 M 3CDAis 88.8% and 74.8% efficient in 1 M HCl and 15% HCl respectively, representing about 15.8% decrease in efficiency for about 340% increase in acid concentration. In oil and gas production, 5% to 15% HCl is required for matrix and well bore acidizing while 15% to 28% HCl is required for acid fracturing procedures (McLeod, 1989). It therefore follows that 3CDA will be effective as a single corrosion inhibitor to an extent in the former than the later. To improve the efficiency especially at HCl concentration of 15% and above, the quantity or concentration of 3CDA can be increased by taking into consideration that the amount of inhibitor,
, required for a given acidizing fluid of volume, V, can be estimated using Eq. (7) (Ahmad, 2006).
Conc. (M)
1 M HCl
15% HCl
(mmpy)
(%)
(mmpy)
(%)
0
39.45
–
69.41
–
1 × 10⁻⁵
8.99
77.2
0.876
29.10
58.1
0.581
3 × 10⁻⁵
8.17
79.3
0.884
25.47
63.3
0.633
5 × 10⁻⁵
6.63
83.2
0.903
22.14
68.1
0.681
8 × 10⁻⁵
5.92
85.0
0.910
19.85
71.4
0.714
10 × 10−5
4.42
88.8
0.888
17.49
74.8
0.748
3.2 Effects of synergistic blends
Apart from increasing the concentration, Finsgar and Jackson reported that many corrosion inhibitors can perform more efficiently if blended with synergistic intensifiers (Finšgar and Jackson, 2014). In this study, 10 × 10−5 M 3CDA is blended with 10 × 10−6 M of each of KI, PEG, NaG and GLU. The inhibition efficiency increased to 92.8, 96.4, 90.1 and 98.3% in 1 M HCl and 88.6, 90.3, 78.1 and 91.4% in 15% HCl for (3CDA-KI), (3CDA-PEG), (3CDA-NaG) and (3CDA-GLU) respectively as shown in Table 2. Therefore, the additives increase 3CDA efficiency and afford efficient anticorrosion oilfield chemical blends for the aggressive fluids. The efficiency of 3CDA blends follow the trend (3CDA-GLU) > (3CDA-PEG) > (3CDA-KI) > (3CDA-NaG).
Conc. (M)
1 M HCl
15% HCl
(mmpy)
(%)
(mmpy)
(%)
10 × 10−5 3CDA
4.42
88.8
0.888
17.49
74.8
0.748
3CDA-NaG
3.90
90.1
0.901
15.20
78.1
0.781
3CDA-KI
2.84
92.8
0.928
7.91
88.6
0.886
3CDA-PEG
1.42
96.4
0.964
6.73
90.3
0.903
3CDA-GLU
0.67
98.3
0.983
5.97
91.5
0.915
3.3 Effect of temperature
The effectiveness of a corrosion inhibitor depends on the temperature which the operation is carried out (Mahgoub et al., 2011; Pal et al., 2016). Many rewarding pay zones are meters deep with average geothermal gradient up to 25 °C/km (Akpabio et al., 2003). This implies that down-hole temperature at a few kilometers from the surface may exceed 80 °C. At this and higher temperatures, the acidizing fluid becomes more aggressive on the steel surface so that the anticorrosive effect of the corrosion inhibitor used declines. Therefore, many compounds that are efficient at surface temperatures can be ineffective at down-hole temperatures.
In this study, the rates of corrosion of X80 steel in the absence and presence of 3CDA were elucidated at 30–90 °C. It was observed that corrosion rate of X80 steel increased as temperature increased. The inhibition efficiency of a given concentration of 3CDA decreases with increase in temperature. For instance, in 1 M HCl, 10 × 10−5 M 3CDA is 88.8% efficient at 30 °C and 72.5% efficient at 90 °C. This efficiency decreases further in 15% HCl from 74.1% at 30 °C to 57.2% at 90 °C. This demonstrates that 3CDA would not perform well at high temperatures as a single inhibitor. Therefore, the blends of 10 × 10−5 M 3CDA and KI, NaG, GLU and PEG were also tested that the same temperatures. Results show that at 90 °C for instance, the inhibition efficiency (%) of the blends are 80.5 (3CDA -KI), 81.5 (3CDA-NaG), 85.0 (3DA -PEG) and 87.7 (3CDA-GLU) in 1 M HCl. This implies that synergistic intensification effect of the additives follows the trend GLU > PEG > NaG > KI in 1 M HCl. However, in 15% HCl, the synergistic intensification follows a different trend as shown in Table 3. From this result, it can be observed that blends of 3CDA could be more effective corrosion inhibitors for high temperature acidizing procedure.
Inhibition efficiency (%) in 1 M HCl
Inhibition efficiency (%) in 15% HCl
T (°C)
3CDA only
3CDA-NaG
3CDA-KI
3CDA-PEG
3CDA-GLU
3CDA Only
3CDA-NaG
3CDA-KI
3CDA-PEG
3CDA-GLU
30
88.8
92.5
95.3
97.2
98.6
74.8
78.1
88.6
90.3
91.4
45
85.7
89.8
92.8
94.2
97.3
71.4
75.3
87.2
88.4
90.0
60
81.8
87.3
88.6
91.4
94.8
68.8
70.2
81.4
82.3
87.3
75
76.1
84.2
84.4
87.8
91.4
63.6
66.4
76.3
78.1
82.8
90
72.5
81.5
80.5
85.0
87.7
57.2
61.3
73.0
74.3
76.5
3.4 Adsorption studies
Most corrosion inhibitors are believed to function by adsorptive binding on metal active sites by means of their active functional groups. Such functional groups are usually electron rich sites like nitrogen, oxygen, heteroatoms, aromatic or heterocyclic rings and multiple bonds (Ituen et al., 2017). The adsorption could involve physical interactive forces like columbic or electrostatic attractions, dipole interactions, ion-dipole interactions, etc. Such binding forces are usually non-directional, non-stoichiometric, long-range interactive forces. Sometimes, formal chemical bonds may be formed between some sites in the inhibitor molecule and the metal orbitals. This kind of bond is usually coordinate in character and the adsorption behaviour is associated with chemical interactive forces. To predict the nature of adsorptive interaction between 3CDA and X80 steel, the degree of surface coverage data were fitted into adsorption isotherm models such as Langmuir, Temkin, El-Awady et al., Freundlich, Frumkin and Flory–Huggins. Temkin adsorption isotherm model (Fig. 2) gave the highest correlation coefficient (
) values and was used to describe the adsorption process. The model is written as shown in Eq. (8) and can be linearized to the form written in Eq. (9).
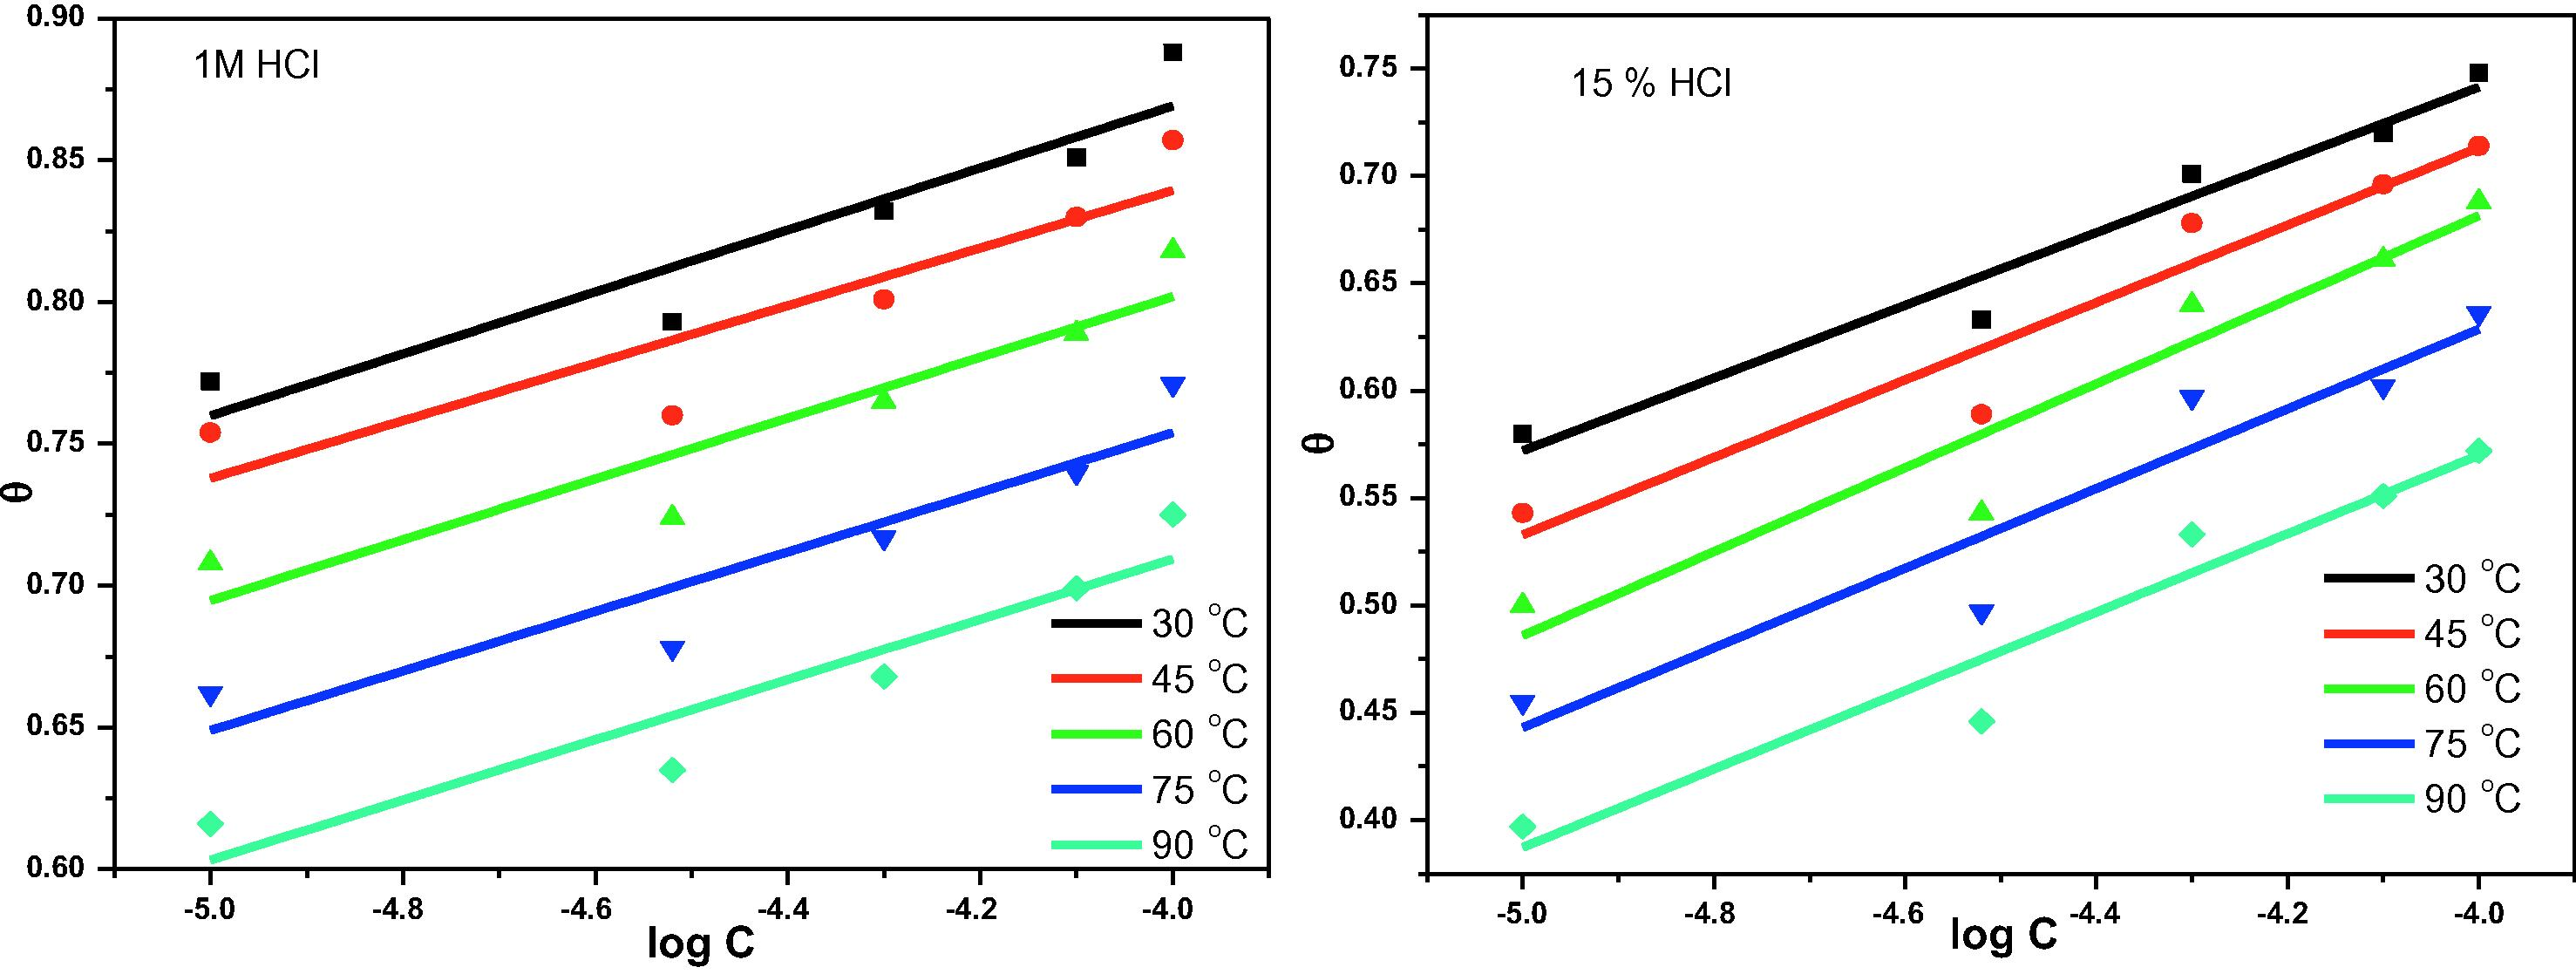
Temkin adsorption isotherm for 3CDA and X80 in 1 M HCl and 15% HCl at 30–90 °C.
T (°C)
1 M HCl
15% HCl
K (×105M−1)
(kJmol−1)
K (×105M−1)
(kJmol−1)
30
−4.59
1.60
−40.30
−2.96
0.43
−36.99
45
−4.91
1.99
−42.88
−2.78
0.29
−37.78
60
−4.67
0.99
−42.97
−2.55
0.18
−38.25
75
−4.76
0.71
−43.94
−2.69
0.16
−39.63
90
−6.72
0.44
−43.46
−2.78
0.12
−40.47
Slopes and intercepts of linear plots of
against
as shown in Fig. 2 were used to deduce the values of
and
according to Eqs. (10) and (11) respectively.
Results reveal that there is repulsion in the adsorbed layer since the values of
are all negative. Also, K values obtained decrease as temperature increases, indicating that the inhibitor-metal binding strength decreases as temperature increases, which implies that inhibitor-steel interaction may be by physical adsorption mechanism. However, the mechanism of adsorption is more reliably predicted from values of free energy change of adsorption (
) which can be related with K according to Eq. (12).
3.5 Kinetic and thermodynamic assessment
Like in other chemical reactions, temperature is a major factor that influences the rate at which a reaction proceeds. Some extrapolations were made from the Arrhenius model employed in chemical reactions to describe the kinetics of corrosion of X80 steel in the HCl. An exponential relationship between the corrosion rate and temperature may be written as shown in Eq. (13).
In the above equation, A is Arrhenius pre-exponential factor, R is the universal gas constant and T is the absolute temperature. For the acid molecules to corrode the X80 steel, they must effectively collide on the steel surface. An effective collision would correspond to a minimum energy called the activation energy (
). Corrosion rate data were used to construct the Arrhenius plots shown in Fig. 3 and the values of activation energy in absence and presence of the inhibitor were deduced and shown in Table 5. The activation energy is greater in the presence than absence of the inhibitor. Since activation energy is a minimum energy barrier, the results demonstrate that in the absence of the inhibitor, the acid molecules require lower energy to attack the metal surface. Addition of the inhibitor increases this energy barrier so that the acid molecules cannot attack the surface as it would without the inhibitor. This results in the inhibition of the corrosion process and in a temperature-dependent manner.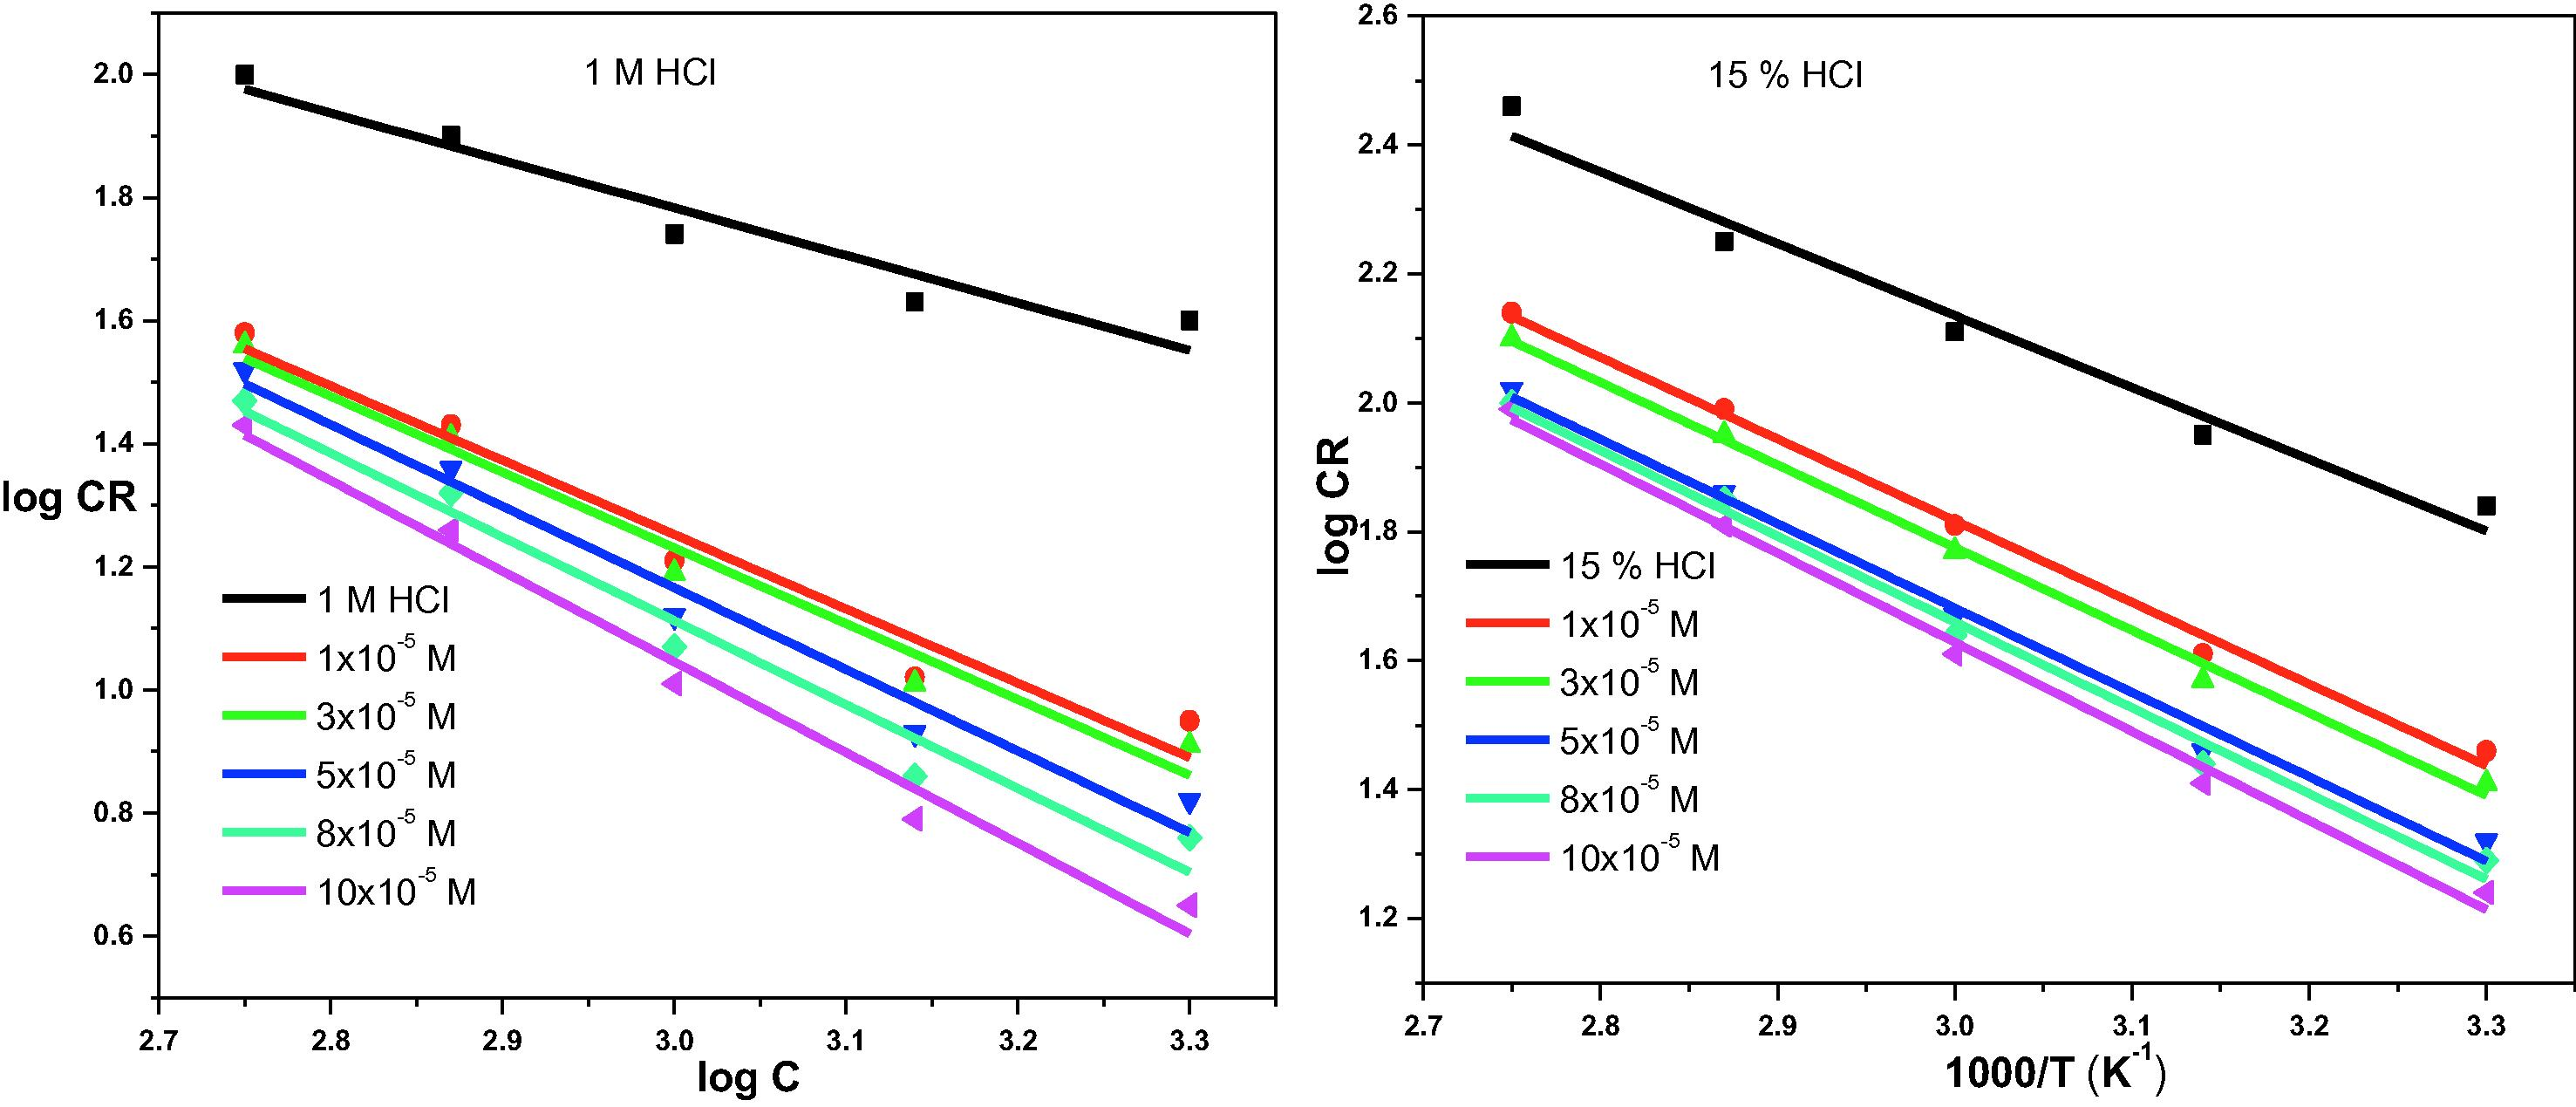
Arrhenius plot for the corrosion of X80 steel in 1 M and 15% HCl with and without different concentrations of 3CDA.
Conc (M)
1 M HCl
15% HCl
(kJmol−1)
(kJmol−1)
(kJmol−1)
(kJmol−1)
(kJmol−1)
(kJmol−1)
0
21.33
13.78
1.08
14.77
18.13
1.12
1 × 10⁻⁵
24.24
20.29
1.19
20.09
23.49
1.26
3 × 10⁻⁵
24.53
19.33
1.23
21.24
24.20
1.31
5 × 10⁻⁵
25.04
20.10
1.24
22.06
24.91
1.38
8 × 10⁻⁵
25.47
21.25
1.25
22.98
24.68
1.54
10 × 10−5
26.42
22.08
1.41
24.76
25.07
1.75
The corrosion rate data at different temperatures were also used to construct the transition state plot according to Eq. (14).
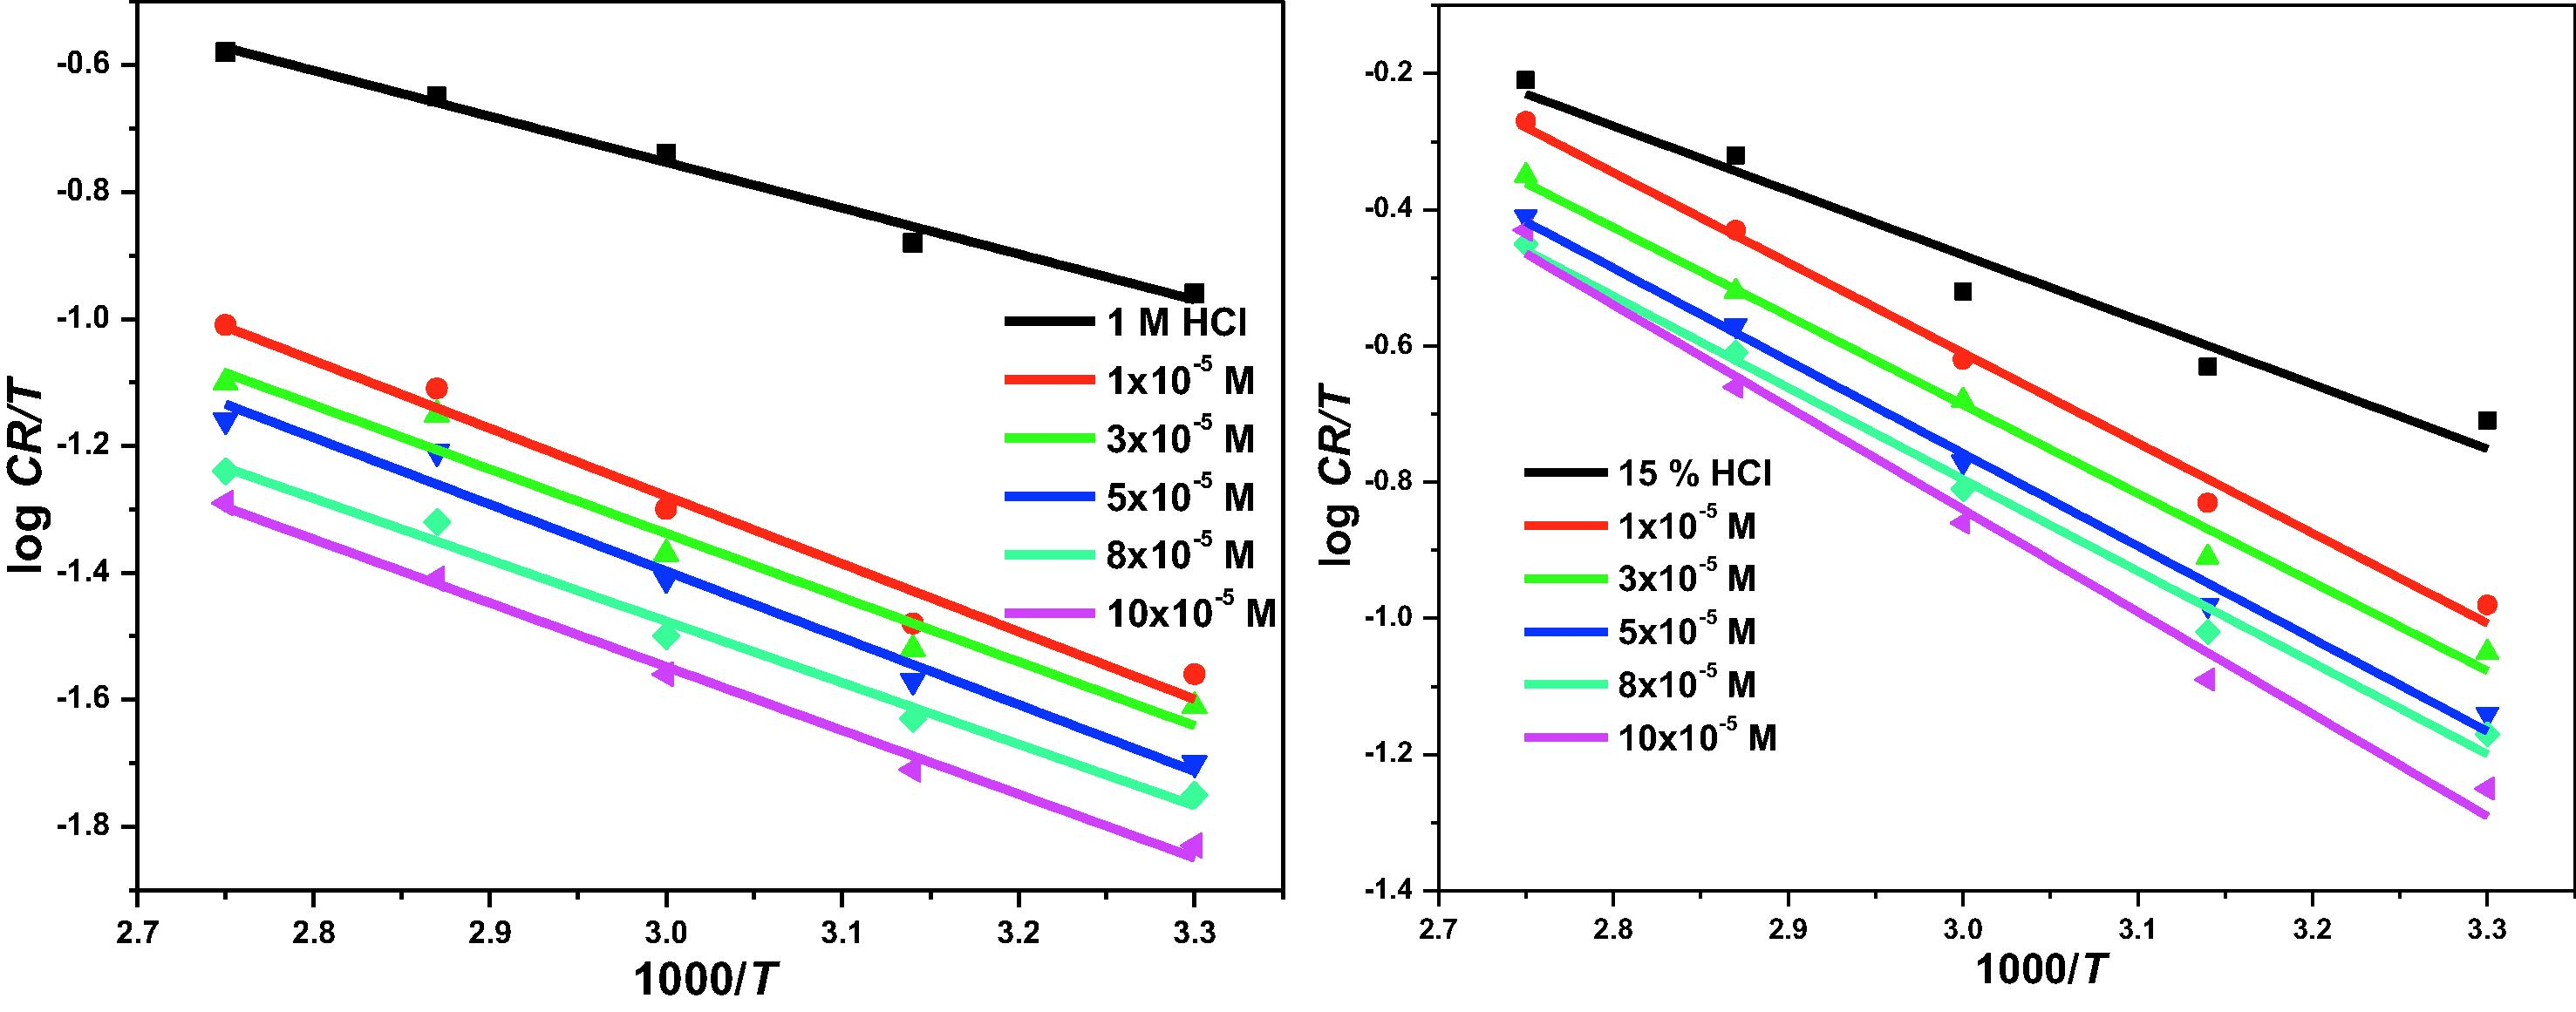
Transition state plot for the corrosion of X80 steel in 1 M and 15% HCl with and without different concentrations of 3CDA.
3.6 Electrochemical impedance spectroscopy
Some of the parameters obtained from analyses of EIS data using the equivalent circuit model embedded in Fig.5 are shown in Table 6. The curves in the Nyquist plot (Fig. 5) are all depressed and imperfectly semicircular in shape. They also have their centers under the real impedance axis. This can be due to surface heterogeneity, roughness of the electrode at microscopic level and adsorption of inhibitor on it (Umoren, 2016). Similarity in shape of the curves observed with all the test solutions indicates that the corrosion mechanism is the same regardless of the influence of inhibitor. Rather, the presence of the inhibitor influences the sizes of the diameters of the curves. The highest diameter is obtained with 10 × 10−5 M 3CDAand gradually decreases as 3CDA concentration decreases, till the lowest is obtained with the free acid. This indicates that addition of 3CDA influences the corrosion rate of the steel by inhibition. The influence can be regarded as being concentration dependent since the diameters increase with increase in 3CDA concentration. This trend is also consistent with the trend of charge transfer resistance values and the corresponding inhibition efficiency calculated.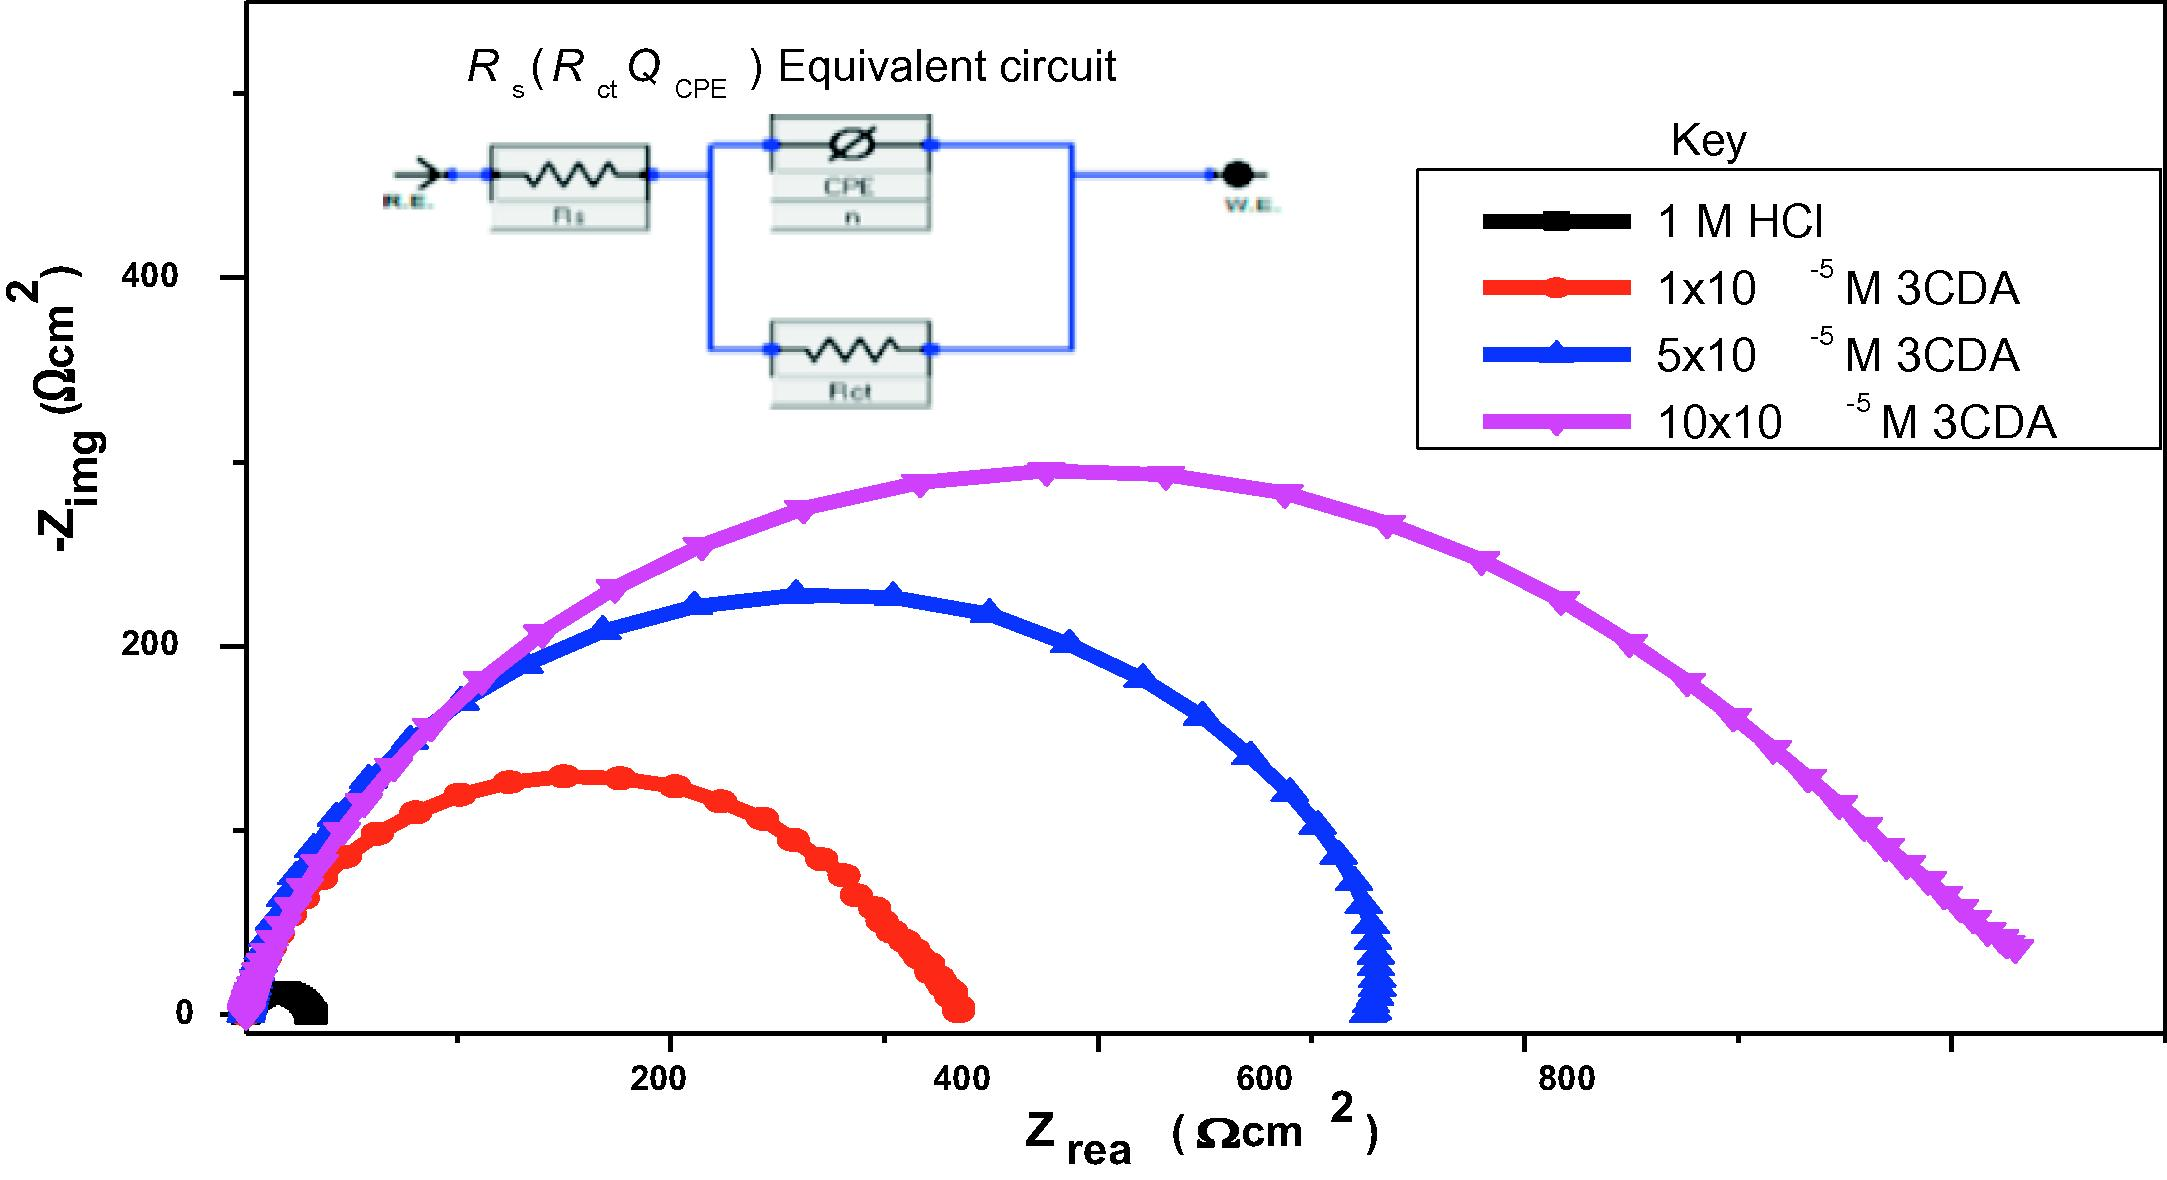
Nyquist plot for (and equivalent circuit used in analyses of) corrosion of X80 steel in 1 M HCl without and with different concentration of 3CDA.
Solution concentration
(%)
1 M HCl
31.8
1.063
206.4
0.787
12.6
–
1 × 10⁻⁵ M 3CDA
339.7
1.005
193.7
0.803
8.4
90.6
5 × 10⁻⁵ M 3CDA
531.1
0.921
127.6
0.813
4.2
94.0
10 × 10−5 M 3CDA
857.6
1.001
115.4
0.812
1.6
96.3
Increase in 3CDA concentration increases charge transfer resistance, and hence, inhibitive effect. At the metal-solution interface, an adsorbed layer of 3CDA molecules is formed. As inhibitor concentration increases, this adsorbed layer increases in thickness or may be more than one molecule thick (multilayer). The electrical double layer that is formed was considered as a capacitor and its capacitive response was estimated in each solution. Double layer capacitance ( ) computed for each of the systems decreases as inhibitor concentration increases due to adsorption. This implies that an ad sorbed film of 3CDA molecules is formed and this results in increases the local dielectric at the interface resulting in decreased capacitive response (Jokar et al., 2016). The values of n obtained are higher in the inhibited than free acid solution which indicates that addition of 3CDA reduces surface roughness of the electrode because of its adsorption and formation of protective film (Umoren, 2016).
3.7 Potentiodynamic polarization
Data obtained from potentiodynamic polarization (PDP) measurements were used to construct Tafel plot which is shown in Fig. 6. The corrosion potential (
) and the corresponding corrosion current density (
) were deduced from the plots and listed in Table 7. Also, Tafel anodic slope constant (
), Tafel cathodic slope constants (
) and inhibition efficiency (
) were calculated and listed in Table 7. The
values obtained in the presence of the inhibitor are more positive than that of the free acid solution. This implies that the inhibitor has influence on anodic half reaction by suppressing the oxidation or corrosion of iron. In literature, when the shift in
values is up to −85 mV, the inhibitor is classified as anodic or cathodic type inhibitor (Prajila et al., 2017). The shift in
values obtained for 3CDAis −19 mV indicating that 3CDA acts as a mixed type inhibitor with anodic predominance [38]. This inference is also supported by the trend of values of and
: there is higher deviations of
in the presence of 3CDA than
, showing anodic predominance. Lower concentration dependent corrosion current densities were obtained in the presence of 3CDA than in the free acid solution. This demonstrates that adsorption of the inhibitor on the steel at the interface reduces corrosion current. The inhibition efficiencies obtained using the
values increase as 3CDA concentration increases, and are comparable to EIS results.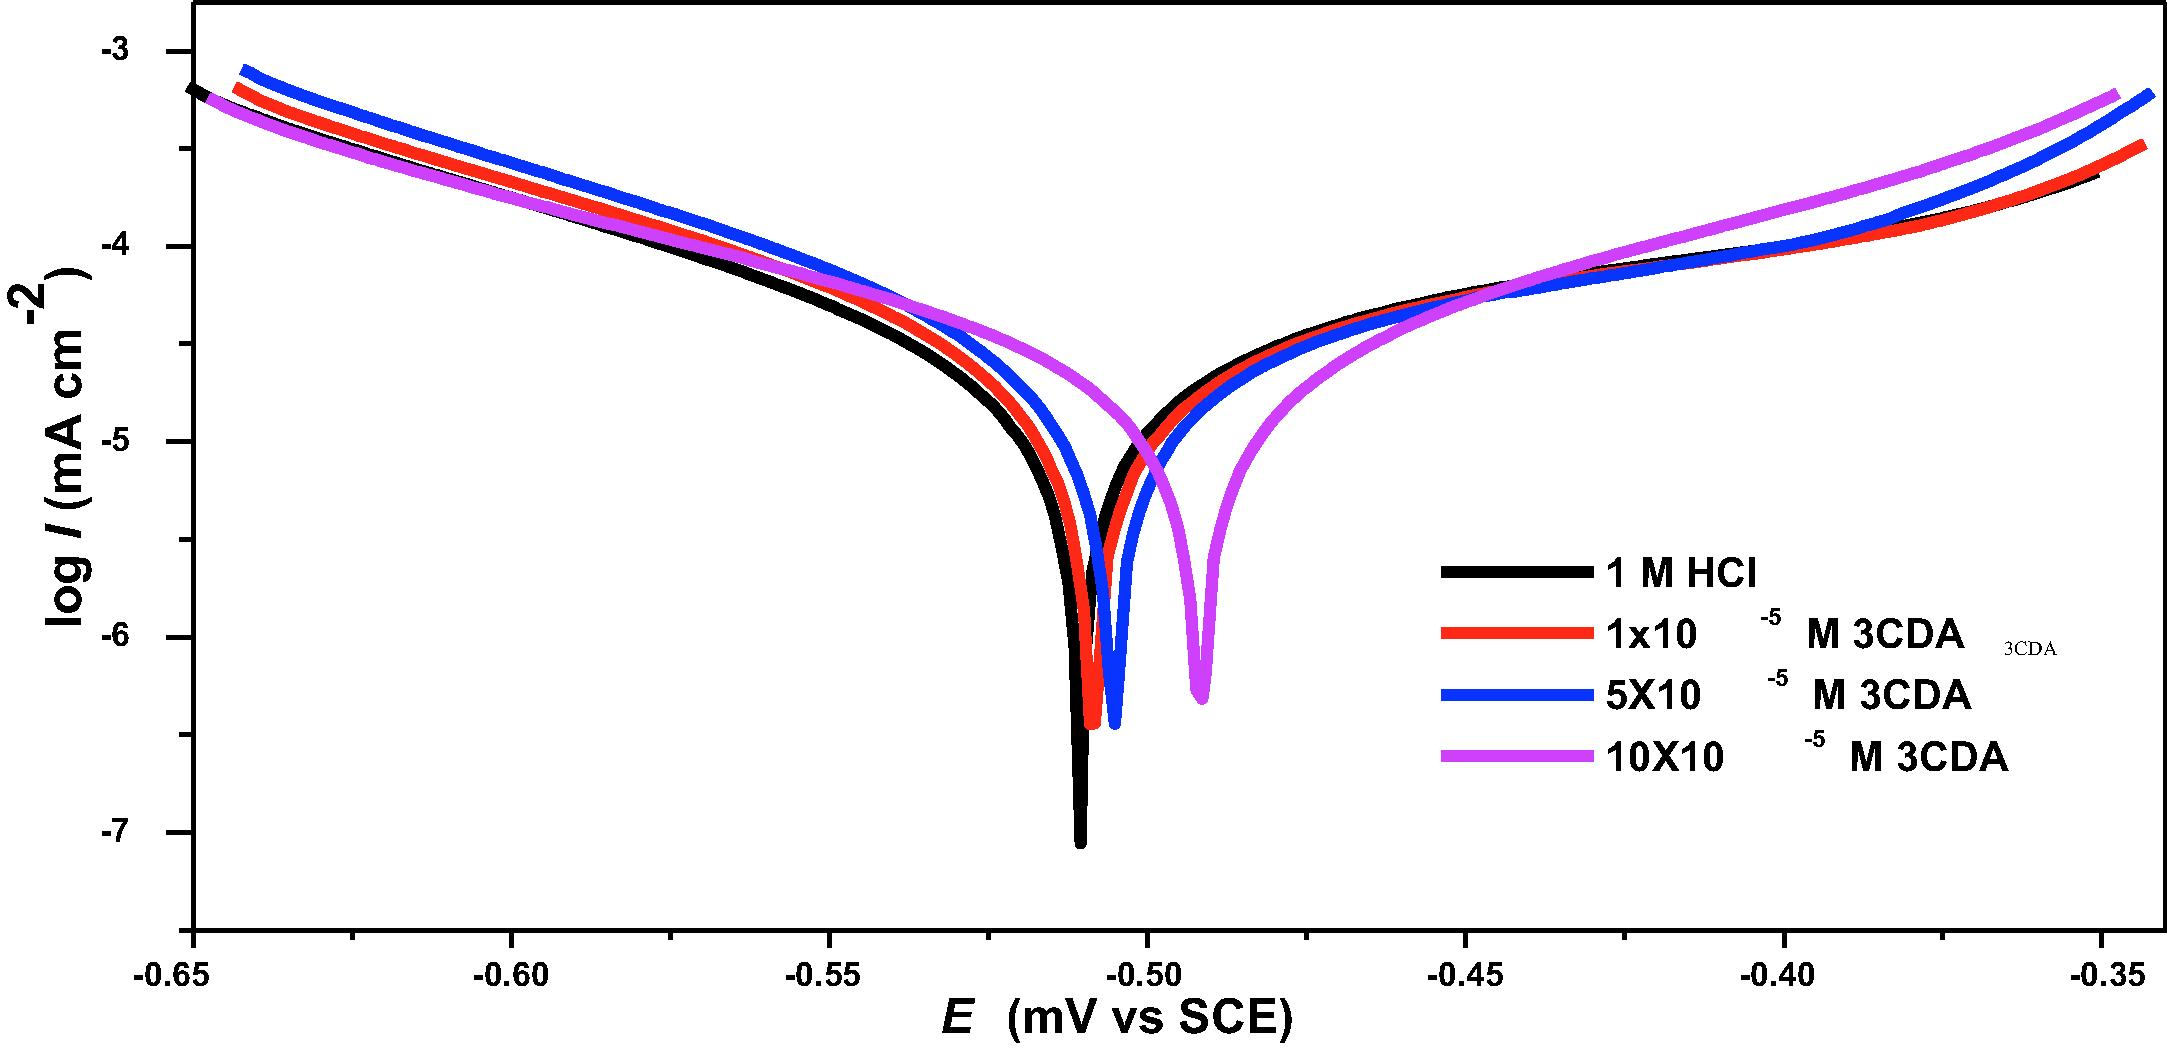
Tafel plots for the inhibition of X80 steel corrosion using different concentrations of CLO.
Solution Concentration
(mV/SCE)
(μA cm−2)
(mV dec−1)
(mV dec−1)
(%)
1 M HCl
−510
693.7
82.10
98.5
–
1 × 10⁻⁵ M 3CDA
−508
57.3
120.6
104.6
91.7
5 × 10⁻⁵ M 3CDA
−503
42.6
173.4
108.5
93.4
10 × 10−5 M 3CDA
−491
31.0
189.1
109.4
94.4
3.8 Functionality analyses
It is generally accepted that most corrosion inhibitors function by adsorption on the metal surface by means of their active functionalities. The active sites in 3CDA responsible for adsorption on X80 steel surface was probed using FTIR spectroscopy. Results show that some peaks were very prominent in the spectra of the pure 3CDA but became less prominent or disappeared in the spectra of the corrosion product. Such peaks may have been involved in the adsorption process at the metal-solution interface. As may be seen from Fig. 7, the peak around 1450 cm−1 can be assigned to –NR2 where R is a -CH3 group. Also, the peak around 1610 cm−1 can be assigned to the aromatic rings. These functional groups can be found in the molecular structure of 3CDA as embedded in Fig. 7, implying that they may have been involved in the adsorption process, similar to predictions reported in literature (Anbarasi and Rajendran, 2014; Campbell and Jovancicevic, 1999).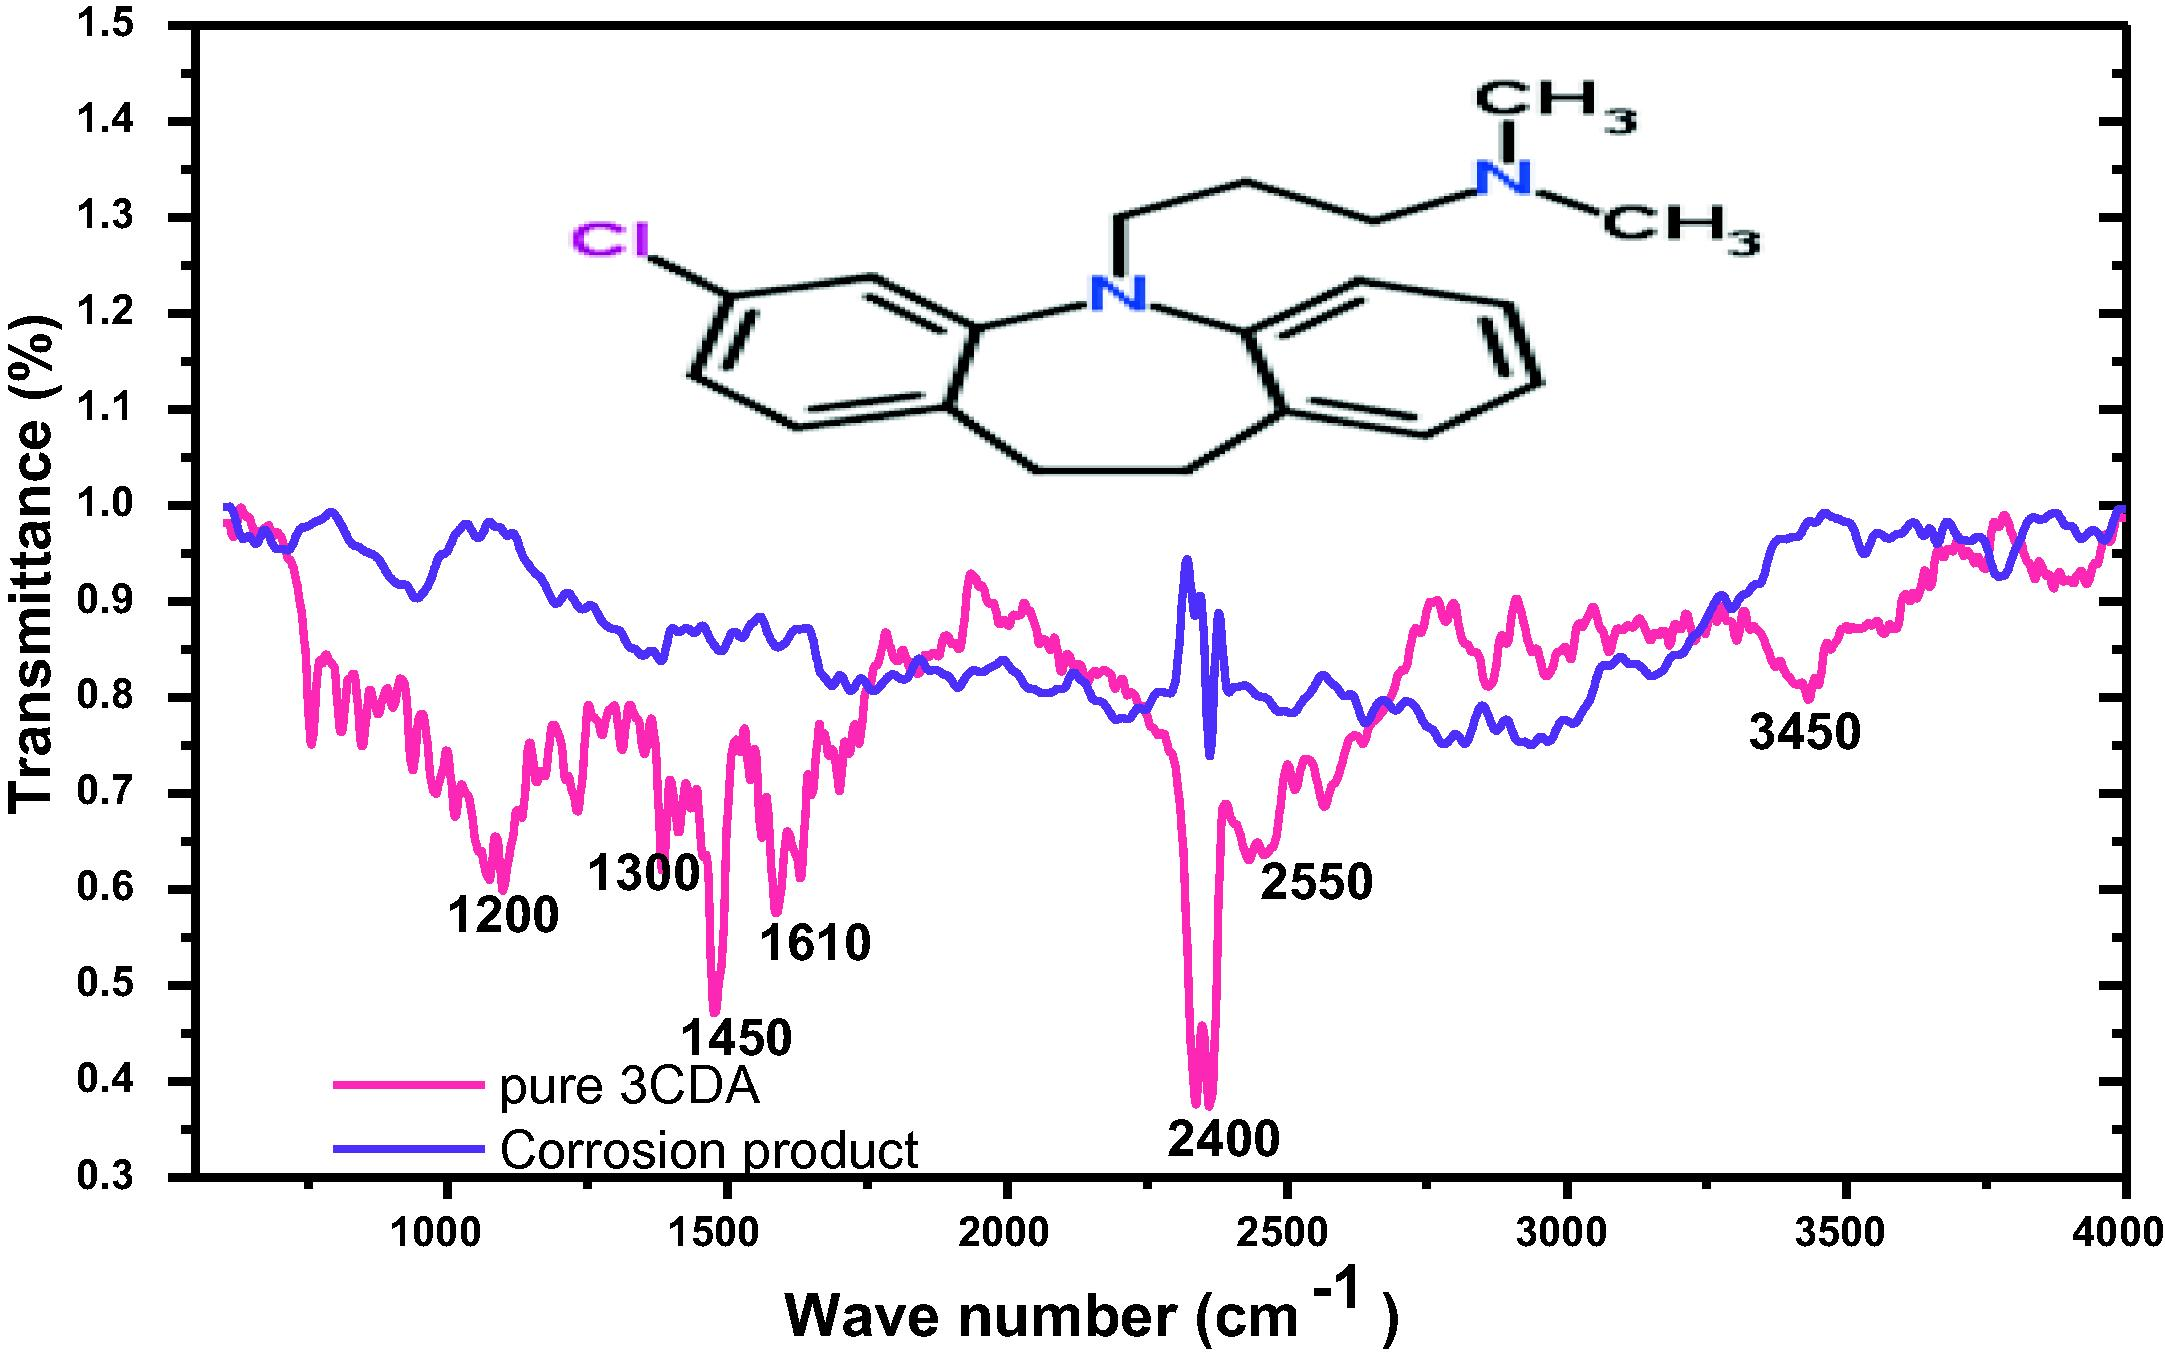
FTIR profile of 3CDA and corrosion product showing lost peaks after adsorption.
3.9 Surface morphological studies
Adsorption of corrosion inhibitors could result in the formation of thin protective film on the metal surface. Thus, micrographs of the surface of the metal scanned at high magnification are usually smoother in the presence of inhibitor than in the free acid solution (Alaneme et al., 2016). Therefore, the surface of X80 steel was scanned using SEM after immersion in 1 M HCl solution and the acidic solution containing 10 × 10−5 M 3CDA. Results (Fig. 8) reveal that the micrograph of X80 surface in free acid was rough with pitting due to aggressive acid attack. In the presence of 3CDA, the surface roughness decreased and this can be attributed to protective effect of 3CDA. However, though the surface film is not very visibly seen, one can observe that the morphology in the presence of 3CDA is different (and smoother) than that of the free acid.
SEM micrographs of X80 surfaces in 1 M HCl (left) and 1 M HCl containing 10 × 10−5 M 3CDA (right) after 5 h of immersion.
4 Conclusion
From the results of the present study, 3-(2-chloro-5,6-dihydrobenzo[b][1]benzazepin-11-yl)-N,N-dimethylpropan-1-amine (3CDA) inhibits corrosion of X80 steel in 1 M and 15% HCl at temperatures not higher than 60 °C. NAG, KI, PEG and GLU added as intensifiers to 3CDA improves its efficiency from 88.9% to 90.1, 92.8, 96.4 and 98.3% in 1 M HCl and from 74.8% to 78.1, 88.6, 90.3 and 91.5% in 15% HCl respectively. Inhibition efficiency of 3CDA was highest (88.8%) at 10 × 10−5 M concentration at 30 °C and decreased as temperature decreased. 3CDA acts as mixed type inhibitor and interacts with X80 steel surface by means of both physical and chemical adsorption. Adsorption of 3CDA is facilitated by nitrogen sites as shown by EDAX studies. Blends of 3CDA can be applied in the filed as efficient corrosion inhibitors for minimally deep well acidizing in the petroleum industry.
References
- Adotey, A., 2009. Local production of 5-HTP from the seeds of griffonia simplicifolia (Doctoral dissertation).
- Principles of corrosion engineering and corrosion control. Butterworth-Heinemann; 2006.
- Geothermal gradients in the Niger Delta Basin from continuous temperature logs. Global J. Pure Appl. Sci.. 2003;9:265-272.
- [Google Scholar]
- Corrosion inhibition and adsorption mechanism studies of Hunteria umbellata seed husk extracts on mild steel immersed in acidic solutions. Alex. Eng. J.. 2016;55(1):673-681.
- [Google Scholar]
- Anbarasi, C.M., Rajendran, S., 2014. Surface Protection of Carbon Steel by Hexanesulphonic Acid-Zinc Ion System. ISRN Corros.
- Corrosion inhibition of steel in sulfuric acidic solution by the Chenopodium Ambrosioides Extracts. J. Asso. Arab Univ. Basic Appl. Sci.. 2014;16:83-90.
- [Google Scholar]
- Some amino acids as corrosion inhibitors for copper in nitric acid solution. Mater. Lett.. 2008;62:3325-3327.
- [Google Scholar]
- Campbell, S., Jovancicevic, V., 1999. Corrosion inhibitor film formation studied by ATR-FTIR (No. CONF-990401–). NACE International, Houston, TX (United States).
- Application of corrosion inhibitors for steels in acidic media for the oil and gas industry: a review. Corros. Sci.. 2014;86:17-41.
- [Google Scholar]
- Amino acids as environmentally-friendly corrosion inhibitors for Cu10Ni alloy in sulfide-polluted salt water: Experimental and theoretical study. Zaštita materijala. 2011;52:21-34.
- [Google Scholar]
- Metallurgy and Corrosion Control in Oil and Gas Production. Vol vol. 14. John Wiley & Sons; 2010.
- The effect of tinospora crispa extracts as a natural mild steel corrosion inhibitor in 1M HCl solution. Arab. J. Chem.. 2016;9:616-624.
- [Google Scholar]
- Evaluation of performance of corrosion inhibitors using adsorption isotherm models: an overview. Chem. Sci. Int. J.. 2017;18:1-34.
- [Google Scholar]
- Green anticorrosive oilfield chemicals from 5-hydroxytryptophan and synergistic additives for X80 steel surface protection in acidic well treatment fluids. J. Mol. Liq.. 2016;224:408-419.
- [Google Scholar]
- Green and sustainable local biomaterials for oilfield chemicals: Griffonia simplicifolia extract as steel corrosion inhibitor in hydrochloric acid. Sus. Mater. Technol.. 2016;11:12-18.
- [Google Scholar]
- Electrochemical and surface characterizations of morus alba pendula leaves extract (MAPLE) as a green corrosion inhibitor for steel in 1M HCl. J. Taiwan Inst. Chem. Eng.. 2016;63:436-452.
- [Google Scholar]
- Drug treatment of obsessive-compulsive disorder. Dialogues Clin. Neurosci.. 2010;12:187-197.
- [Google Scholar]
- Oil and gas pipeline fundamentals. Pennwell books; 1993.
- Kermani, M., Harr, D., 2008. The impact of corrosion on oil and gas industry. in Giornata di studio IGF S. Donato Milanese 1996.
- Effect of temperature on the inhibition of the acid corrosion of steel by benzimidazole derivatives. Protect. Metals Phys. Chem. Surf.. 2011;47:381-390.
- [Google Scholar]
- Significant factors for successful matrix acidizing. Soc. Pet. Eng. 1989 doi.org/10.2118/20155-MS
- [Google Scholar]
- Amino and polyamino acids as corrosion inhibitors for aluminium and zinc pigments. Pigm. Resin Technol.. 2002;31:84-87.
- [Google Scholar]
- N (1)-pentyl isatin-N (4)-methyl-N (4)-phenyl thiosemicarbazone (PITSc) as a corrosion inhibitor on mild steel in HCl. J. Alloys Compd.. 2017;695:171-182.
- [Google Scholar]
- Key issues related to modelling of internal corrosion of oil and gas pipelines–A review. Corros. Sci.. 2007;49:4308-4338.
- [Google Scholar]
- Effect of temperature on adsorption and corrosion inhibition characteristics of gelatin on mild steel in hydrochloric acid medium. Res. Chem. Interm.. 2016;42:4531-4549.
- [Google Scholar]
- Development of passive film and enhancement of corrosion protection of mild steel exposed in hydrochloric acid due to the adsorption of water dispersed 4-[(E)-(3, 4-dihydroxybenzylidene) amino]-6-methyl-3-mercapto-1, 2, 4-triazin-5 (4H)-one (DHMMT) J. Bio. Tribo. Corros.. 2017;3:16-26.
- [Google Scholar]
- Corrosion inhibition of Eleusine aegyptiaca and Croton rottleri leaf extracts on cast iron surface in 1M HCl medium. Appl. Surf. Sci.. 2014;314:537-545.
- [Google Scholar]
- Corrosion inhibition by amino acids-an over review. Eur. Chem. Bull.. 2012;15:470-476.
- [Google Scholar]
- Fluvoxamine and clomipramine in the treatment of cataplexy. J. Neurol. Neurosurg. Psychia. 1980;43:171-174.
- [Google Scholar]
- Siciliano, F., Stalheim, D.G., Gray, J.M., 2008. Modern high strength steels for oil and gas transmission pipelines. in 2008 7th International Pipeline Conference. American Society of Mechanical Engineers.
- Control of corrosion in oil and gas production tubing. Br. Corros. J.. 1999;1999(34):247-253.
- [Google Scholar]
- Ueda, M., Takabe, H., Nice, P.I., 2000. The development and implementation of a new alloyed steel for oil and gas production wells. in CORROSION 2000. NACE International.
- Polypropylene glycol: A novel corrosion inhibitor for ×60 pipeline steel in 15% HCl solution. J. Mol. Liq.. 2016;219:946-958.
- [Google Scholar]
- Possibilities of using X80, X100, X120 high-strength steels for onshore gas transmission pipelines. J. Nat. Gas Sci. Eng.. 2015;27:374-384.
- [Google Scholar]


