

Translate this page into:
Influence of salinity stress on PSII in barley (Hordeum vulgare L.) genotypes, probed by chlorophyll-a fluorescence
⁎Corresponding authors at: Botany and Microbiology Department, College of Science, King Saud University, Riyadh, Saudi Arabia (P. Ahmad). Institute of Pure and Applied Biology, Bahauddin Zakariya University, Multan, Pakistan (S. Noreen). sibgha_noreen@yahoo.com (Sibgha Noreen), parvaizbot@yahoo.com (Parvaiz Ahmad)
-
Received: ,
Accepted: ,
This article was originally published by Elsevier and was migrated to Scientific Scholar after the change of Publisher.
Peer review under responsibility of King Saud University.
Abstract
Objectives
Chlorophyll-a fluorescence is an efficient tool to determine the photosynthetic capacity of plants and the health status of plants under normal or stress conditions including salinity stress. This study was aimed to elucidate changes in the efficiency of photosystem II (PSII) in barley genotypes differing in degree of salt tolerance, which can be used for phenotyping in the breeding program for developing salt-tolerant cultivars.
Methodology
Twelve barley (Hordeum vulgare L.) genotypes were subjected to salt stress and salt stress reduced the growth of all barley genotypes, which is associated with a decline in chlorophyll and K+ contents (roots and leaves) and increase in Na+. Of the 12 barley genotypes, one salt-tolerant (B-10008) and one salt-sensitive barley genotype (B-14011) was selected to further investigate the structural stability of PSII using fast chlorophyll a kinetic analysis under salinity stress.
Results
The shape of OJIP transients changed due to salt stress in both salt-sensitive and salt-tolerant barley genotypes indicating a disturbance in structural stability at various points of PSII. The detailed analysis of JIP-test parameters suggested that salt stress caused photoinhibition of PSII due to enhanced inactive reaction centers, reduced absorption flux (ABS/RC), low transfer of electrons per reaction center (ETO/RC) and enhanced accumulation of QA¯ (VJ) thus reducing primary photochemistry (TRO/RC, ɸPO). These changes in PSII resulted in the reduction of the maximum quantum yield of PSII (Fv/Fm) and performance index (PIABS). Moreover, salinity stress enhanced dissipation energy flux per reaction center (DIO/RC) as a protective measure to save PSII from photooxidative damage in thylakoid membrane.
Conclusion
The appearance of positive K and L-bands supported the idea that salt stress dissociated the light-harvesting complex from core proteins of PSII, damaged oxygen-evolving complex and reduced the structural stability of PSII by disturbing the electron transfer between acceptor and donor sides of PSII especially in salt sensitive genotype (B-14011). Moreover, such an adverse effect of salt stress on PSII was less in salt-tolerant barley genotype (B-10008). Thus, some JIP-test parameters can be used as potential phenotype marker for screening salt-tolerant genotypes.
Keywords
Salinity
Barley
Chlorophyll-a fluorescence
Performance index
JIP test

1 Introduction
Photosynthesis is one of the most basic physiological and biochemical process of plant’s growth and productivity, but it is severely affected by soil salinity (Isayenkov and Maathuis, 2019; Majeed and Muhammad, 2019). Salt stress causes the excessive uptake of Na+ from root zone which creates osmotic and water stress to plants (Arif et al., 2020). Na+ toxicity limits the uptake of other nutrients (K+, Ca2+, P, N) (Rehman et al., 2019), triggering disruption in biochemical, physiological and molecular activities of cell (Shahid et al., 2020). Salinity stress also reduces leaf water and osmotic potential with a concurrent increase in osmotic stress (Betzen et al., 2019; Cambridge et al., 2017) resulting into production of reactive oxygen species (ROS) like singlet oxygen (1O2), superoxide (O2−), hydrogen peroxide (H2O2) and hydroxyl radicles (OH−) especially in the chloroplast and mitochondria (Ahammed et al., 2018; Li et al., 2019; Siddiqui et al., 2020; Yi et al., 2018). This salinity induced oxidative stress leads to the reduction in PSII activity by damaging reaction centers of photosystem II (PSII), oxygen evolving complex and reducing activity of quinine acceptor (Betzen et al., 2019; Kalaji et al., 2018).
Plant responses to salt stress depend on PSII activity and biochemical changes around PSII such as activation of xanthophyll cycle to dissipate excessive heat energy (Kalaji et al., 2018), accumulation of osmoprotectants such as glycinebetaine, proline to stabilize PSII (Zhang and Dai, 2019), and accumulation of antioxidants such as ascorbic acid as an alternative electron donor (Bose et al., 2017; Ogbaga et al., 2018). PSII, multi-subunit protein-pigment complex, is highly sensitive to salt stress (Messedi et al., 2016). Among protein complexes of PSII, D1 protein is a key target of salt-induced ROS thereby resulting in photo-inhibition of PSII (Asrar et al., 2017). Moreover, salt-induced ROS also inhibits the repair cycle of D1 protein (Bose et al., 2017). Various studies suggested that salt-tolerant plants or salt-tolerant cultivars of the same species had greater PSII stability and activity which can be used as non-destructive phenotyping techniques in the breeding program (Bose et al., 2017; Iqbal et al., 2019). However, it is not yet clear that genotypes/cultivars differing in salinity tolerance use the common mechanism of salt tolerance.
The efficiency of PSII in plants can be detected by chlorophyll-a fluorescence (OJIP), a steadfast and non-destructive method, to monitor the physiological activity of photosynthetic machinery (Guidi et al., 2019). It also gives some valuable information about energy transfer during photosynthetic process (Kalaji et al., 2017). The name OJIP refers to the intermediate steps, starting with minimal fluorescence ‘O’ to maximum fluorescence ‘P’ with ‘J’ and ‘I’ are intermediate steps. The O-J part of the fluorescence curve represents primary electron acceptor (QA) reduction phase; J-I part represents the transport of electrons from QA (primary electron acceptor) to QB (secondary electron acceptor) and ultimately to plastocyanin (PC) through intermediate electron carriers plastoquinone (PQ) and cytochrome complex (Cyt b6f). Finally, the I-P part of the fluorescence curve represents the reduction of the final electron acceptor at PSI (Çiçek et al., 2017).
The ‘JIP’ test, based on chlorophyll-a fluorescence, is used to evaluate the response of photosynthetic apparatus to different abiotic stresses (Rastogi et al., 2020a). This test offers an enough data to understand the structure and function of PSII and the possible flow of electron in thylakoid membranes (Kalaji et al., 2011a). The ‘JIP’ test can be used to calculate some important parameters like energy fluxes absorbed (ABS/RC) and trapped (TRo/RC) per reaction center (RC), primary photochemistry (ψo), electron transport rate (ETo/RC), non-photochemical quenching for energy dissipation (DIo/RC), efficiency of donation electron to PSI (Fv/Fo), maximum quantum yield of PSII (Fv/Fm) and performance index on absorption basis (PIABS) (Küpper et al., 2019).
From the above-mentioned reports, PSII responses to salt stress in two barley genotypes differing in salt tolerance using fast chlorophyll a kinetic analysis were assessed. In this study, the first 12 barley genotypes were screened for salt tolerance using physiological attributes and subsequently OJIP analysis of two genotypes of barley was carried out.
2 Materials and methods
This study was conducted to evaluate the influence of salinity stress on PSII of barley (Hordeum vulgare L.) genotypes. The experiment was conducted at the Botanic Gardens, Bahauddin Zakariya University, Multan in complete randomize design (CDR). Twelve barley genotypes (B-5011, B-9006, B-9008, B-10008, B-14011, B-15005, H-93, Jou-83, Jou-87, 14003, 15,002 and 15003) were sown in plastic pots filled with thoroughly washed 10 kg sand. Ten days after complete germination salt stress (200 mM NaCl) was gradually applied to half of the plants as others remained as control. The plants were regularly irrigated with full strength Hoagland’s Nutrient solution (Hoagland and Arnon, 1950) to fulfill nutritional requirements. The morphological attributes (biomass accumulation, shoot and root lengths), ionic contents (Na+ and K+) and photosynthetic pigments (chlorophyll-a, b and total) were examined in these barley genotypes for the screening of one salt-tolerant and one salt-sensitive genotype. While chlorophyll-a fluorescence attributes were studied only in selected barley genotypes (B-10008 and B-14011).
2.1 Chlorophyll contents
Photosynthetic pigments (chlorophyll-a, -b and total) were estimated following Arnon (1949) method. 0.1 g fresh leaf samples were grounded with 5 ml of 80%. Grounded material was centrifuged for 10,000 rpm for five minutes. The supernatant was used to measure the absorbance of samples at 645 nm and 663 nm using a spectrophotometer (U-2900).
2.2 Ionic (Na+ and K+) contents
The determination of Na+ and K+ contents were done in roots and leaves of each barley genotype. The oven-dried plant material (0.1 g) was digested indigestion mixture (Se, LiSO4·2H2O and H2O2) at 350 °C on hot plate. The diluted (50 ml) solution is used for the determination of Na+ and K+ contents in plant samples through flame photometer.
2.3 Chlorophyll-a fluorescence (OJIP)
Chlorophyll-a fluorescence (OJIP) transients were recorded from middle of fully expended leaf (2nd from top) after continuous maintenance of salt stress for eight days, using portable Fluor pen-100. Before taking readings, the leaves were covered with aluminum foils for 30 min to ensure closure of almost all reaction centers of PSII. As all the photosynthetic reaction centers were probably at ground state (closed), then supposedly, electron transport chain was also at relaxed state. It ensures the complete oxidation of QA, QB and PQ pool behind PSII reaction centers. The dark-adapted leaves were exposed to strong actinic light (3000 µmol photons/m2s1) and fluorescence was recorded form 20 µs to 2 s. The raw data of OJIP transient were plotted on log time scale. Structural and functional changes in PSII via various biophysical and phenomenological energy fluxes, of barley genotypes, under normal and saline conditions, were worked out from fluorescence data (Table 1).
Terms
Description
Reference
Fo
Minimum fluorescence at 20 µs (all RCs are supposed to be opened)
(Stirbet and Govindjee, 2011)
Fj
Fluorescence intensity at 2 ms at J phase of OJIP
(Strasser et al., 2000)
Fi
Fluorescence intensity at 30 ms at I phase of OJIP
Fm
Maximum fluorescence intensity at P phase of OJIP (maximum RCs are supposed to be closed)
Fv
Variable fluorescence (Fm-Fo)
Fv/Fo
Efficiency of electron donation to PSII
(Mohammed et al., 1995)
Fv/Fm
Maximum quantum yield of PSII
(Strasser et al., 2000)
N
Maximum turn-overs of QA reduction until Fm was reached
Mo
Maximum rate of accumulation of closed reaction centers
(Strasser et al., 2004)
ABS/RC
Absorption per reaction center at PSII / Ratio of active reaction centers in PSII
(Clark et al., 2000)
TRo/RC
Trapped energy flux per reaction center (t = 0)
(Force et al., 2003; Perboni et al., 2012)
ETo/RC
Electron transport flux per reaction center (t = 0)
DIo/RC
Dissipation energy flux per reaction center (t = 0)
ΦDO
Quantum yield of energy dissipated
ΦPO
Maximum quantum yield of primary photochemistry (t = 0)
(Appenroth et al., 2001)
ΦEo
Quantum yield of electron transported to ETC beyond QA
(Pandey and Yeo, 2008)
Ψo
Probability that trapped electron was transferred to ETC beyond QA
(Appenroth et al., 2001)
PIAbS
Performance index on absorption basis
(Appenroth et al., 2001; Mathur et al., 2011)
The chlorophyll-a fluorescence transients were double normalized between FO (20 µs) and FK (300 µs) and were expressed as VOK [VOK = {(Ft − FO) / (FK − FO)}] to understand the probability of fluorescence rise at K step (300 µs). While the kinetic differences between saline and non-saline transients of this phase were expressed as ΔVOK or L-band (ΔVOK). The transients were double normalized between FO (20 µs) and FJ (2000 µs) and were expressed as VOJ [VOJ = {(Ft − FO) / (FJ − FO)}] and the kinetic difference between saline and non-saline transients were expressed as K-band (ΔVOJ). Moreover, the fluorescence transients were double normalized between ‘O’ (FO) and ‘P’ (FP) and difference between double normalized saline and non-saline barley plants were calculated and expressed as VOP [VOP = (Ft − FO)/(FP − FO)]. Furthermore, to understand the changes in O-I phase fluorescence data was double normalized between FO (20 µs) and FI (<1 s) and were expressed as VOI [(VOI = (Ft − FO)/(FI − FO)], while the changes in I-P phase were determined by double normalizing the fluorescence data between FI (20 µs) and FP (200 ms) expressed as VIP [(VIP = (Ft − FO)/(FP − FO)].
3 Statistical analysis
The recorded data of twelve barley genotypes grown at two salinity levels was subjected to two-way analysis of variance (ANOVA) using SPSS-16.0 statistical package (SPSS Inc. Chicago, IL, USA). Statistical significance difference at 5% level (P < 0.05) among barley genotypes was estimated by Duncan’s Multiple Range Test (DMRT).
4 Results
4.1 Plant growth
Analysis of variance (ANOVA) of the data regarding different morphological attributes (fresh and dry weights, shoot and root lengths) displayed a highly significant (p < 0.001) reduction at 200 mM NaCl salinity stress. Plant fresh weights and dry weights were reduced remarkably from 20% to 77.8% and from 18.8% to 75.8% respectively under salt stress. Similarly, shoot lengths and root lengths were decreased from 20.4% to 66.5% and from 10.1% to 44.5% respectively Overall genotype “B-10008” showed better accumulation of biomass and plant height while “B-14011” was the lowest in maintaining growth with respect to all other genotypes (Table 2). Values are means of salt treatments (0 and 200 mM) with n = 3 replicates of each treatment. Different letters represent statistical significance difference estimated by Duncan’s Multiple Range Test (DMRT) among barley genotypes (P < 0.05). ***= Significance level at 0.001, **= Significance level at 0.01, ns = non-Significant.
Genotypes
Plant fresh weights (g)
Plant dry weights (g)
Shoot lengths (cm)
Root lengths (cm)
Control
200 mM NaCl
Control
200 mM NaCl
Control
200 mM NaCl
Control
200 mM NaCl
B-5011
8.89 ± 0.48 cd
2.39 ± 0.39 g
0.89 ± 0.05 cd
0.27 ± 0.05e
33.33 ± 1.83bcd
13.37 ± 1.23 cd
9.60 ± 0.72de
5.17 ± 0.19de
B-9006
12.90 ± 0.20b
9.38 ± 0.32bc
1.33 ± 0.04b
0.99 ± 0.07b
48.43 ± 0.92a
37.00 ± 4.54a
12.85 ± 0.86b
10.13 ± 0.63b
B-9008
8.74 ± 0.39 cd
3.46 ± 0.17f
0.88 ± 0.04 cd
0.42 ± 0.08d
27.37 ± 1.67ef
13.13 ± 1.39 cd
10.13 ± 0.09 cd
8.10 ± 0.64c
B-10008
14.86 ± 0.43a
11.85 ± 0.35a
1.49 ± 0.02a
1.27 ± 0.05a
48.93 ± 0.73a
38.93 ± 2.10a
14.83 ± 0.22a
12.10 ± 0.49a
B-14011
6.18 ± 0.40e
1.37 ± 0.12 h
0.61 ± 0.04e
0.15 ± 0.01e
25.55 ± 1.56f
8.57 ± 0.81d
6.10 ± 0.40 g
2.60 ± 0.40f
B-15005
8.72 ± 0.32 cd
5.71 ± 0.26d
0.86 ± 0.04 cd
0.67 ± 0.03c
35.07 ± 1.45bcd
18.93 ± 0.82bc
9.77 ± 0.27de
6.30 ± 0.32d
H-93
9.69 ± 0.33c
4.72 ± 0.26e
0.96 ± 0.03c
0.47 ± 0.03d
37.60 ± 1.17b
22.70 ± 1.13b
11.33 ± 0.33bc
9.00 ± 0.70bc
Jou-83
12.72 ± 0.76b
10.15 ± 0.10b
1.33 ± 0.05b
1.02 ± 0.04b
51.67 ± 0.78a
39.33 ± 2.19a
12.25 ± 0.58b
9.33 ± 0.61bc
Jou-87
8.02 ± 0.44d
2.7 ± 0.26 fg
0.81 ± 0.05d
0.28 ± 0.02e
32.53 ± 1.55 cd
12.73 ± 1.18 cd
9.02 ± 0.74def
5.00 ± 0.32de
14,003
12.13 ± 0.12b
8.62 ± 0.35c
1.28 ± 0.03b
1.04 ± 0.05b
47.40 ± 1.13a
35.37 ± 1.73a
12.17 ± 0.50b
9.37 ± 0.41bc
15,002
7.87 ± 0.31d
2.54 ± 0.50 fg
0.80 ± 0.02d
0.26 ± 0.05e
31.43 ± 2.07de
11.38 ± 1.57d
7.63 ± 0.13f
3.93 ± 0.23ef
15,003
9.69 ± 0.44c
4.50 ± 0.40e
0.99 ± 0.07c
0.46 ± 0.04d
36.50 ± 2.10bc
13.00 ± 1.45 cd
8.37 ± 0.19ef
4.00 ± 0.12ef
SOV
Df
Genotypes (G)
11
54.24***
0.617***
652.97***
43.79***
Salt (S)
1
315.08***
3.02***
4477.65***
190.35***
G × S
11
2.28***
0.031**
26.47**
0.918 ns
Error
48
0.403
0.006
0.698
0.676
4.2 Photosynthetic pigments (Chlorophyll contents)
Photosynthetic pigments (chlorophyll-a, -b and total) were highly significantly (p < 0.001) affected at 200 mM NaCl stress. The imposition of NaCl to growing media caused a reduction in Chlorophyll-a contents from 14% to 41%, chlorophyll-b contents were reduced from 12%, to 46.8% and similarly, total chlorophyll contents were decreased from 10.3% to 50.3% respectively. Contrary to the reduction in chlorophyll-b contents were enhanced to 19.4% in H-93 and 13.2% in Jou-83 (Table 3). Values are means of salt treatments (0 and 200 mM) with n = 3 replicates of each treatment. Different letters represent statistical significance difference estimated by Duncan’s Multiple Range Test (DMRT) among barley genotypes (P < 0.05). ***= Significance level at 0.001, **= Significance level at 0.01.
Genotypes
Chlorophyll-a (mg 10ml1− f.wt.)
Chlorophyll-b (mg 10ml1− f.wt.)
Total chlorophyll (mg 10ml1− f.wt.)
Control
200 mM NaCl
Control
200 mM NaCl
Control
200 mM NaCl
B-5011
0.0128 ± 0.0002b
0.0104 ± 0.0002 cd
0.0045 ± 0.0002ab
0.0034 ± 0.0001bc
0.0156 ± 0.0011de
0.0117 ± 0.0009ef
B-9006
0.0125 ± 0.0001b
0.0106 ± 0.0005 cd
0.0050 ± 0.0001ab
0.0044 ± 0.0004a
0.0186 ± 0.0005abc
0.0154 ± 0.0002abc
B-9008
0.0148 ± 0.0004a
0.0110 ± 0.0003c
0.0051 ± 0.0001a
0.0038 ± 0.0002ab
0.0179 ± 0.0004bc
0.0140 ± 0.0005 cd
B-10008
0.0153 ± 0.0005a
0.0131 ± 0.0001a
0.0050 ± 0.0001ab
0.0041 ± 0.0002ab
0.0196 ± 0.0004a
0.0160 ± 0.0005ab
B-14011
0.0101 ± 0.0006c
0.0059 ± 0.0001 h
0.0038 ± 0.0003c
0.0023 ± 0.0001d
0.0132 ± 0.0004f
0.0066 ± 0.0004 g
B-15005
0.0130 ± 0.0001b
0.0097 ± 0.0001d
0.0046 ± 0.0002ab
0.0027 ± 0.0001 cd
0.0170 ± 0.0008 cd
0.0114 ± 0.0008ef
H-93
0.0106 ± 0.0001c
0.0075 ± 0.0004 fg
0.0029 ± 0.0001d
0.0035 ± 0.0001b
0.0154 ± 0.0005e
0.0138 ± 0.0009 cd
Jou-83
0.0153 ± 0.0003a
0.0129 ± 0.0002ab
0.0035 ± 0.0003c
0.0040 ± 0.0001ab
0.0188 ± 0.0001ab
0.0168 ± 0.0005a
Jou-87
0.0134 ± 0.0005b
0.0083 ± 0.0005ef
0.0045 ± 0.0002ab
0.0033 ± 0.0001bc
0.0174 ± 0.0006bc
0.0129 ± 0.0007de
14,003
0.0146 ± 0.0002a
0.0120 ± 0.0003b
0.0047 ± 0.0002ab
0.0039 ± 0.0001ab
0.0198 ± 0.0002a
0.0143 ± 0.0003bcd
15,002
0.0103 ± 0.0004c
0.0071 ± 0.0003 g
0.0044 ± 0.0002b
0.0023 ± 0.0003d
0.0140 ± 0.0003ef
0.0075 ± 0.0003 g
15,003
0.0109 ± 0.0005c
0.0087 ± 0.0002e
0.0035 ± 0.0002c
0.0025 ± 0.0004d
0.0143 ± 0.0002ef
0.0106 ± 0.0006f
SOV
df
Genotypes (G)
11
2.62 × 10⁻⁵***
2.04 × 10⁻⁶***
4.19 × 10⁻⁵***
Salt (S)
1
1.45 × 10⁻⁴***
1.58 × 10⁻⁵***
3.18 × 10⁻⁴***
G × S
11
1.44 × 10⁻⁶**
9.55 × 10⁻⁷***
2.890 × 10⁻⁶***
Error
48
3.34 × 10⁻⁷
1.29 × 10⁻⁷
9.26 × 10⁻⁷
4.3 Root and leaf ionic contents (Na+ and K+)
The root and leaf K+ contents were prominently decreased due at 200 mM NaCl. Lowest decrease (47%) in root and leaf (23%) K+ contents were observed in genotype (B-10008) at 200 mM NaCl while at this salinity level 75% decrease in root K+ contents was observed in “H-93” and 67% decrease was observed in “B-14011” (Fig. 1). The imposition of salinity in growing media dramatically enhanced Na+ contents and decreased K+ contents in roots and leaves. Root Na+ contents were enhanced from 265% (B-9008) to 969% (H-93) while the accumulation of Na+ in leaves were enhanced form 444% (B-10008) to 1083% (B-14011) (Fig. 2).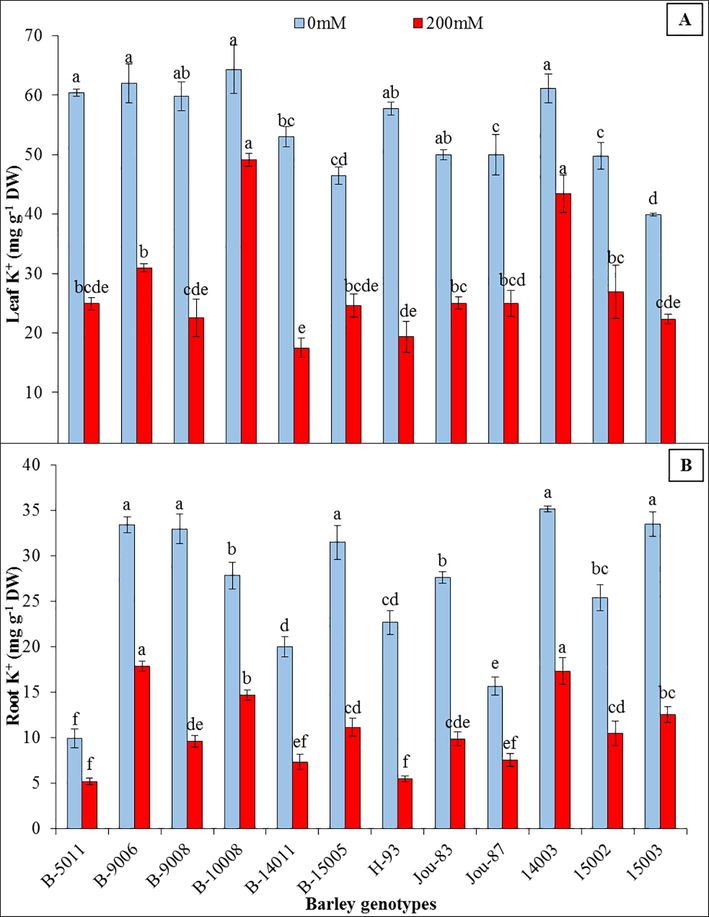
Leaf and root K+ contents (mg g−1 DW) of twelve barley genotypes grown under control (0 mM NaCl) and saline (200 mM NaCl) conditions. Different letters represent statistical significance difference estimated by Duncan’s Multiple Range Test (DMRT) among barley genotypes (P < 0.05) at control (0 mM NaCl) and saline (200 mM NaCl) conditions independently.
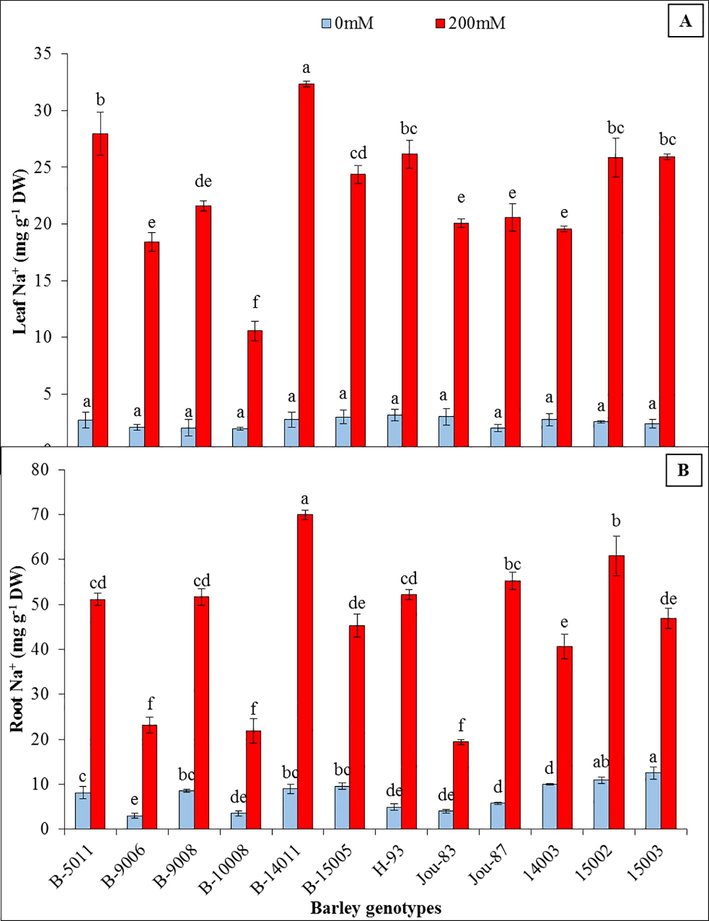
Leaf and root Na+ contents (mg g−1 DW) of twelve barley genotypes grown under control (0 mM NaCl) and saline (200 mM NaCl) conditions. Different letters represent statistical significance difference estimated by Duncan’s Multiple Range Test (DMRT) among barley genotypes (P < 0.05) at control (0 mM NaCl) and saline (200 mM NaCl) conditions independently.
4.4 Fast fluorescence kinetics (OJIP)
Both barley genotypes produced a typical polyphasic fluorescence induction transients (Fig. 3). Minimal fluorescence (FO) reflected that QA were in the oxidized state (Open PSII reaction centers) and Fm showed that QA were in the reduced state (Close PSII reaction centers). Results of raw OJIP transients showed that salt stress decreased the fluorescence mainly at I and P steps in both barley genotypes and differential kinetics verified this (Fig. 3). Moreover, the extent of this decreased became more evident in salt-sensitive genotype (B-14011) at ‘I’ and ‘P’ steps. Both genotypes showed an equal response in O-J (primary photochemistry) regions but both genotypes differed at J-I and I-P (redox states of QA, PQ and acceptor site of PSI) region (Fig. 3). The value of VJ was significantly high in “B-14011” which indicated that closed reaction centers were accumulating under salinity stress in this genotype. Salt stress caused the appearance of both K and L-bands which were more obvious in genotype “B-14011” showing that salt stress damaged OEC and its connection with LHC of core PSII proteins on donor end (Fig. 5).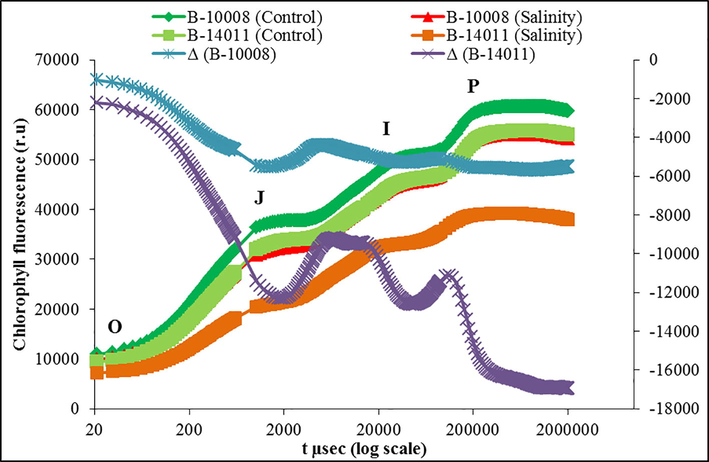
Raw OJIP chlorophyll-a transients and kinetic differences of two barley genotypes (B-10008 and B-14011) grown under control (0 mM NaCl) and saline (200 mM NaCl) conditions.
4.5 Performance of PSII (JIP test)
Salt stress reduced the quantum yield and efficiency of PSII as measured ratios of basic chlorophyll fluorescence parameters in both barley genotypes (Fig. 4). The quantum yield of primary photochemistry (ΦPo), the efficiency of PSII to move trapped electrons in electron transport chain (Ψo) and electron transport to beyond QA (ΦEO), were substantially reduced due to salinity stress, particularly in “B-14011” (salt-sensitive genotype) as compared to “B-10008” (salt-tolerant genotype) (Fig. 4). Moreover, salt stress increased the quantum yield of heat dissipation (ΦDO) in both barley genotypes. Data analysis shows that the maximum number of turns over for QA reduction until Fm reached (N), rate of QA reduction (Mo) and maximum turn-over of QA reduction until Fm reached (N) were reduced.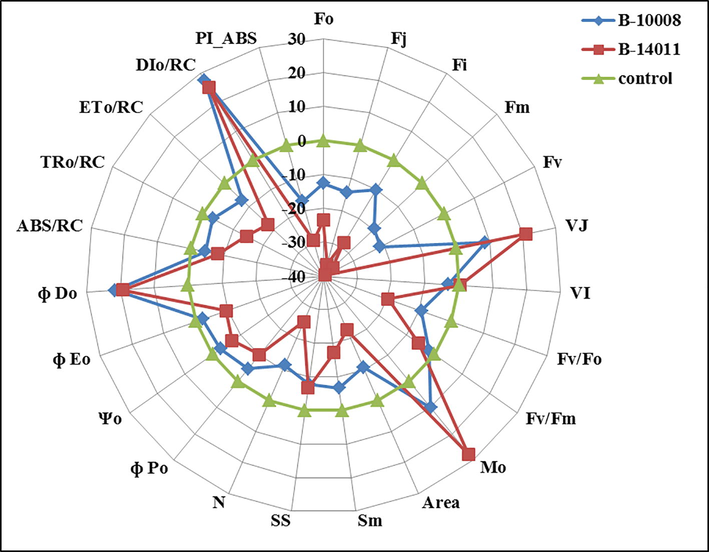
A spider plot of selected JIP parameters derived from chlorophyll-a fluorescence in barley genotypes “B-10008” and B-14011” grown under non-saline (0 mM NaCl) and saline (200 mM NaCl) conditions.
Results revealed that salinity stress caused a significant reduction in energy flux for absorption (ABS/RC), trapping (TRo/RC) and electron transport (ETo/RC) in both genotypes of barley. In contrast, dissipation energy flux per reaction center (DIo/RC) was significantly enhanced in both genotypes at 200 mM NaCl stress. Efficiency of electron donation to PSI (Fv/Fo) and maximum quantum yield of PSII (Fv/Fm) was significantly reduced under salinity stress in both genotypes. The area between ‘Fo’ and ‘Fm’ was also decreased under salinity stress which indicated that inhibition in transport of electron from RC to PQ pool. Similarly, performance index on the absorption basis (PIABS) was also reduced under salinity stress (Fig. 4). The adverse effects of salt stress on these attributes were greater in salt-sensitive genotype “B-14011” as compared to salt tolerant genotype “B-10008” (Fig. 4).
The K and L-bands were appeared due to imposition of salinity stress in both barley genotypes. A clear difference in these bands was observed in both genotypes (Fig. 5). Similarly, a remarkable difference was observed in salt sensitive genotype (B-14011) at VOI and VIP stage of fluorescent curves (Fig. 6).![Double normalized transients of chlorophyll-a fluorescence of dark adopted leaves of barley genotypes (B-10008 and B-14011) grown under non-saline and saline (200 mM NaCl) conditions. (A, B) Kinetic difference of VOK [(ΔVOK = (Ft-Fo)/(FK-FO)] presenting L-band (E). (C, D) Kinetic difference of VOJ [(ΔVOJ = (Ft-FO)/(FJ-FO)] presenting K-band (F).](/content/185/2021/33/1/img/10.1016_j.jksus.2020.101239-fig5.png)
Double normalized transients of chlorophyll-a fluorescence of dark adopted leaves of barley genotypes (B-10008 and B-14011) grown under non-saline and saline (200 mM NaCl) conditions. (A, B) Kinetic difference of VOK [(ΔVOK = (Ft-Fo)/(FK-FO)] presenting L-band (E). (C, D) Kinetic difference of VOJ [(ΔVOJ = (Ft-FO)/(FJ-FO)] presenting K-band (F).
![Double normalized transients of chlorophyll-a fluorescence of dark adopted leaves of barley genotypes (B-10008 and B-14011) grown under non-saline and saline (200 mM NaCl) conditions. Kinetic difference of VOP [(ΔVOP = (Ft-FO)/(FP-FO)] (A, B), Kinetic difference of VOI [(ΔVOI = (Ft-FO)/(FI-FO)] (C, D) and Kinetic difference of VIP [(ΔVIP=(Ft-FO)/(FM-FI)] (E, F).](/content/185/2021/33/1/img/10.1016_j.jksus.2020.101239-fig6.png)
Double normalized transients of chlorophyll-a fluorescence of dark adopted leaves of barley genotypes (B-10008 and B-14011) grown under non-saline and saline (200 mM NaCl) conditions. Kinetic difference of VOP [(ΔVOP = (Ft-FO)/(FP-FO)] (A, B), Kinetic difference of VOI [(ΔVOI = (Ft-FO)/(FI-FO)] (C, D) and Kinetic difference of VIP [(ΔVIP=(Ft-FO)/(FM-FI)] (E, F).
5 Discussion
Soil salinity is a major global issue to sustainable agriculture as it affects plant growth and development at all growth stages by disturbing cellular and physiological processes (Arif et al., 2020). Salinity causes osmotic stress which in turn leads the plant to physiological drought condition thus results in stunted plant growth (Ahammed et al., 2020). In this study, salt stress reduced the growth (biomass accumulation, shoot and root lengths) of all 12 barley genotypes; however, this adverse effect was different on different genotypes. Based on growth under salt stress, one salt-tolerant (B-10008) and one salt-sensitive genotype (B-14011) were identified (Tables 2 and 3). This reduction in growth attributes is due to excessive accumulation of Na+ and Cl¯ as well as unbalanced nutrient uptake as reported in barley plants (Shelden et al., 2020). Similar genotypic variation for salt tolerance has already been observed in barley (Saade et al., 2020), rice (Subudhi et al., 2020), canola (Iqbal et al., 2019; Ulfat et al., 2020). Such genotypic variation for salt tolerance could be due to variation in different physiological processes such as photosynthetic capacity, ion uptake and maintenance of plant water status or antioxidant potential (Subudhi et al., 2020).
Salinity stress is responsible for excessive accumulation of Na+ with simultaneous reduction in the uptake of essential nutrients like K+ from roots to photosynthetic leaves (Zhang et al., 2020). It has also been reported that the accumulation of Na+ and a decrease in K+ contents in photosynthetic leaves may result in chlorophyll degradation and disturbs thylakoid membranes (Bose et al., 2017). In this study, a greater increase in the accumulation of Na+ and a decrease in K+ in leaves and roots of all barley genotypes was observed, however this increase was much high of salt-sensitive genotype (B-14011) as compared to its control plants (Figs. 1 and 2). Similar results were observed in wheat (Iqra et al., 2020), canola (Naveed et al., 2020), maize (Azizian and Sepaskhah, 2020), tomato (Kamanga et al., 2020), rice (Qin and Huang, 2020) and barley (Zeeshan et al., 2020). Several studies found that accumulation of Na+ and K+ both change the stacking of grana in the chloroplast and thus light-driven reactions (Bose et al., 2017).
Photosynthetic pigments are an important determinant of plant photosynthetic capacity (Khan et al., 2019). Chlorophyll a and chlorophyll b are integral component of PSII. Salt stress reduced these photosynthetic pigments (Table 3), which might have been due to either decrease in biosynthesis or increase in degradation of these pigments by stress-induced activation of chlorophyllase activity (Mihailovic et al., 1997). Salinity reduced the total chlorophyll contents in wheat (Betzen et al., 2019), tomato (Kamanga et al., 2020), wheat and barley (Zeeshan et al., 2020). There is a direct relationship of chlorophyll contents and electron transport chain in photosynthesis (Ahammed et al., 2018).
OJIP analysis is the most powerful and widely used technique to understand the structural stability of PSII as it gives a complete insight of energy fluxes between different components of PSII (Guidi et al., 2019). In this experiment, we have observed that salt stress reduced the fluorescence emission in both barley genotypes, particularly in salt-sensitive genotype (B-14011), at all steps of OJIP transient (O, J, I and P steps i.e., FO, FJ, FI and Fm), however, this decrease was much great at I and P steps (Figs. 3 and 4). The genotype “B-14011” exhibited very low ‘Fm’ under salinity stress. This low Fm value indicates the accumulation of inactive RC at PSII (Kalaji et al., 2011a). These results indicated that salt stress limited the transfer of absorbed energy from the light-harvesting complex to the reaction center and the probability of electron transport from donor end of PSII to acceptor side of PSII (Stirbet and Govindjee, 2011; Tsimilli-Michael and Strasser, 2008). The I-P phase of the curve was more strongly disturbed in salt-sensitive barley genotype “B-14011” which indicated poor redox state of pool of QB, cytb6f and acceptor end of PSI (Stirbet and Govindjee, 2011). Kinetically, response of I-P in fluorescence transient is correlated with PSI activity, so any change in I-P amplitude can be used as an indicators for change in PSI content of the leaf (Ceppi et al., 2012). The decrease in I-P phase reveal to enhanced cyclic electron flow (CEF) around PSI (Kono et al., 2014; Zhou et al., 2019) due to blockage of electron transfer at electron acceptor side of PSI (Hamdani et al., 2015).
Differential qualitative analysis of K-band and L-band (0–300 and 0–2000 s−1) indicate the intactness of OEC and LHC with core PSII proteins or level of injuries to PSII at OEC and LHC sites (Rastogi et al., 2020a). Although salinity stress caused the appearance of K and L-bands in both genotypes still the intensity of damage was more obvious in genotype “B-14011” as compared to “B-10008” (Figs. 5 and 6). This showed that salinity induced damage to PSII at the donor end of PSII and LHC sites in genotype “B-14001” was more apparent due to presence of positive K and L-band.
Salinity stress more significantly reduced Fv/Fo and Fv/Fm in “B-14011” as compared to “B-10008” (Fig. 4). The Fv/Fo is the most sensitive component of photosynthetic electron transport chain (Fricke and Peters, 2002). The reduction in Fv/Fo indicates that efficiency of electron donation from OEC to donor side of PSII was reduced under salinity stress (Pereira et al., 2000). The decrease in Fv/Fm indicated the fact that PSII RCs were damaged/photochemically inactive under salinity stress. This may also be attributed to reduced capacity of PSII to transport electrons under salinity stress (Basu et al., 1998). These results are similar to some earlier studies in mustard (Wani et al., 2019) canola (Athar et al., 2015; Iqbal et al., 2019; Ulfat et al., 2020) and barley (Kalaji et al., 2011b). Similarly, significant enhancement in ‘VJ’ and ‘Mo’ under salt stress especially in salt sensitive genotype (B-14011) reflects the accumulation of QA−, due to blockage of electron transfer from QA to QB on the PSII acceptor side (Mehta et al., 2010).
Salt induced reduction in ABS/RC in both barley genotypes (Fig. 4) indicated that salt stress one hand resulted into increase in inactive RCs while on the other hand weakened the connectivity of PSII reaction center and antenna (LHC) (Kalaji et al., 2011a). The increase in inactive reaction centers due to salt stress results in the down-regulation of ETo/RC and ψO in both barley genotypes, however the tolerant genotype “B-10008” exhibited higher value for ETo/RC and ψO under salinity stress (Fig. 4). Similar results were observed previously in Syrian barley and sweet sorghum (Kalaji et al., 2011b; Rastogi et al., 2020a). The accumulation of inactive reaction centers during salinity stress, as was observed in this experiment, especially in salt sensitive genotype “B-14011”, was associated with higher dissipation of absorbed energy as indicated by higher values of ΦDO and DIO/RC as an adaptive strategy to reduce photodamage to photosynthetic apparatus (Rastogi et al., 2020b).
Similarly, the quantum efficiencies of ΦPo and ΦEo were also decreased greater in salt-sensitive genotype (B-14011) (Fig. 4). These findings are similar to previous findings (Duarte et al., 2017; Kalaji et al., 2017; Küpper et al., 2019) which revealed that salt stress reduced the utilization of trapped photon in the transfer of electrons from QA to QB and beyond than QB to electron transport chain. Thus causing over-reduction of plastoquinone pool (PQH2) under salinity stress (Rastogi et al., 2020a). Our results are also in conformity that salt stress caused a greater decrease in performance index on absorption basis (PIABS) which is linked with a decrease in active reaction centers, trapping and transport of electrons to ETC (Kalaji et al., 2011a; Rastogi et al., 2020a).
6 Conclusions
The JIP test gives a better understanding of the structure and function of PSII in barley genotypes under salinity stress. Salt stress reduced primary photochemistry of PSII by reducing the absorption of solar energy or size of antenna (ABS/RC), transfer of absorbed energy from the antenna to reaction center (TRo/RC) and utilization of trapped energy in electron transport (ETO/RC). It is suggested that salt stress disrupted the light-harvesting complex from the reaction center and slightly affected the donor end of PSII. Such adverse effects of salt stress were greater in salt-sensitive genotype (B-14011) as compared to tolerant one (B-10008).
CRediT authorship contribution statement
Muhammad Salim Akhter: Conceptualization, Methodology, Investigation. Sibgha Noreen: Conceptualization, Validation, Resources, Visualization, Supervision, Project administration. Seema Mahmood: Methodology. Habib-ur-Rehman Athar: Validation, Formal analysis, Data curation. Muhammad Ashraf: . Abdulaziz Abdullah Alsahli: Software, Formal analysis, Funding acquisition. Parvaiz Ahmad: Validation, Funding acquisition.
Acknowledgments
This paper is part of PhD research work of Muhammad Salim Akhter performed at the Institute of Pure and Applied Biology, Bahauddin Zakariya University Multan, Pakistan. The authors would like to extend their sincere appreciation to the Researchers Supporting Project Number (RSP-2020/236), King Saud University, Riyadh, Saudi Arabia.
Declaration of competing interest
The authors declare that they have no known competing financial interests or personal relationships that could have appeared to influence the work reported in this paper.
References
- Brassinosteroids in plant tolerance to abiotic stress. J. Plant Growth Regul. 2020:1-14.
- [Google Scholar]
- COMT1 silencing aggravates heat stress-induced reduction in photosynthesis by decreasing chlorophyll content, photosystem II activity, and electron transport efficiency in tomato. Front. Plant Sci.. 2018;9:998.
- [Google Scholar]
- Salinity induced physiological and biochemical changes in plants: an omic approach towards salt stress tolerance. Plant Physiol. Biochem.. 2020;156:64-77.
- [Google Scholar]
- Multiple effects of chromate on the photosynthetic apparatus of Spirodela polyrhiza as probed by OJIP chlorophyll a fluorescence measurements. Environ Pollut. 2001;115:49-64.
- [Google Scholar]
- Copper enzyme in isolated chloroplast and chlorophyll expressed in terms of mg per gram. Plant Physiol.. 1949;24:15.
- [Google Scholar]
- Salinity induced changes in light harvesting and carbon assimilating complexes of Desmostachya bipinnata (L.) Staph. Environ. Exp. Bot.. 2017;135:86-95.
- [Google Scholar]
- Glycinebetaine improved photosynthesis in canola under salt stress: evaluation of chlorophyll fluorescence parameters as potential indicators. J. Agron. Crop Sci.. 2015;201:428-442.
- [CrossRef] [Google Scholar]
- Azizian, A., Sepaskhah, A.R. 2020. Maize response to water, salinity and nitrogen levels: soil and plant ions accumulation. Iran Agricultural Research.
- Changes in net photosynthetic rate and chlorophyll fluorescence in potato leaves induced by water stress. Photosynthetica. 1998;35:13-19.
- [Google Scholar]
- Effects of increasing salinity on photosynthesis and plant water potential in kansas salt marsh species. Transac. Kansas Acad. Sci.. 2019;122:49-58.
- [Google Scholar]
- Chloroplast function and ion regulation in plants growing on saline soils: lessons from halophytes. J. Exp. Bot. 2017
- [CrossRef] [Google Scholar]
- Effects of high salinity from desalination brine on growth, photosynthesis, water relations and osmolyte concentrations of seagrass Posidonia australis. Marine Pollut. Bull.. 2017;115:252-260.
- [Google Scholar]
- The IP amplitude of the fluorescence rise OJIP is sensitive to changes in the photosystem I content of leaves: a study on plants exposed to magnesium and sulfate deficiencies, drought stress and salt stress. Physiol. Plantarum. 2012;144:277-288.
- [Google Scholar]
- Salt stress effects on the photosynthetic electron transport chain in two chickpea lines differing in their salt stress tolerance. Photosynthesis Res. 2017
- [CrossRef] [Google Scholar]
- Disentangling the photochemical salinity tolerance in Aster tripolium L.: connecting biophysical traits with changes in fatty acid composition. Plant Biol.. 2017;19:239-248.
- [Google Scholar]
- New fluorescence parameters for monitoring photosynthesis in plants 1- The effect of illumination on the fluorescence parameters of the JIP-test. Photosynth. Res.. 2003;78:17-33.
- [Google Scholar]
- The biophysics of leaf growth in salt-stressed barley: A study at the cell level. Plant Physiol.. 2002;129:374-388.
- [Google Scholar]
- Chlorophyll fluorescence, photoinhibition and abiotic stress: does it make any difference the fact to be a C3 or C4 species? Front. Plant Sci.. 2019;10:174.
- [Google Scholar]
- Variations between the photosynthetic properties of elite and landrace Chinese rice cultivars revealed by simultaneous measurements of 820 nm transmission signal and chlorophyll a fluorescence induction. J. Plant Physiol.. 2015;177:128-138.
- [Google Scholar]
- Hoagland, D.R., Arnon, D.I. 1950. The water-culture method for growing plants without soil. Circular California agricultural experiment station, 347.
- Leaf proteome analysis signified that photosynthesis and antioxidants are key indicators of salinity tolerance in canola (Brassica napus L.) Pak. J. Bot.. 2019;52
- [CrossRef] [Google Scholar]
- Evaluation for Na+/K+ ratio under salt stress condition in wheat. Life Sci. J.. 2020;17:43-47.
- [Google Scholar]
- Plant salinity stress: many unanswered questions remain. Front. Plant Sci.. 2019;10:80.
- [Google Scholar]
- Prompt chlorophyll fluorescence as a tool for crop phenotyping: an example of barley landraces exposed to various abiotic stress factors. Photosynthetica. 2018;56:953-961.
- [Google Scholar]
- Effects of salt stress on photosystem II efficiency and CO2 assimilation of two Syrian barley landraces. Environ. Exp. Bot.. 2011;73:64-72.
- [Google Scholar]
- Effects of salt stress on photosystem II efficiency and CO2 assimilation of two Syrian barley landraces. Environ. Exp. Bot.. 2011;73:64-72.
- [CrossRef] [Google Scholar]
- Chlorophyll Fluorescence: Understanding Crop Performance—Basics and Applications. Boca Raton: CRC Press; 2017.
- Salinity acclimation ameliorates salt stress in tomato (Solanum lycopersicum L.) seedlings by triggering a cascade of physiological processes in the leaves. Sci. Hortic.. 2020;270:109434.
- [Google Scholar]
- Proteomic and physiological assessment of stress sensitive and tolerant variety of tomato treated with brassinosteroids and hydrogen peroxide under low-temperature stress. Food Chem.. 2019;289:500-511.
- [Google Scholar]
- Roles of the cyclic electron flow around PSI (CEF-PSI) and O2-dependent alternative pathways in regulation of the photosynthetic electron flow in short-term fluctuating light in Arabidopsis thaliana. Plant Cell Physiol.. 2014;55:990-1004.
- [Google Scholar]
- Analysis of OJIP chlorophyll fluorescence kinetics and QA reoxidation kinetics by direct fast imaging. Plant Physiol.. 2019;179:369-381.
- [Google Scholar]
- RBOH1-dependent apoplastic H2O2 mediates epigallocatechin-3-gallate-induced abiotic stress tolerance in Solanum lycopersicum L. Environ. Exp. Bot.. 2019;161:357-366.
- [Google Scholar]
- Salinity: a major agricultural problem—causes, impacts on crop productivity and management strategies. In: Plant Abiotic Stress Tolerance. Springer; 2019. p. :83-99.
- [Google Scholar]
- Chlorophyll a fluorescence study revealing effects of high salt stress on Photosystem II in wheat leaves. Plant Physiol. Biochem.. 2010;48:16-20.
- [Google Scholar]
- Highlighting the mechanisms by which proline can confer tolerance to salt stress in Cakile maritima. Pak. J. Bot.. 2016;48:417-427.
- [Google Scholar]
- Chlorophyllase activity in wheat, Triticum aestivum L. leaves during drought and its dependence on the nitrogen ion form applied. Plant Sci.. 1997;129:141-146.
- [Google Scholar]
- Chlorophyll fluorescence: a review of its practical forestry applications and instrumentation. Scandinavian Journal Forest Research. 1995;10:383-410.
- [Google Scholar]
- Analysis of elevated temperature induced inhibition of Photosystem II using Chl a fluorescence induction kinetics. Plant Biology. 2011;13:1-6.
- [Google Scholar]
- Alleviation of salinity-induced oxidative stress, improvement in growth, physiology and mineral nutrition of canola (Brassica napus L.) through calcium-fortified composted animal manure. Sustainability. 2020;12:846.
- [Google Scholar]
- Engineering Rubisco activase from thermophilic cyanobacteria into high-temperature sensitive plants. Crit Rev Biotechnol 2018:1-14.
- [CrossRef] [Google Scholar]
- Stress-induced degradation of D1 protein and its photoprotection by DCPIP in isolated thylakoid membranes of barley leaf. Biol. Plant.. 2008;52(2):291-298.
- [Google Scholar]
- Gas exchange and chlorophyll fluorescence in four citrus rootstocks under aluminium stress. J. Plant Physiol.. 2000;157:513-520.
- [Google Scholar]
- Chlorophyll a fluorescence study revealing effects of flooding in canola hybrids. Biologia. 2012;67(2):338-346.
- [Google Scholar]
- The phytohormonal regulation of Na+/K+ and reactive oxygen species homeostasis in rice salt response. Mol. Breed.. 2020;40:1-13.
- [Google Scholar]
- JIP-test as a tool to identify salinity tolerance in sweet sorghum genotypes. Photosynthetica. 2020;58:518-528.
- [Google Scholar]
- Special issue in honour of Prof. Reto J. Strasser – JIP-test as a tool to identify salinity tolerance in sweet sorghum genotypes. Photosynthetica. 2020;58:333-343.
- [CrossRef] [Google Scholar]
- Effect of salinity on cadmium tolerance, ionic homeostasis and oxidative stress responses in conocarpus exposed to cadmium stress: implications for phytoremediation. Ecotoxicol. Environ. Saf.. 2019;171:146-153.
- [Google Scholar]
- Dissecting new genetic components of salinity tolerance in two-row spring barley at the vegetative and reproductive stages. PLoS One. 2020;15:e0236037
- [CrossRef] [Google Scholar]
- Insights into the Physiological and Biochemical Impacts of Salt Stress on Plant Growth and Development. Agronomy. 2020;10:938.
- [Google Scholar]
- A laser ablation technique maps differences in elemental composition in roots of two barley cultivars subjected to salinity stress. Plant J.. 2020;101:1462-1473.
- [Google Scholar]
- Melatonin and gibberellic acid promote growth and chlorophyll biosynthesis by regulating antioxidant and methylglyoxal detoxification system in tomato seedlings under salinity. J. Plant Growth Regul. 2020:1-15.
- [Google Scholar]
- The fluorescence transient as a tool to characterize and screen photosynthetic samples. In: Yunus M., Pathre U., Mohanty P., eds. Probing photosynthesis: Mechanism, regulation and adaptation. London, UK: Taylor and Francis; 2000. p. :443-480.
- [Google Scholar]
- Strasser, R.J., Tsimilli-Michael, M., Srivastava, A. (2004) Analysis of the Chlorophyll a Fluorescence Transient. In: Papageorgiou GC, Govindjee (eds), Chlorophyll fluorescence: A Signature of Photosynthesis, Advances in Photosynthesis and Respiration Series vol 19, pp 321-362. Kluwer Academic Publishers, Rotterdam, The Netherlands.
- On the relation between the Kautsky effect (chlorophyll a fluorescence induction) and Photosystem II: Basics and applications of the OJIP fluorescence transient. J. Photochem. Photobiol. B Biol.. 2011;104:236-257.
- [CrossRef] [Google Scholar]
- Genetic variation for grain yield, straw yield and straw quality traits in 132 diverse rice varieties released for different ecologies such as upland, lowland, irrigated and salinity prone areas in India. Field Crops Res.. 2020;245:107626.
- [Google Scholar]
- Experimental resolution and theoretical complexity determine the amount of information extractable from the chlorophyll fluorescence transient OJIP. In: Allen J., Gantt E., Golbeck J., Osmond B., eds. Photosynthesis. Energy from the Sun. Netherlands: Springer; 2008. p. :697-701.
- [CrossRef] [Google Scholar]
- RNAseq analysis reveals altered expression of key ion transporters causing differential uptake of selective ions in canola (Brassica napus L.) grown under NaCl Stress. Plants. 2020;9:891.
- [CrossRef] [Google Scholar]
- Epibrassinolide and proline alleviate the photosynthetic and yield inhibition under salt stress by acting on antioxidant system in mustard. Plant Physiol. Biochem.. 2019;135:385-394.
- [Google Scholar]
- Effects of exogenous spermidine and elevated CO 2 on physiological and biochemical changes in tomato plants under iso-osmotic salt stress. J. Plant Growth Regul.. 2018;37:1222-1234.
- [Google Scholar]
- Comparison of biochemical, anatomical, morphological, and physiological responses to salinity stress in wheat and barley genotypes deferring in salinity tolerance. Agronomy. 2020;10:127.
- [Google Scholar]
- Plant response to salinity stress. In: Stress Physiology of Woody Plants. CRC Press; 2019. p. :155-173.
- [Google Scholar]
- Elevated CO2 improves antioxidant capacity, ion homeostasis, and polyamine metabolism in tomato seedlings under Ca (NO3) 2-induced salt stress. Sci. Hortic.. 2020;273:109644.
- [Google Scholar]
- Drought-induced changes in photosynthetic electron transport in maize probed by prompt fluorescence, delayed fluorescence, P700 and cyclic electron flow signals. Environ. Exp. Bot.. 2019;158:51-62.
- [Google Scholar]


