

Translate this page into:
Influence of rPAN fiber content and method of preparation on polymeric composite blend
-
Received: ,
Accepted: ,
This article was originally published by Elsevier and was migrated to Scientific Scholar after the change of Publisher.
Peer review under responsibility of King Saud University.
Abstract
Recycled polyacrylonitrile (rPAN) was blended with polyethylene theraphtalate (PET) to form rPAN/PET blends. The blended samples are at different weight fractions (30/70, 50/50, 70/30 w/w rPAN/PET). Dynamic mechanical analysis (DMA) and Fourier-Transform infrared spectroscopy (FTIR) results confirm the immiscibility as well as the interaction between rPAN and PET. The result revealed that blended ratios of rPAN/PET (70/30 and 50/50) are viable for the recycling process.
1 Introduction
Polymer blending process is an important technique for achieving specific properties that individual polymers do not possess for specific applications in modern industrial and engineering practices (Shit and Shah, 2014). The understanding of the effect of the blend properties can be achieved through the technique of Fourier transform infrared spectroscopy (FTIR) which is use to study the chemical composition of many organic and inorganic chemicals, polymers and polymer blends. FTIR is one of the most widely use functional groups detection process and its process is related to the vibrational motion of atoms or molecules in pure and blended polymer samples. This vibrational motion is used for the identification, characterization, interpretation and understanding of the mechanisms of polymer sample absorption pattern leading to their formation. Therefore, FTIR analysis can give not only qualitative (identification) analysis of materials, it is also used for quantitative (amount) analysis (Shalkh and Agrawal, 2014). Similarly, Dynamic mechanical analysis (DMA) on the other hand is a technique employed to analyze and characterize processed materials. It is the most useful tool in the study of the viscoelastic behavior of polymers and polymer blends, due to the advancement in polymer/polymer blends development and applications. DMA technique has been reported in the work of many authors (Menard, 1999, 2008). Their reports have shown tremendous improvement in the application of the tool (Menczel and Prime, 2009).
In this current study, FTIR and DMA were used to characterize in details rPAN, PET and rPAN/PET blended samples. This is in addition to our previous findings on atomic force microscopy and tensile strength analyses (Adegbola et al., 2015), morphology and thermal properties of rPAN fiber blends with PET (microstructural characterization) (Adegbola et al., 2016a,b) and SEM and AFM Microscopical characterization of rPAN fiber and PET blends (Adegbola et al., 2016a,b). FTIR and DMA turned out to be a really useful technique used for material analyses by providing data on the chemical and mechanical properties (Dai and Huang, 2012; Camargo et al., 2009; Ormsby et al., 2006). These characterizations are very important in the development of the rPAN/PET blends to ensure that only high quality blends are produced. This also supported the understanding of the effect of the blending ratios composition of the rPAN/PET blends (Adegbola et al., 2016a,b). In conclusion, the chemical and mechanical properties of rPAN, PET and rPAN/PET blended samples was investigated using FTIR and DMA to establishing the correlation between the DMA and FTIR study of the blends. The paper also, reports on the effect of the blended ratios on the blends properties under FTIR discussion.
2 Experimental methods
2.1 Materials
The rPAN fiber employed in this study was supplied by ESKOM, South Africa. Neat PAN has a molecular weight (Mw) = 53.06 g/mol and an amorphous density of 1.184 g/cm3. The glass transition and melting temperatures are: 95 °C and 317 °C, respectively. The PET was purchased by the Tshwane University of Technology (TUT) from Ten Cate advanced composites BV, the Netherlands. PET has a molecular weight (Mw) = 192.2 g/mol and the amorphous density of 1.370 g/cm3. The glass transition and melting temperatures are: 75 °C and 285 °C, respectively.
2.2 The recycled PAN fiber and PET processing
rPAN fibers were cleaned by soaking in water for 12 h, rinsed and dried for 24 h at room temperature in order to remove the ash and coal particles embedded in it before the blending process took place. Dried rPAN fibers and neat PET were prepared through melt blending using the HAAKE Polylab OS Rheomix 600 (Thermo Electron Co., USA) at 290 °C for 5 min with a rotor speed of 80 rpm. The rPAN and PET were blended at the ratios 30/70; 50/50; 70/30 respectively, while rPAN and PET were used as controls. The resulting blends and control samples were then compression molded to the desired dimensions for various tests (ASTM), using a carver compression mold (Carver, USA). The total compression residence time of 10 min with a compression step of 2 min at a pressure of 1 metric ton was employed and water was used for the slow cooling during the carving process.
3 Characterization
3.1 ATR-FTIR spectroscopy
rPAN, PET and rPAN/PET blended samples spectra were measured by ATR-FTIR spectroscopy (Perkin Elmer 16PC FTIR instrument). This is to analyze the chemical composition of all the samples layer in order to identify the types of chemical bonds (functional groups) by detecting the vibration characteristics of the chemical functional groups in rPAN, PET and rPAN/PET blended samples. The FTIR spectra of the samples were recorded in the region of 4000–500 cm−1 on the Perkin Elmer 16PC FTIR instrument with 32 scans in each sample at the resolution of 4 cm−1 at the glassing angle of 72°.
3.2 DMA
DMA characterization of rPAN, PET and the blended samples were performed using a TA instrument (DMA8000 dynamic mechanical analyzer, PerkinElmer) in the dual cantilever bending mode. The sample characterization was done in a deformation mode at a frequency of 1 Hz, a heating rate of 2 °C/minute from 0 °C to 300 °C and upper stiffness limits: 1.0E+08 and lower stiffness limit 2.0E+02. The dynamic mechanical properties a manifestation of the response of polymer as it is subjected to a periodic force which is expressed in terms of the storage modulus, loss modulus and tan delta. Typical values of the moduli for polymers range from 106 to 1012 dyne/cm2 depending upon the type of polymer, temperature, modulus and frequency.
4 Result discussion
4.1 FTIR
ATR-FTIR spectra of the samples are given in Fig. 1. For rPAN, the peaks were observed at 1571 cm−1, 1470 cm−1, 1180 cm−1, 1091 cm−1, 10,080 cm−1, 806 cm−1, 553 cm−1 and 478 cm−1 could be attributed to the C—H stretching vibrations, CH2 bending vibration, aromatic C⚌N stretching vibration and (CH2) group stretching vibration respectively. This phenomenon might also be due to the presence of the hydroxyl group resulting from asymmetric N—H stretching, absorptions and the carboxylic group stretching in the acrylonitrile (Kanwal et al., 2012) which determine the structural, morphological and mechanical properties of rPAN. For neat PET the peaks observed at 1712 cm−1, 1490 cm−1, 1342 cm−1, 1240 cm−1, 10,930 cm−1, 1017 cm−1, 871 cm−1, 721 cm−1 and 437 cm−1, could be attributed to the presence of hydroxyl ethyl group resulting from the asymmetric C—H stretching, O—H stretching, CO—OH stretching and the carboxylic group, which determine the structural, morphological and mechanical properties of PET. The observation for rPAN and PET are in line with the FTIR band positions of their functional groups (Table 1), which are the determining factor for the morphology, strength and mechanical properties of the blends as discovered in our earlier publications (Adegbola et al., 2015, 2016a,b). Hence, FTIR identifies the presence of functional groups in rPAN and neat PET, which determines the strength properties and area of applications of the rPAN/PET blended polymer materials, this also, served as the benchmark for chemical bond analysis of the blended rPAN/PET samples. Therefore, each blended samples has a specific chemical bond often at a unique energy absorption band relative to the parent element (Table 1). Therefore, the intensity peaks observed in the blended samples are related to the compositional ratios of rPAN and PET in the blend (Fig. 1) (Table 1). The slight variation in rPAN/PET blended samples transmittance and wavenumber can be attributed to the strong presence of either rPAN or PET due to the blended ratio. Hence, as the particle size increases, the width of the peak decreases and intensity increases depending on rPAN or PET ratio in the blend composition. Although there is the possibility of overlapping between the N—H and the O—H stretching vibrations, the strong broadband at the wavenumber region of 600–1500 cm−1 is characterized by the N—H stretching vibration. The significant decrease of transmittance in this band region indicates that the N—H vibration was affected by the presence of PET (Li and Renbi, 2002). This observation further showed that, the compositional ratios of the blended samples play a significant role in the blends development as discussed in our earlier publication on tensile strengths and morphology of the blends (Adegbola et al., 2015, 2016a,b). Therefore, understand the nature of PET adsorption and identify the possible sites of PET binding to rPAN assisted in understanding the adhesion behaviour which is vital to the blended samples strength and possible application areas.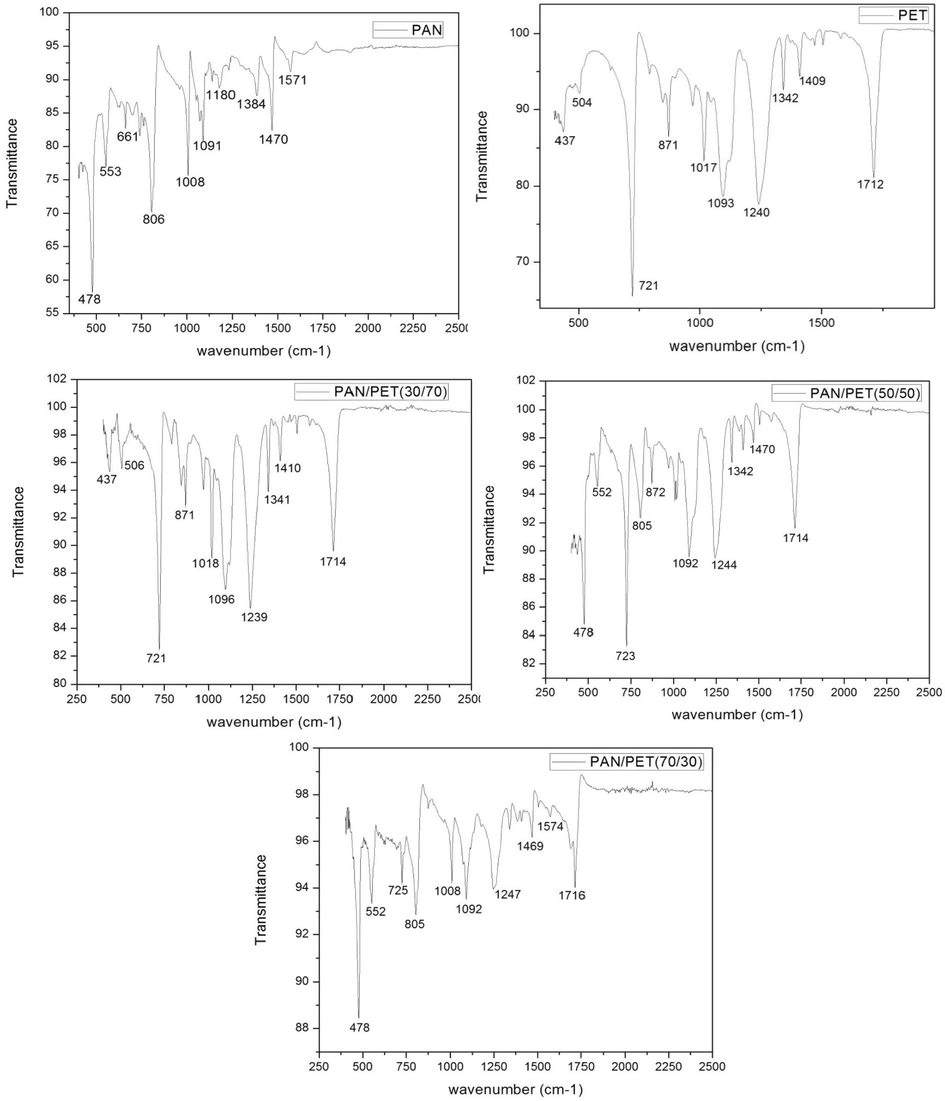
FTIR spectrum of rPAN, PET and blended samples shown over the range of 250 cm−1 –2500 cm−1.
Wavenumber (cm−1)
Intensity shape
Assignments
1500–1800
Variable
C—H stretching (conjugate)
2215–2240
Variable
C—O stretching vibration
C—C stretching vibration (conjugate)
C—O stretching
1400–1660
Variable
N—H bending
CH2 bend vibration
1280–1430
Variable
C—H bending
1160–1420
Variable
O—H bending
900–1380
Variable
C—N stretching
C—O stretching
800–880
Variable
N—H and C—H rocking
400–810
Variable
CH⚌CH stretching
O—H stretching vibration
CH—CH stretching vibration
In conclusion, it was observed that PET is predominant at the low wavelength number in the blend of rPAN/PET (30/70). Both rPAN and PET is predominant in the (50/50) blended sample, an evidence of a co-continuous phase. Lastly, rPAN is predominant at low wavelength number in rPAN/PET (70/30) blend an evidence of homogeneity. The fact that the rPAN/PET blend spectrum shows all the characteristic peaks for rPAN and pure PET, and that no new peaks are observed, indicate the absence of any reaction or interaction between rPAN and PET (Huerta-Martinez et al., 2005).
Fig. 1 and Table 1 showed the blended samples FTIR results with the corresponding band assignments.
4.2 DMA findings discussion
The DMA storage modulus and damping factor curves for rPAN, PET and blended samples are presented in Figs. 2 and 3. A gradual decline in E’ with an increase in temperature was observed in all the samples. This revealed that, the addition of low ratios of PET (<50%) into rPAN slightly improves the toughness (storage modulus) of the blends when compared with the rPAN and neat PET. In addition, the loss modulus value decreases with the addition of 70% by weight ratio of PET to rPAN resulted into the sample (rPAN/PET (30/70) brittleness. Thus, the ratios of PET addition in the blends affect the mechanical properties of the rPAN. This is in line with the FITR discussion and earlier finding on the morphology of rPAN/PET blends (Adegbola et al., 2016a,b).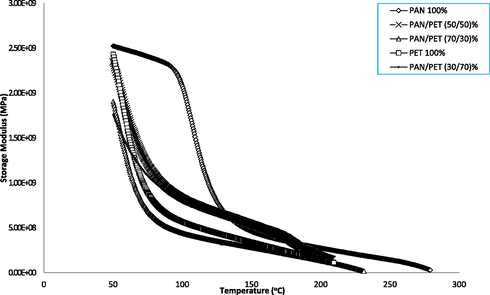
Storage modulus curves of samples.
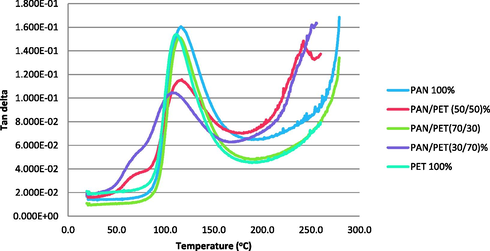
Tan delta curves of samples.
Furthermore, rPAN/PET (50/50) compositional ratio revealed optimum modulus in the blend. Above 50% addition of rPAN in the blend, there was a reversed in the property performance of the material. Therefore, the blend of rPAN/PET (50/50) gave the optimum storage modulus which revealed improve toughness in the blended sample.
Also significant to note is that;
-
As the percentage of PET increases in the blend, changes in the glass transition temperature (Tg) becomes obvious. This might increase the crystallinity of the blended sample and subsequently improved the blends toughness and damping properties (Adegbola et al., 2016a,b).
-
The rapid rise in the loss modulus indicates an increase in the structural mobility of the polymer, a relaxation process that permits motion along larger portions of the individual polymer chains which would be possible below the transition temperature (Stansbury, 2012; Rajakumar and Nanthini, 2011). During the glass transition, which is the largest and most important relaxations, those regions within the polymer structure that are not either crystallized or cross-linked, are capable of moving freely. Under an applied load, this new mobility will take the form of organized movement or flow. The peak of the loss modulus is conventionally identified as the Tg, even though the DMA plot clearly shows that the transition is a process that spans a temperature range. The loss modulus provides the best agreement with determinations made by other thermal analysis methods such as differential scanning calorimetry and thermogravimetric analysis on the blended samples (Adegbola et al., 2016a,b). The lack of shift in the Tg indicates that this is an immiscible blend. The Loss modulus is the contribution of the viscous component in the polymer, that portion of the material will flow under conditions of stress.
Furthermore, the DMA analysis revealed that by increasing the amount of rPAN added in the blends, there is a corresponding increase in the loss of storage modulus, this is in line with the FTIR, thermal, fractal analysis, structural analysis, and the morphological findings of the rPAN/PET blends development (Adegbola et al., 2015, 2016a,b). Therefore, the interaction between rPAN and PET has a significant influence on the properties of the rPAN/PET blends.
4.3 Correlation of the study
The FTIR observation gave a better understanding of the polymer network formation through the stretching of the constituent of rPAN and PET in the blends. The stretching of the constituents in the blends determines the mechanical properties as observed in the DMA result. The compositional ratio of the blends has an effect on the storage modulus and toughness of the samples which determines the blends application and usage.
5 Conclusion
FTIR spectroscopy identifies the chemical composition and ranges of the bonds in the blends which is of significant importance in rPAN/PET development. The DMA result gives vital information about the morphological structure of polymers such as tan delta (damping), loss modulus and storage modulus (stiffness). These are also very important in the blend development. In this study, rPAN/PET (70/30 and 50/50) are identified as the viable polymer blend for viable development and application.
Acknowledgments
DST-CSIR National Center for Nanostructured Materials, Council for Scientific and Industrial Research (CSIR), Pretoria 0001, South Africa.
References
- Atomic force microscopy and tensile strength analyses of recycled PAN and PET blends. Int. J. Environ. Monit. Anal.. 2015;3(5–1):17-21.
- [Google Scholar]
- SEM and AFM characterization of rPAN fiber and PET blends. Alexandra Eng. J. 2016 AEJ-D-16-00348R1
- [Google Scholar]
- Morphology and thermal properties of recycled polyacrylonitrile fiber blends with polyethylene terephthalate: microstructural characterization. J. Appl. Polym. Sci. 2016
- [Google Scholar]
- Nanocomposites: synthesis, structure, properties and new application opportunities. Mater. Res.. 2009;12(1):1-39.
- [Google Scholar]
- Fourier Transform Infra-red Spectroscopy for Natural fibers. In: Dr. Salih Salih, ed. Fourier Transform. Mater. Analysis. 2012. ISBN: 977-953-51-0594-7
- [Google Scholar]
- Compatibility mechanisms between EVA and complex impact heterophasic PP-EPx copolymers as a function of EP content. Eur. Polymer J.. 2005;41:519-525.
- [Google Scholar]
- Removal of Chromium (III) using synthetic polymers, copolymers and their sulfonated derivatives as adsorbents. E-J. Chem.. 2012;9(2):621-630.
- [Google Scholar]
- Mechanisms of lead adsorption on chitosan/PVA hydrogel beads. Langmuir. 2002;18 9765-977.
- [Google Scholar]
- Dynamic Analysis: A Practical Introduction. CRC Press LCC; 1999.
- Dynamic Mechanical Analysis (second ed.). CRC Press Taylor and Francis Group; 2008.
- Thermal Analysis of Polymers: Fundamentals and Applications. New York, USA: John Wiley and Sons; 2009.
- Ormsby, B., Learner, T., Schilling, M., Druzik, J., Khanjian, H., Carson, D., Foster, G., Sloan, M., 2006. The Effects of Surface Cleaning on Acrylic Emulsion Paintings—A Preliminary Investigation. Tate Papers, 6.
- Thermal and morphological behaviours of polybutylene terephthalate/polyethylene terephthalate blend nanocomposites. Rasayan J. Chem.. 2011;4(3):567-579. ISSN: 0974-1496 CODEN: RJCABP
- [Google Scholar]
- Qualitative and quantitative characterization of textile material by fourier transform infra red. Int. J. Innov. Res. Sci. Eng. Technol.. 2014;3(1) (ISSN: 2319-8753)
- [Google Scholar]
- Edible polymers: challenges and opportunities. J. Poly. 2014:13. Article ID: 427259
- [CrossRef] [Google Scholar]
- Dimethacrylate network formation and polymer property evolution as determined by the selection of monomers and curing conditions. Dental Mater.. 2012;28(1):13-22.
- [CrossRef] [Google Scholar]


