

Translate this page into:
Influence of individual and co-application of organic and inorganic fertilizer on NH3 volatilization and soil quality
⁎Corresponding authors at: Department of Bio-Environmental Chemistry, College of Agriculture and Life Science, Chungnam National University, Daejeon 34134, Republic of Korea (K.-S. Lee). kyosuk@cnu.ac.kr (Kyo-Suk Lee), ok5382@cnu.ac.kr (Taek-Keun Oh)
-
Received: ,
Accepted: ,
This article was originally published by Elsevier and was migrated to Scientific Scholar after the change of Publisher.
Peer review under responsibility of King Saud University.
Abstract
The use of nitrogen fertilizers to enhance crop growth tends to increase every year. In addition, as eco-friendly agriculture is emphasized, organic fertilizers are preferred over inorganic fertilizers. However, since most of organic fertilizers in South Korea use imported ingredients, an alternative ingredients is needed. Biochar is an eco-friendly way to recycle various biomass and has a high pH and carbon contents. The objective of this study was to evaluate the effect of individual and co-application of organic and inorganic fertilizers on ammonia (NH3) volatilization and soil quality. Organic fertilizers used in this study were divided into conventional organic fertilizers (CF1 and CF2) and biochar-based organic fertilizers (BF). As a result of the experiment, NH3 volatilization and soil quality were significantly affected by the inorganic fertilizers. Also, NH3 volatilization effected by inorganic fertilizer was rapidly increased between 4 and 7 days. When different organic fertilizers were treated, NH3 emissions by BF was highest at 17.49 and 28.97 kg ha−1 compared to CF1 and CF2, but no statistically significant different was observed. A similar trend was appeared when organic and inorganic fertilizers was co-applied. Therefore, biochar-based organic fertilizers are similar to conventional organic fertilizers in terms of soil quality and NH3 volatilization, but it is expected to contribute to the formation of a stable fertilizer market by reducing the percentage of imported ingredients.
Keywords
Ammonia (NH3)
Biochar
Inorganic fertilizers
Organic fertilizers
Soil quality

- CF
-
conventional organic fertilizers
- BF
-
biochar-based organic fertilizers
- NPK
-
Inorganic fertilizers
- EC
-
electrical conductivity
- T-C
-
total carbon contents
- T-N
-
total nitrogen content
- Av. P2O5
-
available phosphate contents
- T-P2O5
-
total phosphate contents
Abbreviations
1 Introduction
Nitrogen (N) is an important nutrient of plant growth and one of the main factors contributing crop productivity. Application of N fertilizers is an essential agricultural practice for crop quality and quantity, and is vital for sustaining crop yields (Liao et al., 2020). Thereafter, the use of nitrogen fertilizers worldwide increased from 11.6 Tg in 1961 to 100.5 Tg in 2008 (Turner et al., 2012). N fertilizers applied to the soil surface are the major pathway for losses of N such as ammonia (NH3), and approximately 11.0 Tg yr−1 estimates to arise the form of NH3 (Beusen et al., 2008; Kang et al., 2022). The lost NH3 acts as a main source of the nitrous oxide (N2O) and generates secondary particulate matter called PM2.5 (Park et al., 2020; Kang et al., 2021a). In addition, emitted NH3 indirectly effects to biodiversity deterioration, water eutrophication, and air pollution (Fungo et al., 2019). The NH3 emission process is affected by various environmental and factitious factors such as air temperature, moisture, soil pH, type of fertilizers, precipitation, etc (Bouwmeester et al., 1985).
Fertilizers are extensively embezzled worldwide to improve soil fertility. In South Korea, co-application inorganic and organic fertilizers is customary, but recently, individual treatment of organic fertilizer is recommended. The application of inorganic fertilizers was essential to improve crop productivity (Parris, 2011). However, excessive inorganic fertilizers treatment can decrease soil pH and increase soil EC (Kang et al., 2022). So, it aggravates soil quality and plant growth, reduces soil fertility, and accelerates soil acidification (Wu et al., 2020; Wang et al., 2020). The use of organic fertilizers was not preferred because it needs more labor, and lacks direct response to plant production (Yang et al., 2020). However, organic fertilizers can continuously offer various nutrients needed for plant growth and improvement, and amend soil physico-chemical properties such as soil structure, pH, electrical conductivity, etc (Chauhan and Bhatnagar, 2014). In addition, it can also make beneficial conditions for soil microbial, improve water retention and soil fertility (Bell et al., 2015; Liu et al., 2016). Organic fertilizers used as an alternative for inorganic fertilizer were mainly manufactured by blending plant and animal ingredients, and in South Korea, organic fertilizers using two or more kinds of ingredients were mostly used (Yoon et al., 2012; Zhu et al., 2018). So, the influences of organic fertilizers produced from different materials on crop growth are divergent (Fallah et al., 2018).
As a new way of recycling various biomass and organic wastes in agriculture sector to the soil, biochar has a direct and indirect effect on NH3 emission on the soil (Shi et al., 2019). Biochar is a carbon-rich substance manufactured by pyrolysis of biomass and organic materials (e.g., rice husk, maize stalk, and cattle manure) under the oxygen-limited conditions (Martin et al., 2015; Oh et al., 2017; Lee et al., 2019; Kang et al., 2021b). Biochar has led multiple note because of abundant surface functional groups, intensive adsorption capacity, abundant porosity, and high levels of carbon sequestration (Lehmann and Joseph, 2015; Kang et al., 2021c). Several researches have shown that the utilization of biochar to the soil may improve soil aeration and structure, raise soil pH, enhance water and nutrient availability of crop, and alter the soil microbial community, thus promoting growth and yield of plant (Woo, 2013; Lee et al., 2018; Wu et al., 2020). However, the biochar was produced from low pyrolysis temperature had a high level of volatile content, which could have a negative effect on environment ecosystem (Deenik et al., 2011). Combination of organic fertilizers and biochar could reduce negative effects of biochar pyrolyzed low temperature (Schmidt et al., 2014). Many studies reported the positive influences of biochar, but effect of organic fertilizers combined biochar was still insufficient (Sasmita et al., 2017).
In this study, we hypothesize that fertilizer conditions (type, dose, ingredient, etc) will affect NH3 volatilization from agricultural soil, and that ingredients of organic fertilizers can be replaced to the biochar. Therefore, we conducted a static chamber experiment to investigate the effects of fertilizer conditions and substitutability of biochar on NH3 volatilization and soil quality.
2 Materials and methods
2.1 Experimental site
The field experiment was conducted in test field belonging to the College of Agriculture and Life Science of the Chungnam National University in Daejeon, Republic of Korea (36°22′02.1″ N 127°21′12.1″ E). The research was carried out for 77 days in the period the 5th of September 2020 to the 21th of November 2020. The soil of test field was classified as Inceptisols with 12.8% clay, 41.4% silt, and 45.8% sand. The physico-chemical properties of the soil are represented in Table 1. This region has both humid continental climate and humid subtropical climate affected by the East Asian monsoon, with high precipitation in summer, which begins between June and July. The average annual temperature and total precipitation of the experimental site were 13.0 °C and 1458.7 mm. Detailed meteorological conditions during this experiments are shown in Fig. 1. Abbreviation: EC, electrical conductivity; T-C, total carbon contents; T-N, total nitrogen contents; Av. P2O5, available phosphate contents.
Sample
Texture
pH
EC
T-C
T-N
Av. P2O5
Ca2+
K+
Mg2+
Na+
(1:5)
(dS m−1)
(%)
(mg kg−1)
(cmolc kg−1)
Soil
Inceptisols
6.13 ± 0.05
0.74 ± 0.06
0.51 ± 0.01
0.06 ± 0.00
25.90 ± 3.94
5.49 ± 0.17
0.16 ± 0.01
1.84 ± 0.04
0.09 ± 0.01
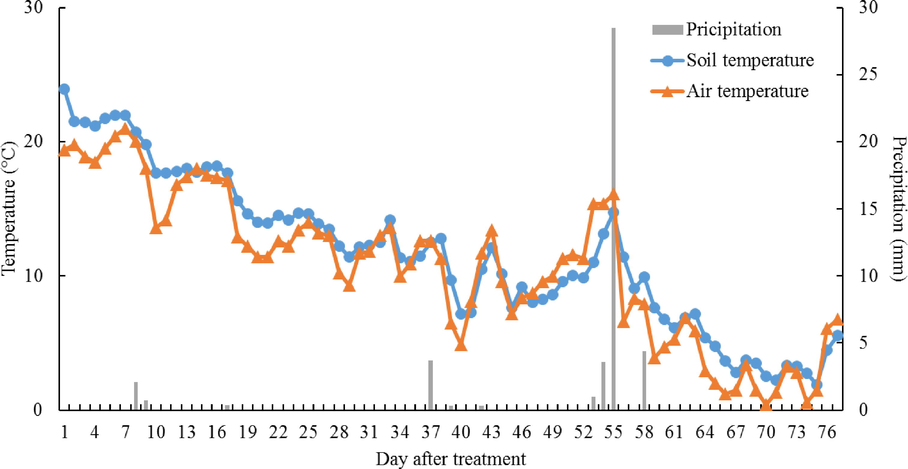
Meteorological conditions during the experiments.
2.2 Experimental design
The area of each treatments was approximately 3.0 m × 3.5 m (10.5 m2), which was separated by 1 m to avoid interference among different fertilizers. Treatments divided into 36 units and organic and inorganic fertilizers were treated to the soil surface. In addition, total of 36 experimental plots were randomly arranged. Organic fertilizers were treated only as basal fertilizer and applied with 120 kg N ha−1. Inorganic fertilizer was treated with 320 kg N ha−1 in the experimental group and sprayed four times (i.e., 110–70–70–70 kg N ha−1). Experimental plots co-applied organic and inorganic fertilizers were treated with 440 kg N ha−1 (i.e., organic fertilizer 120 kg N ha−1 + inorganic fertilizer 320 kg N ha−1). Treated dose of inorganic fertilizers was conducted based on Soil Management and Fertilizer Recommendations of the Rural Development Administration, South Korea. Also, inorganic fertilizers used in this experiment were the same type. The basal fertilizer was applied on September 25, 2020 (Day 1), and the topdressing was treated on October 9, 2020 (Day 15), October 24, 2020 (Day 30), and November 8, 2020 (Day 45). Water management was followed the local conventional practice, and irrigation was performed twice a week.
The experiment to investigate NH3 volatilization on by organic and inorganic fertilizers individual application or co-application were separated as eight treatments. Control is an untreated treatment without organic and inorganic fertilizers, NPK is the treatment where only inorganic fertilizers were applied. CF1 (conventional organic fertilizer), CF2, and BF (biochar-based organic fertilizer) were treated with organic fertilizers and CF1 + NPK, CF2 + NPK, and BF + NPK were applied with organic and inorganic fertilizers.
2.3 NH3 volatilization measurement
Measurement of NH3 volatilization from each experimental plots was conducted using a static chamber (h: 30.0 × Ø: 12.0 cm) made of acrylic. Two pieces of sponge (h: 2.0 × Ø: 12.5 cm) as NH3 absorbers in the chamber were moistened in Glycerol-phosphoric acid solution, which consisted of 40 ml L−1 glycerol (C3H8O) and 68.6 ml L−1 phosphoric acid (H3PO4). The upper sponge prevented the ingress of external gasses, and the lower sponge had the function of capturing NH3 occurred in the soil. The sponge absorbed NH3 was extracted by 2 M KCl solution. The NH4+ concentration in KCl extracts was determined by Indophenol blue method using a UV/Vis-spectrophotometer (GENESYS 50, Thermo Scientific Inc., Waltham, Massachusetts, USA). Daily NH3 emissions were calculated based on soil surface area covered by the chambers (0.011 m2), temperature in chamber, and the amount of fertilizers. Total NH3 volatilization was calculated by summing daily NH3 emissions.
2.4 Analysis of soil and organic fertilizers
Soil samples were collected from total 10 points in the experimental plot, and blended fully. After mixing samples, soils were dried for 1 week in grass greenhouse and passed through a 2 mm sieve. An analysis of soil physico-chemical properties was conducted as follows. Soil texture was determined by hydrometer method. pH and EC (electrical conductivity) of soil were measured using a Benchtop Meter with pH and EC (ORION™ Versa Star Pro™, Thermo Scientific Inc., Waltham, Massachusetts, USA) after blending soil samples and distilled water at a ratio 1:5 (w v−1) and stirring for 30 min. T-C (total carbon contents) and T-N (total nitrogen contents) were measured by CHN analyzer (TruSpec Micro, Leco, Michigan, USA). Av.P2O5 (available phosphate contents) was analyzed using a Lancaster method by UV/Vis-spectrophotometer. ICP-OES (ICAP 7000series ICP spectrometer, Thermo Scientific Inc., Waltham, Massachusetts, USA) were used to measured Exchangeable cations (Ca2+, K+, Mg2+, Na+).
The pH and EC of organic fertilizers were determined using a Benchtop Meter with pH and EC after mixing samples and distilled water at a ratio 1:10 (w v−1) and stirring for 30 min. T-C and T-N were analyzed using CHN analyzer. UV/Vis-spectrophotometer was used for the determination of T-P2O5 (total phosphate contents) using a vanadate method. Inorganic contents (CaO, K2O, MgO, Na2O) were measured by ICP-OES.
2.5 Statistical analysis
The results of NH3 volatilization and soil physico-chemical properties during cultivation were expressed as average value. Statistical significant difference between each treatments was compared using Duncan multiple range test after ANOVA using a statistical analysis program (IBM SPSS Statistics version 26, New York, USA). Statistical significance could have been set on the basis of the 95% confidence interval.
3 Results and discussions
3.1 Chemical properties of organic fertilizers
The constituent ingredients and blend ratios of organic fertilizers were represented in Tables 2, and 3 recorded the chemical properties of biochar used material of organic fertilizers. Table 4 showed the chemical properties of organic fertilizers. The pH of organic fertilizers was lower in BF (pH 6.30) compared to other organic fertilizer. CF1 and CF2′s pH were pH 6.70 and pH 7.57, respectively and it has a higher pH than normal soil, which may negatively affect the soil and crop. On the contrary, the pH of BF was fit in the appropriate pH range (pH 5.5–6.5), so it will be no negative effect on growth of crop during cultivation. EC was relatively lower at 20.41 dS m−1 for CF1 and higher at 66.56 dS m−1 for CF2 compared to BF in 25.17 dS m−1. In the case of T-C, CF1 and CF2 were measured to be 37.10% and 37.50%, respectively and BF was determined to be 47.70%, which is 10% higher than CF1 and CF2. It is thought to be due to the high carbon contents of biochar in BF. T-N tended to be higher in CF1 and CF2 compared to the BF and was highest in CF2 at 5.99%. T-P2O5 showed a similar tendency to those of the T-N and was highest in CF1 at 2.20%. CaO contents and K2O contents were 2.03% and 1.99% for BF, which was higher than CF1 and CF2. Especially, K2O contents were 5.6 times higher in BF compared to CF1 and CF2. MgO contents were highest in CF1 at 1.78% and Na2O contents were highest in CF2 at 0.32%. Organic fertilizers used in South Korea are stipulated that the sum of two of N, P2O5, and K2O is 7% or more. In the case of BF produced using biochar, the total amount of N and K2O is more than 7%, so it can used as an organic fertilizers. Also, the high carbon content of BF compared to CF1 and CF2 can increase the organic matter contents in the soil and improve soil fertility. Abbreviation: OF, conventional organic fertilizers; BF, biochar-based organic fertilizers. Abbreviation: EC, electrical conductivity; T-N, total nitrogen contents; T-P2O5, total phosphate contents; K2O, potassium oxide contents; OM, organic matter contents; CEC, cation exchange capacity. Abbreviation: OF, conventional organic fertilizers; BF, biochar-based organic fertilizers; EC, electrical conductivity; T-C, total carbon contents; T-N, total nitrogen contents; T-P2O5, total phosphate contents.
Treatments
Biochar
Castor oil-cake
Soybean-cake
Coffee meal
Rice bran
Rape seed oil-cake
(%, v v−1)
CF1
–
47
23
-
20
10
CF2
–
78
–
–
14
8
BF
10
30
45
5
10
–
Treatment
pH
EC
T-N
T-P2O5
K2O
OM
CEC
(1:10)
(dS m−1)
(%)
(cmolc kg−1)
Biochar
9.80 ± 0.01
8.80 ± 0.02
0.44 ± 0.03
0.33 ± 0.05
1.56 ± 0.00
62.90 ± 0.07
38.60 ± 0.00
Treatments
pH
EC
T-C
T-N
T-P2O5
CaO
K2O
MgO
Na2O
(1:10)
(dS m−1)
(%)
CF1
6.70 ± 0.01
20.41 ± 0.20
37.1 ± 0.00
5.35 ± 0.00
2.20 ± 0.53
1.21 ± 0.07
0.19 ± 0.01
1.78 ± 0.25
0.19 ± 0.01
CF2
7.57 ± 0.01
66.56 ± 1.02
37.5 ± 0.00
5.99 ± 0.00
2.14 ± 0.56
1.57 ± 0.14
0.32 ± 0.01
0.72 ± 0.13
0.32 ± 0.01
BF
6.30 ± 0.01
25.17 ± 1.56
47.70 ± 0.00
5.17 ± 0.00
0.94 ± 0.00
2.03 ± 0.01
1.99 ± 0.00
0.16 ± 0.02
0.18 ± 0.04
3.2 Change in the soil chemical properties
Chemical properties of the soil affected organic and inorganic fertilizers were shown in Table 5. Compared with the soil before the experiment, the pH of control, CF1, CF2, and BF was lower, but increased when applied with inorganic fertilizers. Also, the soil pH was increased in all units except for CF1 in comparison with control treatment. NPK was revealed the highest pH at pH 8.35, and control was shown the lowest pH at pH 5.96. This phenomenon is considered to be caused by the K2O fertilizers (pH 11.0) used in this study. EC showed a similar tendency to soil pH, and it was highly increased when co-applied with organic and inorganic fertilizers. Especially, the EC was highest in CF2 + NPK (4.29 dS m−1) compared to other treatments, and it is thought because the EC value of CF2 (66.56 dS m−1) was higher than other organic fertilizers (CF1, BF). The T-C and T-N of the soil after the experiment were increased beside the soil before the experiment. Also, T-C and T-N in units co-applied with organic and inorganic fertilizers were higher than those treated with organic fertilizers alone. In the case of T-C, all treatments was increased compared to the control, but T-N was enhanced in the units co-applied with organic and inorganic fertilizers. Av. P2O5 was increased in all treatments except for CF2, and was the highest at 44.52 mg kg−1 in BF + NPK. Exchangeable cations contents showed an overall tendency to increase after fertilization. In particular, Ca2+ contents were highest at 6.53 cmolc kg−1 in control, and K+ contents were highest at 4.13 cmolc kg−1 in NPK. Abbreviation: NPK, treatments applied with inorganic fertilizer; OF, conventional organic fertilizers; BF, biochar-based organic fertilizers; EC, electrical conductivity; T-C, total carbon contents; T-N, total nitrogen contents; Av. P2O5, available phosphate contents. a – d: Each value with different letters within a column are statistically significant difference from each other as determined by Duncan's multiple range test (p < 0.05).
Treatment
pH
EC
T-C
T-N
Av. P2O5
Ca2+
K+
Mg2+
Na+
(1:5)
(dS m−1)
(%)
(mg kg−1)
(cmolc kg−1)
Control
5.96 ± 0.44 cd
0.28 ± 0.02c
0.54 ± 0.02b
0.07 ± 0.00b
26.32 ± 7.69b
6.53 ± 0.39a
0.21 ± 0.03c
2.54 ± 0.25a
0.12 ± 0.01c
NPK
8.35 ± 0.18a
3.98 ± 0.86a
0.77 ± 0.02a
0.14 ± 0.01a
37.97 ± 9.35ab
6.49 ± 0.48a
4.13 ± 1.02a
1.91 ± 0.22b
0.19 ± 0.04a
CF1
5.87 ± 0.67d
0.43 ± 0.10c
0.59 ± 0.05b
0.07 ± 0.00b
35.22 ± 7.81ab
5.85 ± 0.92a
0.20 ± 0.03c
2.26 ± 0.30ab
0.12 ± 0.02c
CF1 + NPK
7.60 ± 0.66b
3.74 ± 0.61ab
0.82 ± 0.02a
0.14 ± 0.01a
38.28 ± 6.67ab
6.05 ± 1.38a
2.86 ± 1.64b
1.93 ± 0.44b
0.17 ± 0.04ab
CF2
6.07 ± 0.37c
0.45 ± 0.06c
0.55 ± 0.06b
0.07 ± 0.00b
19.92 ± 5.57c
6.33 ± 0.99a
0.18 ± 0.03c
2.45 ± 0.29a
0.13 ± 0.02c
CF2 + NPK
8.28 ± 0.31ab
4.29 ± 0.51a
0.79 ± 0.04a
0.14 ± 0.01a
43.90 ± 10.24a
6.32 ± 0.27a
3.48 ± 1.18ab
1.92 ± 0.26b
0.20 ± 0.03a
BF
6.12 ± 0.36c
0.36 ± 0.03c
0.57 ± 0.05b
0.07 ± 0.01b
25.87 ± 12.55bc
6.07 ± 0.66a
0.19 ± 0.01c
2.34 ± 0.21a
0.12 ± 0.02c
BF + NPK
7.99 ± 0.40ab
3.86 ± 0.65ab
0.72 ± 0.02a
0.15 ± 0.01a
42.52 ± 14.97a
5.93 ± 1.46a
3.05 ± 1.03ab
1.82 ± 0.32b
0.17 ± 0.04ab
3.3 NH3 volatilization
The NH3 volatilization from individual organic fertilizer application were shown in Figs. 2 and 3. All of the treatments applied with organic fertilizer mainly occurred within the 10 days after fertilization, and the peaks of NH3 emissions was highest at Day 6 – Day 8, respectively. After NH3 volatilization was reached the maximum, emitted NH3 rate decreased gradually until there was similar to control (Fig. 2). Especially, the peak of NH3 emissions treated by BF reached the highest value on Day 8 at 857.22 g ha−1 h−1. The NH3 peak of CF1 and CF2 appeared on Day 6 and Day 7, respectively. The trend of NH3 emissions from individual application of BF was sharply proceed in the initial period than CF1 and CF2 from Day 1 to Day 24, but CF1, CF2, and BF showed a similar trend of NH3 emissions after Day 25. The total amount of NH3 volatilization from Day 1 to Day 77 was highest in BF with 17.49 kg ha−1, and lowest in CF1 with 15.65 kg ha−1 (Fig. 3). However, there was no statistically significant difference between CF1, CF2, and BF. The results recorded on NH3 volatilization by co-application of organic and inorganic fertilizers were represented in Figs. 4 and 5. The trend of NH3 volatilization occurred within the initial period after co-application of organic and inorganic fertilizers, and appeared the highest peak on Day 3 or Day 4. The highest rate of NH3 emission was detected in the Day 4 at 2780.49 g ha−1 h−1 on CF1 + NPK (Fig. 4). After basal and top dressings, the NH3 volatilization in the all treatments except for control was sharply proceed, and decreased rapidly. The highest value was 28.97 kg ha−1 in the BF + NPK treatment, and the lowest value was 19.13 kg ha−1 in the NPK treatment. Other treatments (CF1 + NPK and CF2 + NPK) were 28.13, 28.87 kg ha−1, respectively. Also, no statistically significant difference was observed when treatments co-applied with organic and inorganic fertilizers.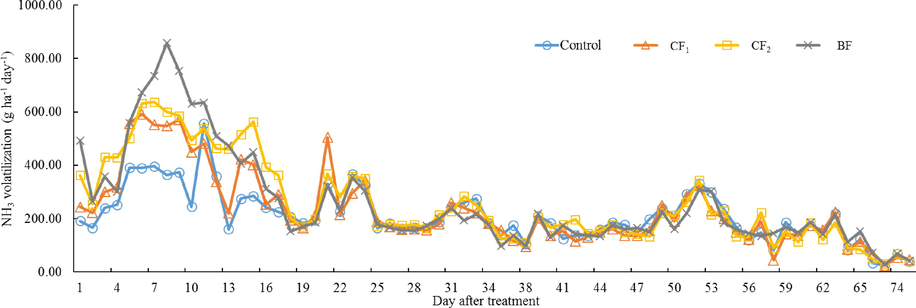
Daily NH3 volatilization applied with only organic fertilizers.
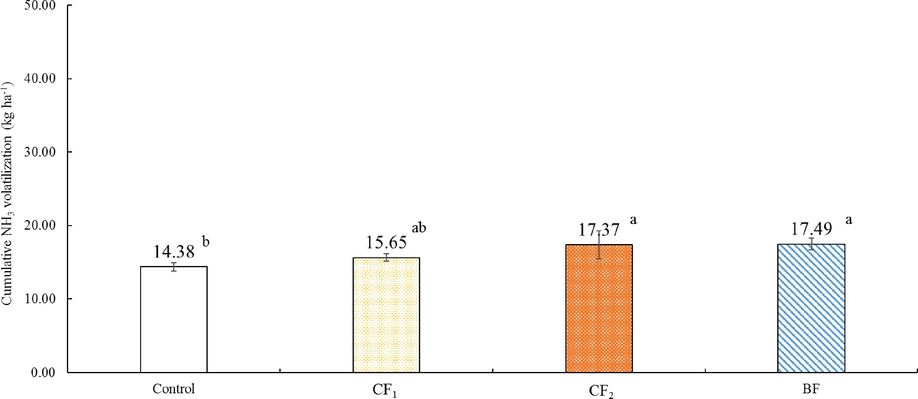
Total NH3 volatilization applied with only organic fertilizers. Error bars indicate standard deviations of the means (n = 3). a – b: Each value with different letters within a column are statistically significant difference from each other as determined by Duncan's multiple range test (p < 0.05).
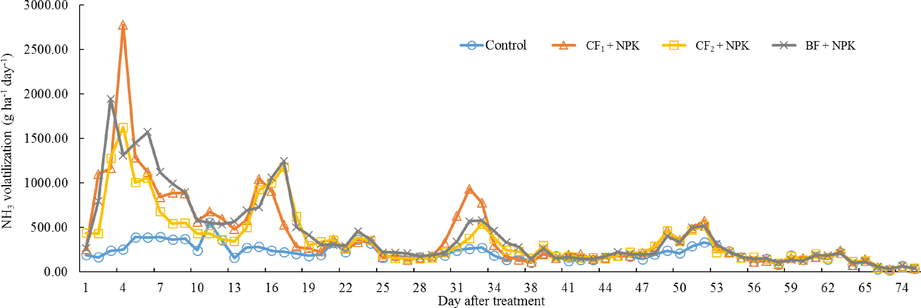
Daily NH3 volatilization applied with organic and inorganic fertilizers.
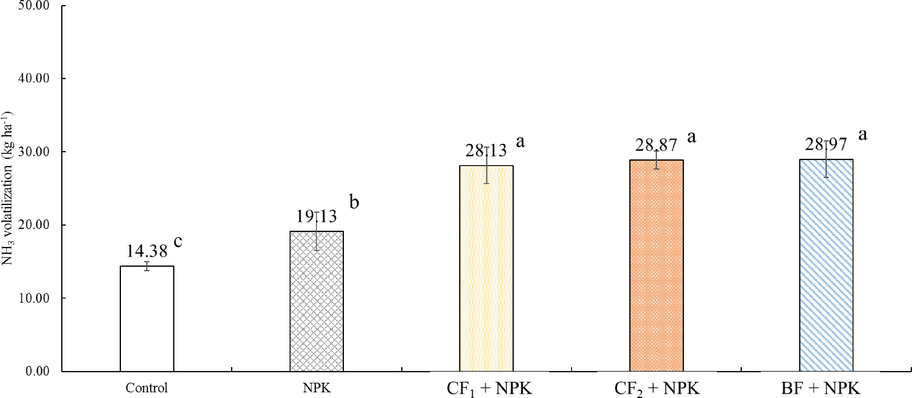
Total NH3 volatilization applied with organic and inorganic fertilizers. Error bars indicate standard deviations of the means (n = 3). a – c: Each value with different letters within a column are statistically significant difference from each other as determined by Duncan's multiple range test (p < 0.05).
4 Conclusions
This study was conducted to investigate the effects of individual and co-application of organic and inorganic fertilizers on NH3 volatilization and soil quality. Biochar-based organic fertilizers had lower pH, T-N, and T-P2O5 but higher T-C and K2O contents compared to the conventional organic fertilizers (CF1 and CF2). After fertilization to the soil, most of the soil chemical properties were decreased in the treatments treated with only organic fertilizers, whereas all of parameters were increased in treatments co-applied with organic and inorganic fertilizers·NH3 volatilization by treating with organic fertilizers was higher in BF in comparison with the CF1 and CF2. However, there was no statistically significant difference between CF1, CF2, and BF. In addition, a similar trend was observed when organic and inorganic fertilizers were co-applied. In this study, it was observed that biochar-based organic fertilizers had a similar effect on the NH3 volatilization and soil quality as with conventional organic fertilizers. Also, the NH3 volatilization and soil quality was mostly affected by inorganic fertilizers than organic fertilizers. Therefore, biochar-based organic fertilizers are considered to be able to sequestrate carbon for a long time and reduce the price of organic fertilizers by using biochar as part of the ingredients.
Acknowledgements
The authors extend their appreciation to the Researchers supporting project number (RSP-2021/316) King Saud University, Riyadh, Saudi Arabia.
Declaration of Competing Interest
The authors declare that they have no known competing financial interests or personal relationships that could have appeared to influence the work reported in this paper.
References
- Plant nitrogen uptake drives rhizosphere bacterial community assembly during plant growth. Soil Biol. Biochem.. 2015;85:170-182.
- [Google Scholar]
- Bottom-up uncertainly estimates of global ammonia emissions from global agricultural production systems. Atmos. Environ.. 2008;42(24):6067-6077.
- [Google Scholar]
- Effect of environmental factors on ammonia volatilization from a urea-fertilized soil. Soil Sci. Soc. Am. J.. 1985;49(2):376-381.
- [Google Scholar]
- Influence of long term use of organic and inorganic manures on soil fertility and sustainable productivity of wheat in vertisols of madhya Pradesh. Asian J. Soil Sci.. 2014;9(1):113-116.
- [Google Scholar]
- Deenik, J.L., Diarra, A., Uehara, G., Campbell, S., Sumiyoshi, Y., Antal, Jr. M.G., 2011. Charcoal ash and volatile matter effects on soil properties and plant growth in an acid Ultisol. Soil Science, 176(7):336-345.
- Chemical compositions of essential oil and antioxidant activity of dragonhead (Dracocephalum moldavica) in sole crop and dragonhead-soybean (Glycine max) intercropping system under organic manure and chemical fertilizers. Ind. Crops Prod.. 2018;115:158-165.
- [Google Scholar]
- Ammonia and nitrous oxide emissions from a field Ultisol amended with tithonia green manure, urea, and biochar. Biol. Fertil. Soils. 2019;55(2):135-148.
- [Google Scholar]
- Effects of varying rates of nitrogen and biochar pH on NH3 emissions and agronomic performance of chinese cabbage (Brassica rapa ssp. pekinensis) Agronomy. 2022;12(1):61.
- [Google Scholar]
- Adsorption characteristics of NH4+ by biochar derived from rice and maize residue. Korean J. Environ. Agric.. 2021;40:161-168.
- [Google Scholar]
- Evaluation of NH3 emissions in accordance with the pH of biochar. Korean J. Environ. Agric.. 2021;48:787-796.
- [Google Scholar]
- Adsorption characteristics of NH4-N by biochar derived from pine needles. Korean J. Environ. Agric.. 2021;48:589-596.
- [Google Scholar]
- Effect of different biochar formulations on the growth of cherry tomatoes. Korean J. Environ. Agric.. 2019;46(4):931-939.
- [Google Scholar]
- Effect of different types of biochar on the growth of Chinese cabbage (Brassica chinensis) Korean J. Environ. Agric.. 2018;45(2):197-203.
- [Google Scholar]
- Biochar for environmental management: an introduction. London: Earthscan from Routledge; 2015. p. :1-9.
- Effects of biochar-based controlled release nitrogen fertilizer on nitrogen-use efficiency of oilseed rape (Brassica napus L.) Sci. Rep.. 2020;10(1):1-14.
- [Google Scholar]
- Carbon-rich organic fertilizers to increase soil biodiversity: evidence from a meta-analysis of nematode communities. Agric. Ecosyst. Environ.. 2016;232:199-207.
- [Google Scholar]
- Biochar-mediated reductions in greenhouse gas emissions from soil amended with anaerobic digestates. Biomass Bioenergy. 2015;79:39-49.
- [Google Scholar]
- Effect of biochar application on growth of Chinese cabbage (Brassica Chinensis) Korean J. Environ. Agric.. 2017;7:359-365.
- [Google Scholar]
- Evaluation of ammonia (NH3) emissions from soil amended with rice hull biochar. Korean J. Environ. Agric.. 2020;47(4):1049-1056.
- [Google Scholar]
- Impact of agriculture on water pollution in OECD countries: recent trends and future prospects. Int. J. Water Resour. Dev.. 2011;27(1):33-52.
- [Google Scholar]
- Application of biochar and organic fertilizer on acid soil as growing medium for Cacao (Theobroma cacao L.) seedlings. Int. J. Sci. Basic Appl. Res.. 2017;36(5):261-273.
- [Google Scholar]
- Biochar and biochar-compost as soil amendments to a Vineyard soil: Influences on plant growth, nutrient uptake, plant health and grape quality. Agric. Ecosyst. Environ.. 2014;191:117-123.
- [Google Scholar]
- Effects of combined biochar and organic fertilizer on nitrous oxide fluxes and the related nitrifier and denitrifier communities in a saline-alkali soil. Sci. Total Environ.. 2019;686:199-211.
- [Google Scholar]
- Ammonia volatilization from nitrogen fertilizers applied to creals in two cropping areas of southern Australia. Nutr. Cycl. Agroecosyst.. 2012;93:113-126.
- [Google Scholar]
- Beneficial bacteria activate nutrients and promote wheat growth under conditions of reduced fertilizer application. BMC Microbiol.. 2020;20(1):1-12.
- [Google Scholar]
- Increased organic fertilizer application and reduced chemical fertilizer application affect the soil properties and bacterial communities of grape rhizosphere soil. Sci. Rep.. 2020;10(1):1-10.
- [Google Scholar]
- Combined application of organic and inorganic fertilizers mitigates ammonia and nitrous oxide emissions in a maize field. Nutr. Cycl. Agroecosyst.. 2020;117(1):13-27.
- [Google Scholar]
- Effect of different colored polyethylene mulch on the change of soil temperature and yield of Chinese cabbage in autumn season. Korean J. Environ. Agric.. 2012;45:511-514.
- [Google Scholar]
- Effects of different organic fertilizers on growth of rice seedlings raised in straw substrates. Acta Agric. Univ.. Jiang.. 2018;40(2):286-294.
- [Google Scholar]


