

In silico study on anticonvulsant activity of isoxazole and thiazole derivatives active in subcutaneous pentylenetetrazole animal model
⁎Corresponding author. senguade@gmail.com (Adedirin Oluwaseye) adedirinoluwaseye@yahoo.com (Adedirin Oluwaseye)
-
Received: ,
Accepted: ,
This article was originally published by Elsevier and was migrated to Scientific Scholar after the change of Publisher.
Peer review under responsibility of King Saud University.
Abstract
Quantitative structure-activity relationship (QSAR) and molecular docking studies have been done on 28 isoxazole and thiazole derivatives with anticonvulsant activity in subcutaneous pentylenetetrazole animal model. Physicochemical parameters obtained from PaDEL-Descriptors were utilized in the study. Parametric semi-empirical quantum technique PM3 available in Spartan 14 program was used to optimize the molecular structure of the dataset compounds. Genetic function algorithm, Modified-K-Medoid clustering, correlation analysis and multiple linear regressions were used to search for the best QSAR model. The model obtained had good statistical parameters (LOF = 0.056, R2 = 0.975, Q2 = 0.959, F3,15 = 198.058, R2(Pred.) = 0.761, PRESS = 0.058, SEE = 0.062 and cR2P = 0.887) and can be utilized to predict the anticonvulsant activity of compounds that are within its chemical space. Molecular docking analysis showed that the studied compounds had a better binding affinity for γ-aminobutyrate aminotransferase than vigabatrin which is a known inhibitor of γ-aminobutyrate aminotransferase.
Keywords
QSAR
Molecular docking
Subcutaneous pentylenetetrazole
Genetic function algorithm

1 Introduction
Convulsion is defined as abnormal violent and involuntary series of contractions of the muscles. It characterize epilepsy episodes which occurs when the process of excitation exceed inhibition in the central nervous system (Stafstrom, 2006). Epilepsy is a global phenomenon, affecting about 1% of the world population and about 60% of affected patients do not have access to appropriate treatment (Heinzen et al., 2010). Untreated epilepsy often leads to impaired intellectual function and psychosocial prejudices (Shindikar et al., 2006). The common method of epilepsy treatment involves the use of chemical agents (Estrada and Peña, 2000) and a number of compounds have been reported to possess anticonvulsant activity (Ghidini et al., 2006; Thurkauf et al., 1990). There are about 40 antiepileptic drugs (AEDs) in the market, but, about 30% patients do not respond to them and those who responded to them usually came up with various side effects like cognitive dysfunction, ataxia, behavioral disorder est. (Avanzini and Franceschetti, 2003). All this limitation encourages the search for more anticonvulsant molecules with improved activity and reduced side effects.
Some isoxazole and thiazole derivatives were reported to possess anticonvulsant activity in subcutaneous pentylenetetrazol (scPTZ) test (Tatee et al., 1986), which is among the main methods used to determine the anticonvulsant activity of molecules. These molecules could act as inhibitor of gamma-amino butyrate-aminotransferase (GABA_AT) (Dimmock et al., 1995). The objective of the study is to elucidate the molecular properties that influence the anticonvulsant activity of isoxazole and thiazole derivatives using quantitative structure-activity relationship (QSAR) and molecular docking techniques. QSAR is an method that establishes a mathematical relationship between numerical structural properties and numerical biological activity of molecules(Chtita et al., 2013); while molecular docking is a computational method that helps in understanding the way two molecules like drug and protein fit together (Sapna Rani and Kumar, 2014). QSAR and molecular docking have been used in rational drug design to speed up drug designing process (Sapna Rani and Kumar, 2014).
2 Materials and methods
2.1 Dataset
The experimental information on the activity of isoxazole and thiazole derivatives in scPTZ test used in the study were collected from literature (Tatee et al., 1986). The anticonvulsant activity of these molecules was reported as ED50 (mg kg−1). The activity was transformed to ED50 (mol kg–1) and then to Log (1/ED50) in order to allow their values to approach normal distribution (Tropsha, 2010). The molecular structure, IUPAC name and anticonvulsant activity of dataset compounds are presented in Table 1.
| ID | Molecular structure and IUPAC name | Exp. Log(1/ED50) | Pred. Log(1/ED50) | Residual |
|---|---|---|---|---|
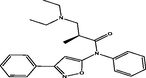
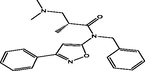
| 1t |
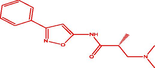 (R)-3-(dimethylamino)-2-methyl-N-(3-phenylisoxazol-5-yl)propanamide (R)-3-(dimethylamino)-2-methyl-N-(3-phenylisoxazol-5-yl)propanamide |
3.738 | 3.907 | −0.169 |
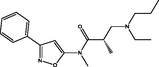
| 2 |
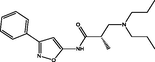 (S)-3-(dipropylamino)-2-methyl-N-(3-phenylisoxazol-5-yl)propanamide (S)-3-(dipropylamino)-2-methyl-N-(3-phenylisoxazol-5-yl)propanamide |
4.051 | 3.995 | 0.056 |
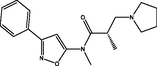
| 3 |
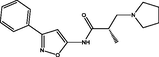 (S)-2-methyl-N-(3-phenylisoxazol-5-yl)-3-(pyrrolidin-1-yl)propanamide (S)-2-methyl-N-(3-phenylisoxazol-5-yl)-3-(pyrrolidin-1-yl)propanamide |
4.228 | 4.296 | −0.068 |
| 4 |
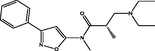 (S)-3-(diethylamino)-N,2-dimethyl-N-(3-phenylisoxazol-5-yl)propanamide (S)-3-(diethylamino)-N,2-dimethyl-N-(3-phenylisoxazol-5-yl)propanamide |
4.353 | 4.272 | 0.081 |
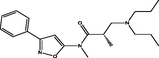
| 5 |
 (S)-3-(ethyl(propyl)amino)-N,2-dimethyl-N-(3-phenylisoxazol-5-yl)propanamide (S)-3-(ethyl(propyl)amino)-N,2-dimethyl-N-(3-phenylisoxazol-5-yl)propanamide |
4.397 | 4.354 | 0.043 |
| 6 |
 (S)-3-(dipropylamino)-N,2-dimethyl-N-(3-phenylisoxazol-5-yl)propanamide (S)-3-(dipropylamino)-N,2-dimethyl-N-(3-phenylisoxazol-5-yl)propanamide |
4.087 | 4.095 | −0.007 |
| 7t |
 (R)-N-ethyl-2-methyl-N-(3-phenylisoxazol-5-yl)-3-(piperidin-1-yl)propanamide (R)-N-ethyl-2-methyl-N-(3-phenylisoxazol-5-yl)-3-(piperidin-1-yl)propanamide |
4.421 | 4.235 | 0.186 |
| 8t |
 (R)-3-(diethylamino)-2-methyl-N-(3-phenylisoxazol-5-yl)-N-propylpropanamide (R)-3-(diethylamino)-2-methyl-N-(3-phenylisoxazol-5-yl)-N-propylpropanamide |
4.185 | 4.078 | 0.107 |
| 9t |
 (R)-2-methyl-N-(3-phenylisoxazol-5-yl)-3-(piperidin-1-yl)-N-propylpropanamide (R)-2-methyl-N-(3-phenylisoxazol-5-yl)-3-(piperidin-1-yl)-N-propylpropanamide |
3.962 | 4.046 | −0.084 |
| 10 |
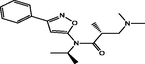 (R)-3-(dimethylamino)-N-isopropyl-2-methyl-N-(3-phenylisoxazol-5-yl)propanamide (R)-3-(dimethylamino)-N-isopropyl-2-methyl-N-(3-phenylisoxazol-5-yl)propanamide |
4.451 | 4.409 | 0.042 |
| 11 |
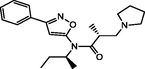 (R)-N-((S)-sec-butyl)-2-methyl-N-(3-phenylisoxazol-5-yl)-3-(pyrrolidin-1-yl)propanamide (R)-N-((S)-sec-butyl)-2-methyl-N-(3-phenylisoxazol-5-yl)-3-(pyrrolidin-1-yl)propanamide |
4.625 | 4.680 | −0.055 |
| 12 |
 (S)-3-(diethylamino)-2-methyl-N-phenyl-N-(3-phenylisoxazol-5-yl)propanamide (S)-3-(diethylamino)-2-methyl-N-phenyl-N-(3-phenylisoxazol-5-yl)propanamide |
4.268 | 4.210 | 0.059 |
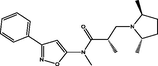
| 13 |
 (S)-N,2-dimethyl-N-(3-phenylisoxazol-5-yl)-3-(pyrrolidin-1-yl)propanamide (S)-N,2-dimethyl-N-(3-phenylisoxazol-5-yl)-3-(pyrrolidin-1-yl)propanamide |
4.104 | 4.174 | −0.070 |
| 14 |
 (S)-3-((2S,5S)-2,5-dimethylpyrrolidin-1-yl)-N,2-dimethyl-N-(3-phenylisoxazol-5-yl)propanamide (S)-3-((2S,5S)-2,5-dimethylpyrrolidin-1-yl)-N,2-dimethyl-N-(3-phenylisoxazol-5-yl)propanamide |
4.431 | 4.385 | 0.046 |
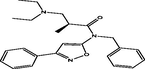
| 15t |
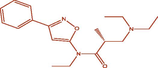 (R)-3-(diethylamino)-N-ethyl-2-methyl-N-(3-phenylisoxazol-5-yl)propanamide (R)-3-(diethylamino)-N-ethyl-2-methyl-N-(3-phenylisoxazol-5-yl)propanamide |
3.976 | 4.173 | −0.196 |
| 16t |
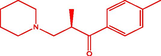 (R)-2-3-(piperidin-1-yl)-1-(p-tolyl)propan-1-one (R)-2-3-(piperidin-1-yl)-1-(p-tolyl)propan-1-one |
4.330 | 3.690 | 0.640 |
| 17 |
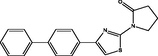 1-(4-([1,1′-biphenyl]-4-yl)thiazol-2-yl)pyrrolidin-2-one 1-(4-([1,1′-biphenyl]-4-yl)thiazol-2-yl)pyrrolidin-2-one |
4.044 | 4.114 | −0.070 |
| 18 |
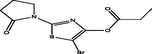 5-bromo-2-(2-oxopyrrolidin-1-yl)thiazol-4-yl propionate 5-bromo-2-(2-oxopyrrolidin-1-yl)thiazol-4-yl propionate |
4.193 | 4.160 | 0.033 |
| 19 |
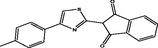 2-(4-(p-tolyl)thiazol-2-yl)-1H-indene-1,3(2H)-dione 2-(4-(p-tolyl)thiazol-2-yl)-1H-indene-1,3(2H)-dione |
3.893 | 3.949 | −0.056 |
| 20 |
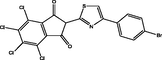 2-(4-(4-bromophenyl)thiazol-2-yl)-4,5,6,7-tetrachloro-1H-indene-1,3(2H)-dione 2-(4-(4-bromophenyl)thiazol-2-yl)-4,5,6,7-tetrachloro-1H-indene-1,3(2H)-dione |
3.448 | 3.367 | 0.081 |
| 21 |
 (R)-N-benzyl-3-(dimethylamino)-2-methyl-N-(3-phenylisoxazol-5-yl)propanamide (R)-N-benzyl-3-(dimethylamino)-2-methyl-N-(3-phenylisoxazol-5-yl)propanamide |
3.751 | 3.812 | −0.061 |
| 22 |
 (S)-N-benzyl-3-(diethylamino)-2-methyl-N-(3-phenylisoxazol-5-yl)propanamide (S)-N-benzyl-3-(diethylamino)-2-methyl-N-(3-phenylisoxazol-5-yl)propanamide |
4.204 | 4.203 | 0.001 |
| 23 |
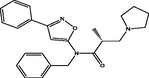 (R)-N-benzyl-2-methyl-N-(3-phenylisoxazol-5-yl)-3-(pyrrolidin-1-yl)propanamide (R)-N-benzyl-2-methyl-N-(3-phenylisoxazol-5-yl)-3-(pyrrolidin-1-yl)propanamide |
3.391 | 3.445 | −0.054 |
| 24 |
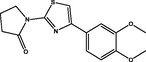 1-(4-(3,4-dimethoxyphenyl)thiazol-2-yl)pyrrolidin-2-one 1-(4-(3,4-dimethoxyphenyl)thiazol-2-yl)pyrrolidin-2-one |
3.549 | 3.594 | −0.045 |
| 25 |
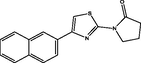 1-(4-(naphthalen-2-yl)thiazol-2-yl)pyrrolidin-2-one 1-(4-(naphthalen-2-yl)thiazol-2-yl)pyrrolidin-2-one |
3.578 | 3.532 | 0.046 |
| 26t |
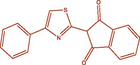 2-(4-phenylthiazol-2-yl)-1H-indene-1,3(2H)-dione 2-(4-phenylthiazol-2-yl)-1H-indene-1,3(2H)-dione |
3.443 | 3.641 | −0.198 |
| 27t |
 4,5,6,7-tetrachloro-2-(4-(p-tolyl)thiazol-2-yl)-1H-indene-1,3(2H)-dione 4,5,6,7-tetrachloro-2-(4-(p-tolyl)thiazol-2-yl)-1H-indene-1,3(2H)-dione |
3.573 | 3.416 | 0.157 |
| 28t |
 4,5,6,7-tetrachloro-2-(4-(3,4-dimethoxyphenyl)thiazol-2-yl)-1H-indene-1,3(2H)-dione 4,5,6,7-tetrachloro-2-(4-(3,4-dimethoxyphenyl)thiazol-2-yl)-1H-indene-1,3(2H)-dione |
3.655 | 3.905 | −0.250 |
Test set compounds are highlighted in red and designated with superscript (t).
2.2 Molecular structure optimization and descriptors calculation
Molecular structures of the dataset were drawn and optimized with parametric semi-empirical (PM3) quantum mechanics method using Spartan 14 software (Shao et al., 2006). The optimized structures were imported to PaDEL-Descriptors software (Yap, 2011) for calculation of molecular descriptors.
2.3 Dataset pretreatment
The calculated descriptors and the activity values for the dataset compounds were arranged in a
2.4 Descriptors transformation
Molecular properties are measured in different unit; while some had big absolute values other had small absolute values. During modeling, descriptors with higher value tend to find their way into the equation. In order to eliminate this bias and give all the descriptor equal opportunity to appear in the model, they were transformed by normalization (Tropsha, 2010):
In Eq. (1), xn is the normalized descriptor value; x is the raw descriptor value, xmax and xmin are the maximum and minimum descriptor values respectively in a descriptor column.
2.5 Dataset division
The dataset matrix in Microsoft excel spread sheet was imported into ModifiedK-Mediod 1.2 software used to divide it into training and test set using modified-K-mediods method proposed by Park and Jun (2009).
2.6 Model building
Training set data only was used in construction of models in the study and test set data was used to validate the model produced. Genetic function algorithm (GFA) module available in Material Studio 8.0 was used to select several combinations of descriptors that best explain the variation in activity data of the studied compounds. MLRplusValidation 1.3 (DTC) was used to construct and validate the models. GFA is a heuristic search method that finds exact or approximate solutions to any optimization problems (Rogers and Hopfinger, 1994). It had the advantage of producing more than one blends of descriptors that can be used to construct models. It allows the user control over the length of equation and uses lack of fit (LOF) function to check over-fitting in the models produced. The lack-of-fit is calculated with the equation below:
In Eq. (2), c is the number of basis functions, d is the smoothing parameter, M is the number of samples in the training set, LSE is the least square error and p is the total number of descriptors contained in all basis functions.
2.7 Multi-co-linearity analysis
The presence of high degree of correlation among the descriptors contained in the models was evaluated with variance inflation factor (VIF). The VIFi for a given descriptor i in a model was calculated with the equation below:
In Eq. (3), R2ij is the correlation coefficient of the multiple regression between the descriptor i and the remaining j descriptors in the model (Beheshti et al., 2016).
2.8 Model goodness of fit and validation
Relationship between the predicted versus actual activity value and standardized residual produced by the models versus actual activity values were used to access the goodness of fit of the models. Various internal and external validation parameters produced by the MLRplusValidation1.3 software were used to judge the models. The parameters evaluated include among others:
-
Determination coefficient R2:
Adjusted determination coefficient R2adj,:
Variance ratio F:
Leave one out cross-validation squared correlation coefficient Q2
Where PRESS is the predicted error sum of square obtained from the equation below:
In Eqs. (4)(8), Yobs and Ypred are experimental and predicted activity values respectively,
Randomization parameters
The response values of the training set data were randomly permuted without making any change to the descriptor matrix. Multiple linear regression analysis was performed on the permuted dataset and new R2r and Q2r values were obtained for the new model produced. The process was repeated severally with the computation of R2r and Q2r for each randomization runs. At the end, averages
In Eq. (9), R2 is the square correlation coefficient for the regression analysis of non-randomized model and
Squared correlation coefficient for test set R2Pred:
In Eq. (10), Yobs(test) and Ypred(test) are experimental and predicted activity values for the test set data respectively,
Golbraikh and Tropsha criteria parameters for a predictive model: R2pred > 0.6; Q2 > 0.5; r2 − r20/r2 < 0.1 and 0.85 ≤ k ≤ 1.15 or r2 − r′2/r2 < 0.1 and 0.85 ≤ k′ ≤ 1.15; and |r20 − r′20| < 0.3. In the criteria, r2 and r20 are regression coefficient of the plot of observed against predicted response for the test set data with and without intercept respectively, while k is the slope of this plot without intercept. r′2 and r′20 are regression coefficient of the plot of predicted against observed response for the test set data with and without intercept respectively and k′ is the slope of this plot without intercept.
2.9 Model applicability domain
The applicability domain (AD) of a QSAR model is the combination of the activity and descriptors space of the training set on which the model was constructed (Netzeva et al., 2005). It is only the activity of compounds in this space that can be predicted reliably by the model. The extent of extrapolation approach which is based on leverage (hi) values of the study compounds was used to define the AD of the QSAR model in the study. Compounds leverages (hi) are obtained as the diagonal element of hat matrix H:
In Eq. (11), X is the descriptor matrix and XT is the transpose of X. A warning leverage h∗ is computed for a given model:
In Eq. (12), k is the number of descriptors in the model and n is the number of compounds that made up the training set. The plot of the standardized prediction residual for each compounds activity data against their leverage value (Williams plot) gives a quick visual assessment of the AD of a model. The standardized prediction residual is computed:
In Eq. (13), y is the observe activity value for either the training or the test set,
3 Results and discussion
3.1 Dataset structure
Single column statistics performed on both training set and test set activity values showed that the maximum for test set was less than the maximum for the training set and the minimum for test set was greater than the minimum for training set. In addition, similarities existed in the values of mean and standard deviation of the activity values for both set (Table 2). These results indicated that the test set activity profile was obtained within the range of the training set activity profile and the variations in the activity distribution for both datasets were similar. Dissimilarity study was performed on the two set further expatiated that the test set data were obtained with the descriptors space of the training set data (i.e. the test set was interpolative of the training set) (Fig. 1).
| Training set | Test set | |
|---|---|---|
| Maximum | 4.625 | 4.421 |
| Minimum | 3.391 | 3.443 |
| Mean | 4.055 | 3.920 |
| Standard deviation | 0.362 | 0.344 |
| Range | 1.233 | 0.978 |
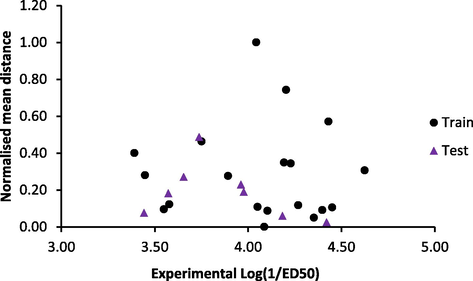
- Dissimilarity analysis of dataset compounds.
3.2 The QSAR model and its quality
The best GFA QSAR model produced in the study is presented below:
Log (1/ED50) = 3.885(±0.035) + 0.689(±0.057)VR1_Dzp + 0.969(±0.053)RDF35s − 1.772(±0.089)P2u (14)
In Eq. (14), values in the parenthesis are the standard deviation. The model is a trimetric equation obtained from 19 training set compounds. The models Topliss ratio is 6.333, therefore, the model obeyed the QSAR semi-empirical rule of thumb (Damme and Bultinck, 2007). Correlation and VIF analysis performed on descriptors contained showed that the highest correlation coefficient between any two descriptors in the model was 0.543 and the highest VIF value for any of the descriptors was 1.533 (Table 3). These values indicated the model is acceptable, stable and void of the multi-co-linearity problem (Beheshti et al., 2016). In addition, the t-statistics for all the descriptors are greater than 2, indicating that these descriptors contributed significantly to explain the variation in anticonvulsant activity of the studied compounds at 95% level. Fig. 2 showed that the distribution of the prediction standardized residual was even at the opposite sides of the line SDR = 0, indicating absence of systematic error in the model. In addition, linear relationship existed between the experimental and predicted activity values by the model for both training and test set data (Fig. 3).
| Descriptors | VR1_Dzp | RDF35s | P2u | VIF | t-stat. |
|---|---|---|---|---|---|
| VR1_Dzp | 1 | 1.420 | 11.944 | ||
| RDF35s | 0.215 | 1 | 1.132 | 18.239 | |
| P2u | 0.543 | 0.340 | 1 | 1.533 | −19.725 |
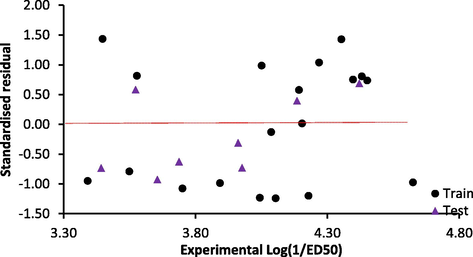
- Plot of standardized residual against experimental activity value.
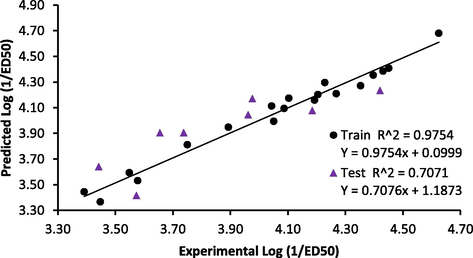
- Relationship between experimental and predicted activity by the model.
3.3 Model validation
Detailed Validation parameters produced by MLRplusValidation 1.3 for the model are presented in Table 4. In the table, values for R2; R2adj; Q2; cRp2 and R2pred were greater 0.6. These results showed that the explained variance by the model was higher than the unexplained one (Tropsha, 2010); the model had good internal and external predictive ability and it is not a product of chance correlation (Tropsha, 2010). The models SEE was less than the standard deviation of the training set activity data (0.362) (Table 1), this showed that model was not over-fitted (Damme and Bultinck, 2007). This was further supported by the absolute value of the difference between R2 and Q2 that was less than 0.3 (Eriksson et al., 2003). The model variance ratio F was greater critical F-value (3.29) for 3, 15 degree of freedom at 95% level. This meant that the probability that the model is significant at 95% was high. Furthermore, the model passed all Golbraikh and Tropsha (2002) criteria for a predictive model (Table 4).
| Parameters | Model scores | Threshold | Comments | Refs. |
|---|---|---|---|---|
| R2 | 0.975 | R2 > 0.5 | Passed | Tropsha (2010) |
| R2adj | 0.971 | R2adj > 0.5 | Passed | Tropsha (2010) |
| F3,15 | 198.053 | Large | Passed | Tropsha (2010) |
| Q2 | 0.959 | Q2 > 0.5 | Passed | Tropsha (2010) |
| SEE | 0.062 | Low | Passed | Damme and Bultinck (2007) |
| |R2 − Q2| | 0.016 | |R2 − Q2| < 0.3 | Passed | Eriksson et al. (2003) |
| R2Pred | 0.761 | R2pred > 0.6 | Passed | Tropsha (2010) |
| r2 | 0.707 | r2 > 0.6 | Passed | Golbraikh and Tropsha (2002) |
| r02 | 0.707 | |||
| r′20 | 0.575 | |||
| |r02 − r′02| | 0.132 | |r02 − r′02| < 0.3 | Passed | Golbraikh and Tropsha (2002) |
| k | 0.986 | 0.85 < k < 1.15 | Passed | Golbraikh and Tropsha (2002) |
| (r2 − r02)/r2 | 0.0002 | ((r2 − r02)/r2) < 0.1 | Passed | Golbraikh and Tropsha (2002) |
| k′ | 1.013 | 0.85 < k′ < 1.15 | Passed | Golbraikh and Tropsha (2002) |
| (r2 − r′02)/r2 | 0.187 | ((r2 − r'02)/r2) < 0.1 | Passed | Golbraikh and Tropsha (2002) |
| Random model | ||||
|
|
0.462 |
|
Passed | Tropsha et al. (2003) |
|
|
0.259 |
|
Passed | Tropsha et al. (2003) |
|
|
−0.285 |
|
Passed | Tropsha et al. (2003) |
| cRp2 | 0.887 | cRp2 > 0.5 | Passed | Roy (2007) |
3.4 Models applicability domain and outlier detection
The extent of extrapolation used to define AD in the study showed that the warning leverage for the model h∗ was 0.63. Therefore, the AD of the model is defined by a square area bounded by 0 < h < 0.63 and −3 < SDR < 3 as presented by the models Williams plot (Fig. 4). The figure showed that all the training set and test set data had leverage values and standardized residual values within AD boundary except for compound 16 with leverage value (0.639) > h∗. Indicating only one influential compound exist in the dataset. In summary, the model reported in the study had good internal and external predictive ability and can be used to screen test set compounds or a set of new chemicals in silico that are within its applicability domain.
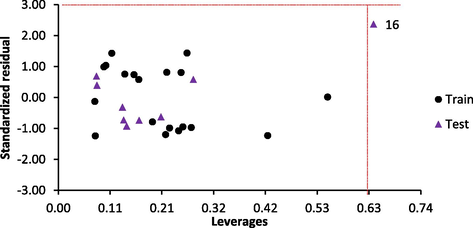
- Williams plot for the model.
3.5 Interpretation of descriptors
The degree of contribution of each descriptor to the model was evaluated with mean effect value (MFj):
In Eq. (15),
| Descriptors | Definition | MFi |
|---|---|---|
| VR1-Dzp | Randic-like eigenvector-based index from Barysz matrix/weighted by polarizabilities | 1.617 |
| P2u | 2nd component shape directional WHIM index/unweighted | 3.026 |
| RDF35s | Radial distribution function – 035/weighted by relative I-state | −3.642 |
VR1-Dzp is the first descriptor in the model and it had positive mean effect. This meant that increase in the value of VR1-Dzp increases the anticonvulsant activity of the studied compounds. The value of this descriptor is proportional to the electronegativity value of added substituent (Todeschini and Consonni, 2009)). P2U is the second descriptor in the model and it also had positive mean effect. The value of this descriptor increases with increase in linearity of molecules which can be enhanced by the addition of new chain, addition of atoms with higher molecular weight and minimizing the presence of CH3 (Todeschini and Gramatica, 2002). RDF50s is the last descriptors in the model and had negative mean effect. Its occurrence in the model indicated that a linear relationship existed between 3D molecular distributions of inductive effect at a radius of 3.5 Å from a specific geometrical center of the molecule. The greater the effect of induction at this radius, the greater the RDF value (Todeschini and Consonni, 2009).
3.6 Molecular docking studies
Optimized 3D structure of compounds with lowest and highest activity value in the training and test set (compounds 7, 11, 23 and 26) were saved as .sdf file and were imported into pyrx software, where they were converted to PDBQT file. PM3 semi-empirical method available in Spartan 14 software was used to optimize the studied compounds. Crystal structure of γ-aminobutyrate aminotransferase (GABA_AT) (PDB:1OHV) was downloaded from protein data bank. The downloaded .pdb file was prepared using Discovery Studio software by removing its water molecules and other unwanted chain and heteroatam. The cleaned .pdb file was imported into pyrx software, where it was converted to PDBQT file. Autodock vina present in the pyrx was used to dock the prepared studied molecule (ligands) with the prepared GABA_AT (target). Autodock vina uses Lamarckian genetic algorithm for the docking exercise (Trott and Olson, 2010).
The docking result presented in Table 6 showed that compounds with increase linearity and highly electronegative atoms had higher binding energy. As can be seen with compounds 26 had the highest binding affinity. This may be attributed to it binding with His 206 in a halogen-halogen interaction; Arg445 in a π-cation interaction and Glu270 in a π-anion interaction. This is in tandem with the conclusion of the proposed model. Also, almost all the molecule had binding affinity greater than that of vigabatrin (a known inhibitor of GABA_AT). The studied compounds bonded with a target via varying amino acids and their bonding were not similar to that of vigabatrin. Hence the study compounds may inhibit GABA_AT via a different mechanism. Presented in Fig. 5 are the docking pose for the compounds showing the atoms that were involved hydrogen bonding and other interactions
| Molecule | Molecule structure and IUPAC names | BA (kcal mol−1) | HB AC | Hydrophobic interaction | |
|---|---|---|---|---|---|
| AC | Type | ||||
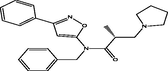
| 7 |
 (R)-N-ethyl-2-methyl-N-(3-phenylisoxazol-5-yl)-3-(piperidin-1-yl)propanamide (R)-N-ethyl-2-methyl-N-(3-phenylisoxazol-5-yl)-3-(piperidin-1-yl)propanamide |
−18.322 | Arg192; Thr353 | Phe189; Phe351; | π-π |
| Ile72 | R-R | ||||
| Hie44; Tyr69; His206; Tyr348 | π-R | ||||
| 11 |
 (R)-N-((S)-sec-butyl)-2-methyl-N-(3-phenylisoxazol-5-yl)-3-(pyrrolidin-1-yl)propanamide (R)-N-((S)-sec-butyl)-2-methyl-N-(3-phenylisoxazol-5-yl)-3-(pyrrolidin-1-yl)propanamide |
-10.228 | Arg192; His206 | Ile72 | R-R |
| Phe189;His206;Tyr348;Phe351; Ile72; Ile105 | π-R | ||||
| 23 | |||||
 (R)-N-benzyl-2-methyl-N-(3-phenylisoxazol-5-yl)-3-(pyrrolidin-1-yl)propanamide (R)-N-benzyl-2-methyl-N-(3-phenylisoxazol-5-yl)-3-(pyrrolidin-1-yl)propanamide |
−15.170 | Gln301; Lys329; Thr353 | Phe189 | π-π | |
| Val300; Ile72 | R-R | ||||
| Phe189; Phe351; Val300 | π-R | ||||
| 26 |
 2-(4-phenylthiazol-2-yl)-1H-indene-1,3(2H)-dione 2-(4-phenylthiazol-2-yl)-1H-indene-1,3(2H)-dione |
−16.201 | Hie44; Lys203; His206; Gly438 | His206 | X-X |
| Arg445 | π-C+ | ||||
| Glu270 | π-A- | ||||
| Lys203; Ile72; Ile105 | R-R | ||||
| His206;Tyr348Phe351; Ile426 | π-S | ||||
| Vigabatrin |
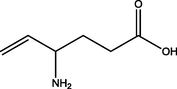 4-aminohex-5-enoic acid 4-aminohex-5-enoic acid |
−10.97 | Tyr69, Tyr348, Glu270 | His206 | π-R |
Note: BA is binding affinity; HB is hydrogen bonding, AC is amino acid and R-R, X-X, π-R represents alkyl-alkyl, halogen-halogen and pi-alkyl interractions respectively.
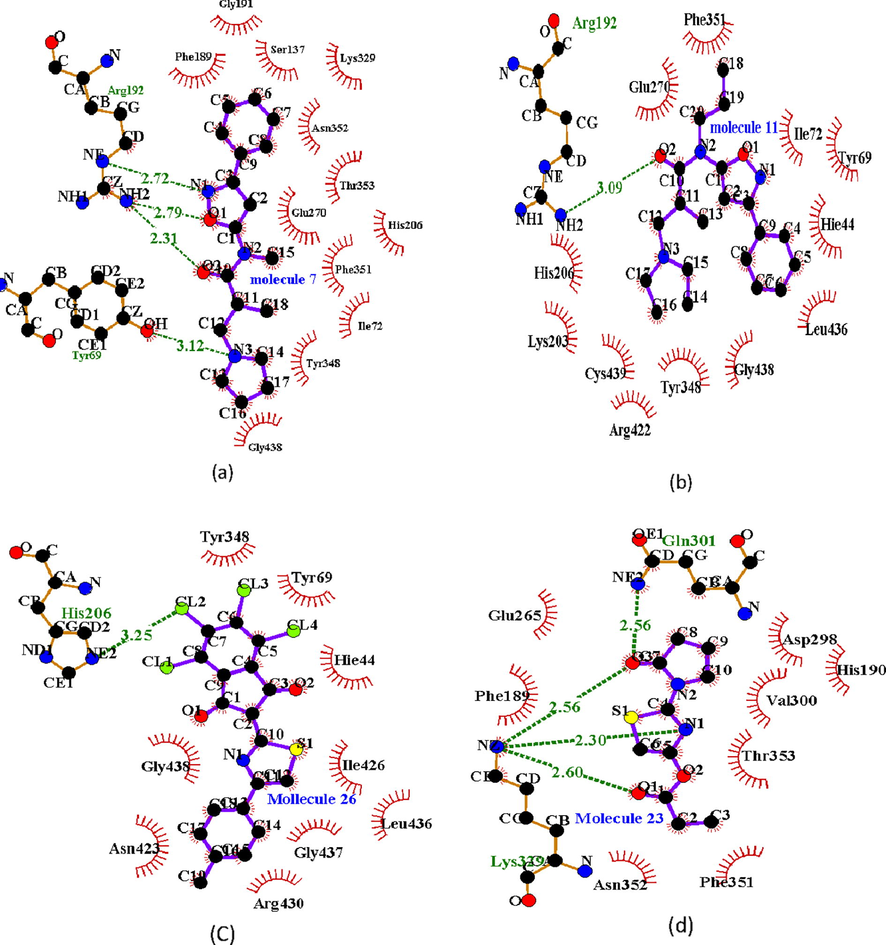
- 2D Docking pose for (a) molecule 7; (b) molecule 11; (c) molecule 26 and (d) molecule 23 with GABA_AT.
4 Conclusion
Quantitative structure-activity relationships study on the studied isoxazole and thiazole derivatives revealed that VR1-Dzp, P2u, and RDF35s molecular descriptors had a significant influence on the anticonvulsant activity of the studied compounds. These descriptors showed that increasing the linearity of the molecule and presence of an electronegative element in the molecular system enhances the anticonvulsant activity of the studied compounds. Molecular docking analysis result was in phase with the QSAR result. The QSAR model was statistically reliable, predictive, and robust with a well-defined applicability domain. Sufficient interpretation was provided for the model descriptors. The model is suitable for designing new derivative of the studied compounds with the view of optimizing their anticonvulsant activity
References
- Prospects for novel antiepileptic drugs. Curr. Opin. Investig. Drugs Lond. Engl.. 2003;2000(4):805-814.
- [Google Scholar]
- QSAR modeling of antimalarial activity of urea derivatives using genetic algorithm–multiple linear regressions. J. Saudi Chem. Soc.. 2016;20:282-290.
- [Google Scholar]
- Chtita, S., Larif, M., Ghamali, M., Adad, A., Rachid, H., Bouachrine, M., Lakhlifi, T., 2013. Studies of two different cancer cell lines activities (MDAMB-231 and SK-N-SH) of imidazo [1, 2-a] pyrazine derivatives by combining DFT and QSAR results. Studies 2. Int. J. Innov. Res. Sci. Eng. Tech. 2(11), 6586–6600.
- A new computer program for QSAR-analysis: ARTE-QSAR. J. Comput. Chem.. 2007;28:1924-1928.
- [Google Scholar]
- Nicotinic acid hydrazone: a novel anticonvulsant pharmacophore. Eur. J. Med. Chem.. 1995;30:303-314.
- [Google Scholar]
- Methods for reliability and uncertainty assessment and for applicability evaluations of classification-and regression-based QSARs. Environ. Health Perspect.. 2003;111:1361.
- [Google Scholar]
- In silico studies for the rational discovery of anticonvulsant compounds. Bioorg. Med. Chem.. 2000;8:2755-2770.
- [Google Scholar]
- Synthesis and anticonvulsant activity of a class of 2-amino 3-hydroxypropanamide and 2-aminoacetamide derivatives. Bioorg. Med. Chem.. 2006;14:3263-3274.
- [Google Scholar]
- Application of a genetic algorithm and an artificial neural network for global prediction of the toxicity of phenols to Tetrahymena pyriformis. Monatsh. Chem.-Chem Mon.. 2009;140:1279-1288.
- [Google Scholar]
- Rare deletions at 16p13. 11 predispose to a diverse spectrum of sporadic epilepsy syndromes. Am. J. Hum. Genet.. 2010;86:707-718.
- [Google Scholar]
- Current status of methods for defining the applicability domain of (quantitative) structure-activity relationships. ATLA. 2005;33:155-173.
- [Google Scholar]
- A simple and fast algorithm for K-medoids clustering. Exp. Syst. Appl.. 2009;36(2):3336-3341.
- [Google Scholar]
- Application of genetic function approximation to quantitative structure-activity relationships and quantitative structure-property relationships. J. Chem. Inf. Comput. Sci.. 1994;34:854-866.
- [Google Scholar]
- On some aspects of validation of predictive quantitative structure–activity relationship models. Expert Opin. Drug Discov.. 2007;2:1567-1577.
- [Google Scholar]
- Designing of sulfanilamide/sulfacetamide derivatives as human topoisomerase II inhibitor: a docking approach. Am. J. Pharmacol. Sci.. 2014;2:42-46.
- [Google Scholar]
- Advances in methods and algorithms in a modern quantum chemistry program package. Phys. Chem. Chem. Phys.. 2006;8:3172-3191.
- [Google Scholar]
- Design, synthesis and in vivo anticonvulsant screening in mice of novel phenylacetamides. Eur. J. Med. Chem.. 2006;41:786-792.
- [Google Scholar]
- Epilepsy: a review of selected clinical syndromes and advances in basic science. J. Cereb. Blood Flow Metab.. 2006;26:983-1004.
- [Google Scholar]
- Isoxazole derivatives as centrally acting muscle relaxants. II.: Synthesis and structure-activity relationship of 3-amino-n-(3-phenyl-5-isoxazolyl) propanamides. Chem. Pharm. Bull. (Tokyo). 1986;34:1643-1655.
- [Google Scholar]
- Synthesis and anticonvulsant activity of 1-phenylcyclohexylamine analogs. J. Med. Chem.. 1990;33:1452-1458.
- [Google Scholar]
- Todeschini, R., Consonni, V., 2009. Molecular descriptors for chemoinformatics, volume 41 (2 volume set). John Wiley & Sons.
- Todeschini, R., Gramatica, P., 2002. New 3D molecular descriptors: the WHIM theory and QSAR applications, in: 3D QSAR in Drug Design. Springer, pp. 355–380.
- Best practices for QSAR model development, validation, and exploitation. Mol. Inform.. 2010;29:476-488.
- [Google Scholar]
- The importance of being earnest: validation is the absolute essential for successful application and interpretation of QSPR models. Mol. Inform.. 2003;22:69-77.
- [Google Scholar]
- AutoDock Vina: improving the speed and accuracy of docking with a new scoring function, efficient optimization, and multithreading. J. Comput. Chem.. 2010;31:455-461.
- [Google Scholar]
- PaDEL-descriptor: An open source software to calculate molecular descriptors and fingerprints. J. Comput. Chem.. 2011;32:1466-1474.
- [Google Scholar]


