

Translate this page into:
In-silico studies of some oxadiazoles derivatives as anti-diabetic compounds
⁎Corresponding author. muhdtk1988@gmail.com (Muhammad Tukur Ibrahim)
-
Received: ,
Accepted: ,
This article was originally published by Elsevier and was migrated to Scientific Scholar after the change of Publisher.
Peer review under responsibility of King Saud University.
Abstract
An in-silico study was performed to investigate the anti-diabetic activities of 27 Oxadiazoles derivatives. The anti-diabetic compounds were optimized using Density Functional Theory (DFT) method utilizing B3LYP version with 6-31G∗ basis set. Genetic Function Algorithm (GFA) was used to build four models. Model 1 was chosen as the best model, assessed and found to be statistically significant with LOF = 0.030552, R2 = 0.9681, R2adj = 0.9567, Q2CV = 0.9364 and R2pred = 0.6969. The results of the molecular docking studies revealed that ligand 10, 13 and 15 have the highest docking scores of −9.9 kcal/mol among the co-ligands. This study has shown that the docking scores generated were in good agreement with the work reported by other researchers. The results of this study give room for designing new anti-diabetic compounds with better inhibitory activity against α-glucosidase, an enzyme that catalyzes the hydrolysis of carbohydrate to produce excess glucose.
Keywords
QSAR
Molecular docking
Oxadiazoles
α-glucosidase
Anti-diabetic compounds

1 Introduction
Type 2 Diabetes mellitus (T2DM) is a critical metabolic failure characterized by less insulin action and high blood glucose level (Kenchappa et al., 2017). T2DM Is referred to as the fastest worldwide threat to human health (Kavitha et al., 2017) and It leads to Kidney disease, blindness, and lower limb amputation (Datar and Deokule, 2014; Khan et al., 2014). According to World Health Organization, if action is not taken by 2030, there will be at least 350 million people in the world with T2DM (Taha et al., 2016a).
α -Glucosidase is an enzyme that catalyzes the hydrolysis of carbohydrate to produce excess glucose. It is located in the epithelium tissue of the small intestine (Taha et al., 2015). α -Glucosidase inhibitors are classes of medications used to treat T2DM by inhibiting α-glucosidase.
Heterocyclic compounds are organic compounds containing nitrogen, oxygen, and sulfur with numerous applications in the field of agriculture, pharmacy, and industries (Dua et al., 2011). Oxadiazoles are five-membered ring heterocyclic compounds containing oxygen and nitrogen atoms (Patel et al., 2010). A new derivative of 6-Hydroxyaurone Analogues has been reported as a potent anti-diabetic agent against α-glucosidase (Sun et al., 2017). A large number of compounds having 1, 3, 4-oxadiazole ring have been reported to be active anti-diabetic agents (Taha et al., 2017c). Apart from α-glucosidase inhibitors (Taha et al., 2018). Other biological activities have been reported for molecules having 1, 3, 4-oxadiazole ring which includes; anti-glycation (Taha et al., 2016b), anti-leishmanial (Taha et al., 2017b), and β-glucuronidase inhibitors (Taha et al., 2017a). New drugs are usually collected using trial and error methods, which are time-consuming and expensive.
With an increase in computational power, an in-silico study has led to the evaluation of new active drugs with a fewer side effect (Abdulfatai et al., 2017). Molecular docking studies have been conducted to predict the binding affinities of different compounds and to illustrate specific areas of interaction between the ligands and the receptor (Amit et al., 2014; Boukarai et al., 2017) and (Wang et al., 2016). The aim of this study was to investigate the anti-diabetic properties of oxadiazole derivatives via QSAR and molecular docking.
2 Materials and method
2.1 QSAR studies
2.1.1 Dataset collection
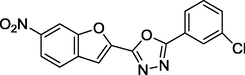
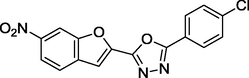
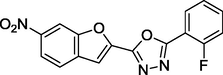
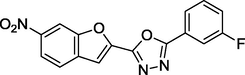
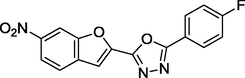
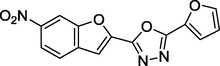
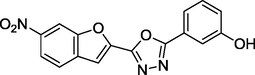
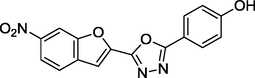
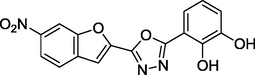
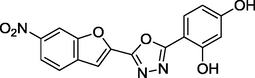
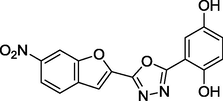
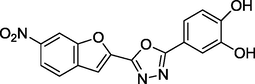
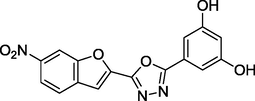
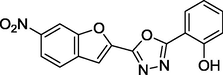
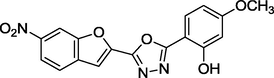
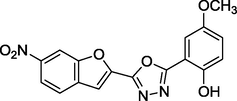
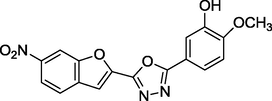
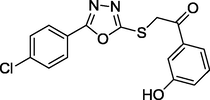
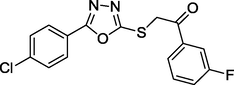
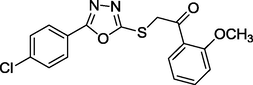
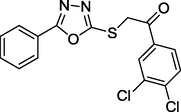
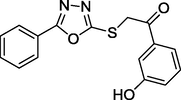
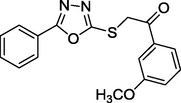
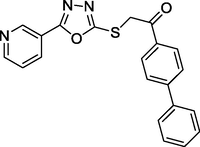
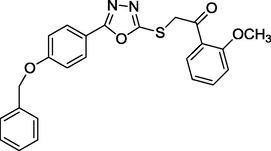
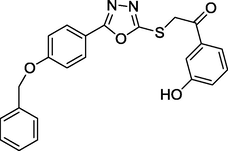
27 sets of Oxadiazoles compounds and their anti-diabetic activities against α-glucosidase were gotten from the literature (Kashtoh et al., 2014; Taha et al., 2016b) and used for this study. The experimental activities of these compounds calculated as IC50 (μM) were convert to pIC50 (pIC50 = log1/IC50). Table 1 shows the structures and the anti-diabetic activities of these molecules. The anti-diabetic activities of these molecules range from 1.07 to 2.37 (μM) as expressed in pIC50 logarithm scale.
S/No
Structures
pIC50
1

1.37
2
1.97
3
1.86
4
1.13
5
1.8
6
1.72
7
2.37
8
1.72
9
1.63
10
1.11
11
1.26
12
1.37
13
1.35
14
1.66
15
1.46
16
2.12
17
2.21
18
2.2
19
1.38
20
1.69
21
1.91
22
1.87
23
2.05
24
2.26
25
2.1
26
1.07
27
1.25
2.1.2 Geometry optimization
ChemDraw Ultra version 12.0 software was used to draw the 2D structure of the compounds and save as cdx file format. The structures were then converted to 3D using Spartan 14.0 version 1.1.2 software. Density functional theory (DFT) using the B3LYP version and 6-311G∗ basis set, was employed for complete geometry optimization of the structures (Abdulfatai et al., 2016).
2.1.3 Molecular descriptors calculation
0D, 1D, 2D and 3D descriptors were calculated using PaDEL descriptor software version 2.18 and saved as sdf file format from the optimized structures of the Spartan files, (Yap, 2011).
2.1.4 Dataset division
Kennard–Stone Algorithm was used to split the dataset into training and test set using (Kennard and Stone, 1969). 75% of the dataset goes to the training set used and the remaining 25% as the test sets used for external validation of the built model.
2.1.5 Model building
Regression analysis was performed using Genetic Function Algorithm (GFA) method in material studio software with the biological activities (pIC50) as the dependent variable and the physicochemical properties (descriptors) as independent variables.
2.1.6 Internal validations
The built models were assessed using Friedman’s Lack of Fit (LOF) which served as a measure of fitness of a model. Below is the revised formula for the Friedman’s lack of fit.
SEE is the standard error of estimation which equals to the standard deviation of the model and a model is said to be good when it has lower SEE value. SEE is given as:
The structure of the regression model takes the form (Arthur et al., 2016):
R2 gives an account of the fragment of total variation of the model. The closer the value of R2 is to 1.0, the better the model generated. The most frequently used internal assessment parameter for QSAR model is R2 and is shown below:
Adjusted R2 (R2adj) value changes directly with an increase in the number of descriptors; R2 is not suitable for measuring the stability of a model. In order to have a reliable and stable model, R2 needs to be adjusted. The adjusted R2 is defined as follows:
The cross-validation coefficient (Qcv2) is used to determine the strength of a QSAR model to predict the activity of new compounds. Qcv2 is represented as:
2.1.7 External validation
The external validation of the generated model is assessed based on the R2 test value and is defined as:
2.1.8 Applicability domain
Applicability domain of a QSAR model is employed to determine outliers and influential compounds and to affirm the reliability and robustness of the model generated (Tropsha et al., 2003). Leverage is one of the techniques used in evaluating the applicability domain of a QSAR model and is given for a chemical compound as hi:
2.1.9 Quality assurance of the model
Internal and external validations parameters are used to assess the reliability and predictive ability of a QSAR model. Table 2 gives the general minimum requirement values for the assessment of a QSAR model (Veerasamy et al., 2011).
Symbol
Name
Value
R2
Co-efficient of determination
≥0.6
P(95%)
Confidence interval at 95% confidence level
<0.05
Q2
Cross-Validation Co-efficient
≥0.5
R2-Q2
Difference between R2 and Q2
<0.3
N(ext, & test set)
Minimum number of external and test set
≥5
R2ext
Co-efficient of determination of external and test set
≥0.5
2.2 Molecular docking studies
Protein-Ligand docking studies on 27 oxadiazoles derivatives were performed to study the interaction between the binding pocket of α-glucosidase enzyme and the ligands on Hp G62 computer system, with Intel ® Core™ i3 Dual CPU, M330 @2.13 GHz 2.13 GHz, 4 GB of RAM using Auto dock vina 4.2 of pyrex virtual screening software, Chimera version 1.10.2 and Discovery studio software.
2.2.1 Ligands preparation
The optimized structures of the compounds from Spartan’14 were saved as PDB file format for the docking studies (Abdulfatai et al., 2017). Fig. 1 shows the prepared structure of the ligand.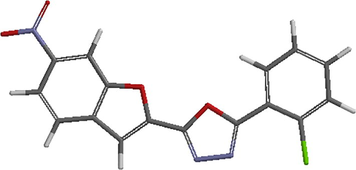
3D structure of the prepared ligand.
2.2.2 Preparation of receptor
The 3D structure of the receptor (Saccharomyces cerevisiae isomaltase) with the PDB code 3AJ7 was retrieved from Protein Databank (PDB). Discovery studio software was to prepare the receptor by removing water molecules and cofactors (Veerasamy et al., 2011) and save as PDB file format. Fig. 2 shows the prepared structure of the receptor.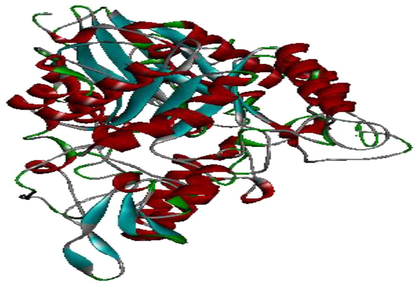
3D structure of the prepared receptor.
2.2.3 Docking of the ligands with the receptor using autodock version 4.0 of pyrex software
The docking of ligands (oxadiazole derivatives) with the receptor (α-glycosidase) was done using Autodock version 4.0 of pyrex software (Trott and Olson, 2010). Chimera 1.10.2 software was used to build the complex (ligand-receptor) since the receptor and the ligand decoupled after carrying out docking with the autodock vina of pyrex. The ligand-receptor were visualized to view their interactions using Discovery studio visualizer.
3 Results and discussion
3.1 QSAR results of the Oxadiazoles derivatives
Genetic function algorithm of material studio software was used to generate four QSAR models. Out of these four models, model 1 was chosen as the best model based on its statistical significance as it has Friedman’s Lack of fit value of 0.030552, the highest R2 value of 0.9681, R2adj value of 0.9567, Qcv2 value of 0.9364 and the R2pred value of 0.6969. The internal and external validation parameters of model 1 passed the minimum standard for a reliable QSAR model as given in Table 2.
Model 1
pIC50 = − 0.228309072 * AATS6s + 0.045721007 * ATSC3i + 9.007861457 * MATS1m + 0.110342533 * VE3_Dt + 61.318483952 * JGI9 + 3.876735855.
LOF = 0.030552, R2trng = 0.968094, R2adj = 0.956699, Q2LOO = 0.936427, N trng = 20, R2test = 0.696907, N test = 7
The list of the descriptors, their descriptions, and classes for model 1 were presented in Table 3. The negative coefficients of the descriptor AATS6s mean that decrease in this descriptor will increase the anti-diabetic activity (pIC50) against α-glycosidase enzyme. Furthermore, the Positive coefficient of ATSC3i, MATS1m, VE3_Dt, and JGI9 descriptors implies that increasing such physiochemical parameters will increase the inhibitory activities of the Oxadiazole derivatives against α-glycosidase enzyme.
S/No
Symbol
Description
Class
1
AATS6s
Average centered Broto-Moreau autocorrelation – lag 6/weighted by I-state.
2D
2
ATSC3i
Centered Broto-Moreau autocorrelation – lag 3/weighted by first ionization potential
2D
3
MATS1m
Moran autocorrelation – lag 1/weighted by mass
2D
4
VE3_Dt
The logarithmic coefficient sum of the last eigenvector from detour matrix
2D
5
JGI9
Mean topological charge index of order 9
2D
Fig. 3 shows the plot of predicted activities of both the training and the test sets against the experimental activities (pIC50). We can see from the plot that the strength of the model was confirmed as the predicted R2 value was in agreement with the R2 value of 0.7085 extrapolated in the graph.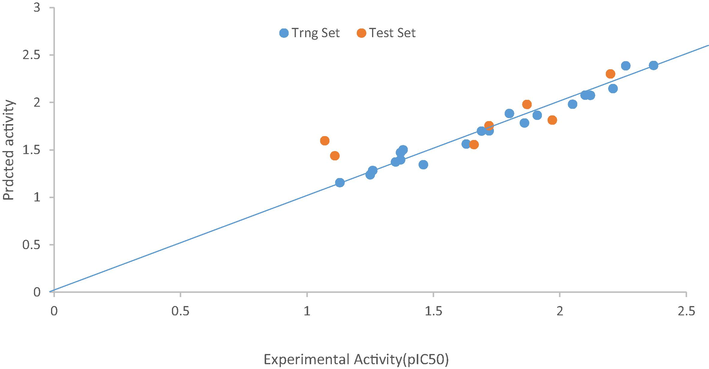
The plot of the experimental and predicted activity of both the training and test sets of model 1.
The random propagation of the standardized residuals on both sides of zero on Fig. 4 means that there was no systematic error in the built model. The experimentally determined activity correlates with the predicted activity as presented in Table 4. The Predicted activities and residuals of model 1 for the test set were presented in Table 5A. Table 5B shows the predictive R2 of model 1 which confirmed its stability, reliability, and robustness. x = training set.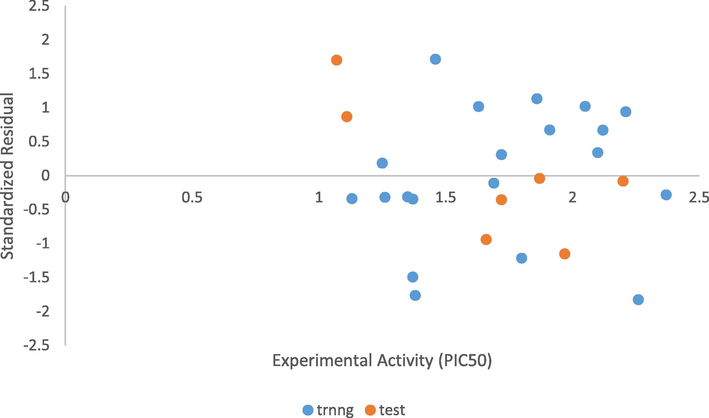
The plot of standardized residual activity vs experimental activity.
S/No
pIC50
Predicted (pIC50)
Residual
1×
1.37
1.471973
−0.10197
3×
1.86
1.78263
0.07737
4×
1.13
1.153112
−0.02311
5×
1.8
1.883082
−0.08308
7×
2.37
2.389227
−0.01923
8×
1.72
1.698894
0.021106
9×
1.63
1.560508
0.069492
11×
1.26
1.281738
−0.02174
12×
1.37
1.393623
−0.02362
13×
1.35
1.371306
−0.02131
15×
1.46
1.342664
0.117336
16×
2.12
2.074292
0.045708
17×
2.21
2.145589
0.064411
19×
1.38
1.500609
−0.12061
20×
1.69
1.69746
−0.00746
21×
1.91
1.8639
0.0461
23×
2.05
1.980293
0.069707
24×
2.26
2.384813
−0.12481
25×
2.1
2.076754
0.023246
27×
1.25
1.237535
0.012465
S/No.
pIC50
AATS6s
ATSC3i
MATS1m
VE3_Dt
JGI9
Yprd
YPrd -Yobs
2y
1.97
4.71789
−18.8368
0.027668
−8.88176
0.010406
1.845616
−0.12438
6y
1.72
5.846491
−19.4003
0.055399
−7.78663
0.007372
1.7468
0.0268
10y
1.11
5.015152
−23.047
−0.00592
−7.32121
0.010116
1.437137
0.327137
14y
1.66
5.328395
−23.0016
−0.00592
−6.73567
0.012715
1.591681
−0.06832
18y
2.2
4.454218
−20.2628
0.040483
−5.50237
0.009501
2.273457
0.073457
22y
1.87
3.477978
−24.438
0.011158
−4.58979
0.00739
2.012533
0.142533
26y
1.07
3.014347
−35.2293
0.070446
−10.1925
0.006678
1.497225
0.427225
y = testset
S/No.
(Yprd-Yobs)2
Ymntrng
Yobs-Ymntrng
(Yobs-Ymntrng)2
2y
0.015471
1.7145
0.2555
0.06528
6y
0.000718
1.7145
0.0055
3.03E−05
10y
0.107019
1.7145
−0.6045
0.36542
14y
0.004667
1.7145
−0.0545
0.00297
18y
0.005396
1.7145
0.4855
0.23571
22y
0.020316
1.7145
0.1555
0.02418
26y
0.182521
1.7145
−0.6445
0.41538
Σ(Yprd-Yobs)2 = 0.3361
Σ(Yobs-Ymntrng)2 = 1.1089
Therefore R2 = (1-
) = 0.6969
Table 6 represents the correlation matrix of the descriptors of model 1 and found to be highly correlated which means that the descriptors used to build the model are very good.
AATS6s
ATSC3i
MATS1m
VE3_Dt
JGI9
AATS6s
1
ATSC3i
0.753534
1
MATS1m
−0.30762
−0.36403
1
VE3_Dt
0.077776
0.437029
−0.51926
1
JGI9
0.523658
0.451096
−0.71465
0.157048
1
The Williams plot of the standardized residuals against leverages is presented in Fig. 5. 3 influential compounds with S/No. 2, 6 and 26 were discovered from the plot and were part of the test set. It is evident that the influential compounds with leverages higher than the warning leverage h*(h∗ = 0.9) are structurally different from other compounds of the dataset.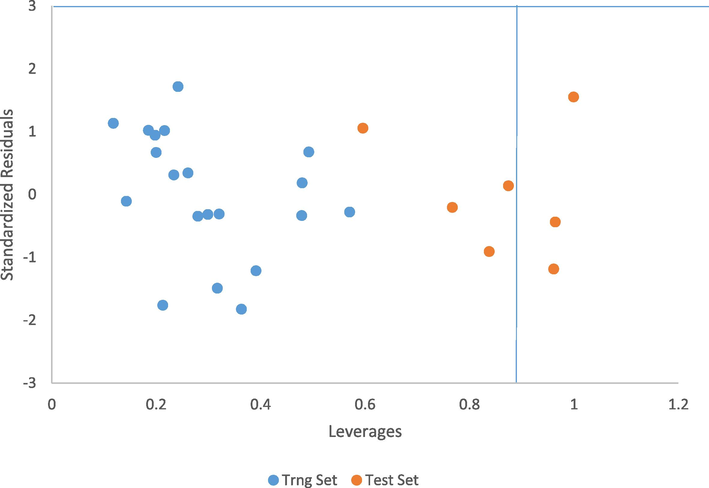
Williams plot of the standardized residual and leverages of both the training and test.
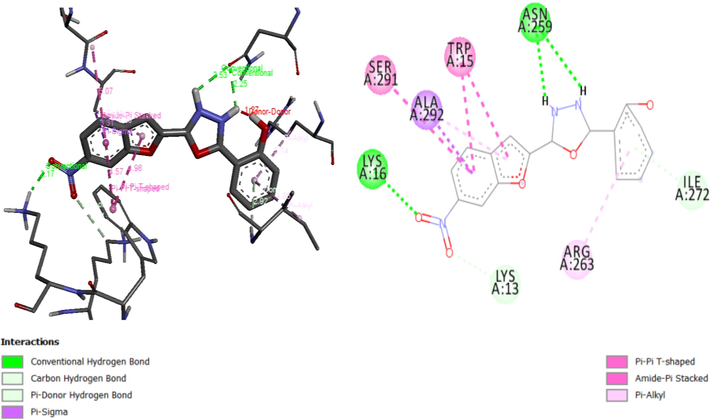
3.2 Results of molecular docking studies of oxadiazole derivatives
Molecular docking studies on 27 Oxadiazole derivatives (inhibitors) against α-glycosidase (receptor) were carried out. All the ligands showed high docking scores (that is low energy values) which falls within the range of −8.2 to −9.9 kcal/mol as shown in Table 7. Ligands 10, 13 and 15 have the highest docking scores of −9.9 kcal/mol. Ligand 10 being among the ligands with the highest docking scores form 3 interactions: Hydrophobic, hydrogen bond, and carbon-hydrogen bond interactions. Hydroxyl groups of the phenyl ring of the ligand formed a hydrogen bond with Leu297 (2.2363 Å), Ser298 (2.2189 Å), Thr290 (2.4152 Å), Asp341 (2.0036 Å). Nitrogen 1 of the Oxadiazoles moiety formed a hydrogen bond with Ala292 (3.7179 Å). Arg263 form carbon-hydrogen bond with a nitrobenzofuran moiety of the ligand. The Ligand also formed hydrophobic interactions with the residues Ser291, Trp15, Ala292 and Arg263 as shown in Fig. 6A. Figs. 6B and 6C give the 3D and 2D structure of ligand 13 and 15.
Ligands
Binding Energy(kcal/mol)
Hydrophobic Interactions
Electrostatic/Other Interactions
Hydrogen Bonds
Hydrogen Bond Distance (Å)
1
−9.5
TYR158, ARG315 and LYS156
ARG442 and GLU411
GLU411, ARG442 and ARG442
2.45988, 2.56427 and 2.39434
2
−9.6
ALA292, TRP15, TRP15 and ARG263
LEU297, ASN259, GLU296, LYS16 and LYS13
2.1837, 2.1989, 2.2826, 2.7578 and 3.0331
3
−9.4
TYR158, and LYS156
GLU411
GLU411, ARG442, ARG442 and SER240
1.9910, 2.6318, 2.4242 and 3.5081
4
−9.6
TYR158 and LYS156
ARG442, GLU411 and LEU313
GLU411, ARG315, ARG442, ARG442 and PHE314
2.3989, 2.3469, 2.5542, 2.4076 and 3.3223
5
−9.5
PHE178 and ARG315
ASP352 and ARG442
TYR158, GLU411, ARG442
2.5204, 2.9205 and 2.231
6
−9.5
PHE178 and ARG315
ASP352, ASP215, and GLU277
TYR158 and GLU411
2.5216 and 2.9019
7
−9.3
ALA292, TRP15 and ILE272
ASN259, GLU296, LYS16, and LYS13
2.1945, 2.4539, 2.8746 and 3.0918
8
−9.5
ALA292, TRP15, SER291, ALA292, ARG263 and ILE272
ASN259, GLU296, LEU297, SER298 and ARG292
2.35371, 2.6503, 2.4679, 2.9459 and 3.3034
9
−9.8
PHE178 and ARG315
ASP352
TYR158, GLU411 and GLU277
2.4532, 2.9738 and 2.8302
10
−9.9
ALA292, TRP15, SER291 and ARG263
LEU297, SER298, THR290, ASP341 and ALA292
2.2363, 2.2189, 2.4152, 2.0036 and 3.7179
11
−9.5
TYR158 and LYS156
GLU411
GLU411, LYS156, ARG442 and ARG442
1.9244, 2.3006, 2.6339 and 2.4430
12
−9.8
ALA292, TRP15, SER291, ARG263, ILE272 and ALA292
ASN259, ASN259, ARG270, LYS16, LYS13 and ILE272
2.5762, 2.3725, 2.0877, 2.2001, 3.2371 and 3.0425
13
−9.9
PHE178 and ARG315
ASP352
TYR158, GLU411, GLU277 and ARG442
2.5017, 2.9817, 2.3509 and 2.1559
14
−9.6
ALA292, TRP15 and ILE272
ASN259, GLU296, LYS16, and LYS13
2.3147, 2.5501, 2.7779 and 3.11320
15
−9.9
TRP15, SER291, ARG263, ILE272 and ALA292
ASN259, ASN259, LYS16, LYS13 and ILE272
2.5319, 2.2458, 2.1712, 3.2382 and 2.9205
16
−9.6
ALA292 and TRP15
ASN259, GLU296, LYS16, ARG270 and LYS13
2.2218, 2.3258, 2.8415, 3.7337 and 3.0338
17
−9.7
ALA292, TRP15 and ILE272
ASN259, GLU296, LYS16, GLU271, LYS13 and GLU271
2.4405, 2.8487, 2.8820, 3.4211, 3.1605 and 3.4816
18
−9.4
ILE272, ARG263, VAL266 and ALA292
GLU296, SER291, LEU297, ARG263, HIS295, GLU296, SER298 and ALA292
2.9749, 2.5521, 2.7170, 2.9698, 2.8341, 2.3460, 3.6410 and 2.9880
19
−8.9
ILE262, LYS13, ARG263, VAL266, ILE272, ALA292 and TRP15
GLU296, GLU296, ASN259 and LYS13
2.16198, 2.6436, 2.4589 and 3.7404
20
−8.9
ALA292, ARG263, VAL266, and TRP15
GLU296, GLU296, ARG263, and LYS13
2.2995, 2.8691, 3.0319 and 3.6105
21
−8.8
TYR158, VAL216 and PHE178
ASP352
TYR158, TYR158, GLU411 and SER157
2.8535, 2.6667, 2.7690 and 3.7598
22
−8.2
LYS156, ARG315, and TYR158
ASP242
2.77659
23
−9.1
TYR158, PHE178, and LYS156
TYR158, TYR158, GLU411, ASP242, SER241 and SER241
2.9085, 2.6097, 2.8659, 1.8365, 2.1041 and 2.2667
24
−8.9
ALA292, TRP15, ILE262, SER291, ARG263, VAL266 and ILE272
ASN259, GLU296, THR274 and SER298
2.2948, 2.1960, 2.8595 and 2.2601
25
−8.4
ILE262, ARG263 and VAL266
TRP15
GLU271, ILE272 and GLU296
2.5160, 1.9513 and 2.7252
26
−9.8
TYR158, TYR72, VAL216 and LYS156
ASP215 and GLU277
ASP307, ASP307 and GLU277
2.5099, 2.8113 and 3.1798
27
−9.6
VAL308, ARG315, TYR158 and LYS156
THR310 and THR310
2.3287 and 2.2118
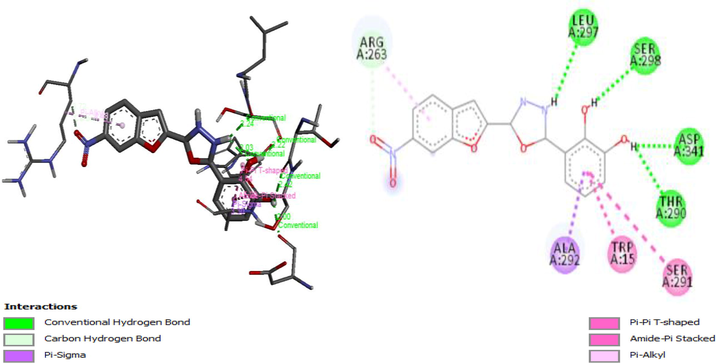
A3D and 2D structure of Ligand-Receptor complex 10 (−9.9 kcal/mol).
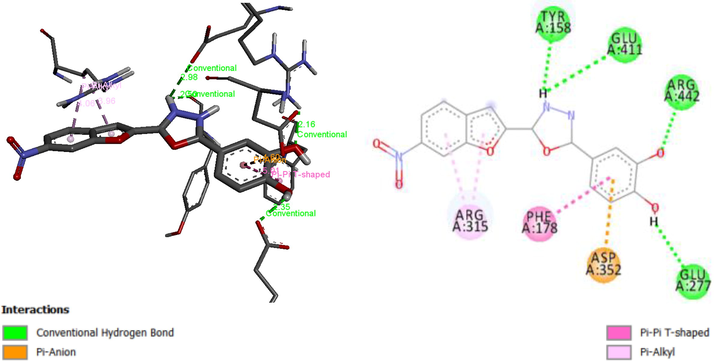
3D and 2D structure of Ligand-Receptor complex 13 (−9.9 kcal/mol).
3D and 2D structure of Ligand-Receptor complex 15 (−9.9 kcal/mol).
3.3 Conclusion
An in-silico study was carried out on 27 Oxadiazoles derivatives as anti-diabetic compounds. Model 1 been the best was assessed internally and externally with Friedman’s Lack of fit of 0.030552, squared correlation coefficient (R2) of 0.9681, adjusted squared correlation coefficient (R2adj) value of 0.9567, Leave one out (LOO) cross-validation coefficient (Q2CV) value of 0.9364 and the external validation (R2pred) of 0.6969. Molecular Docking for this study revealed that ligand 10, 13 and 15 are the most active compounds having the highest docking scores of −9.9 kcal/mol. Ligand 10 being among the ligands with the highest docking scores form 3 interactions: Hydrophobic, hydrogen bond, and carbon-hydrogen bond interactions. Hydroxyl groups of the phenyl ring of the ligand formed a hydrogen bond with Leu297 (2.2363 Å), Ser298 (2.2189 Å), Thr290 (2.4152 Å), Asp341 (2.0036 Å). Nitrogen 1 of the Oxadiazoles moiety formed a hydrogen bond with Ala292 (3.7179 Å). Arg263 form carbon-hydrogen bond with a nitrobenzofuran moiety of the ligand. The Ligand also formed hydrophobic interactions with the residues Ser291, Trp15, Ala292 and Arg263. This research has shown that the binding affinity generated was in agreement with the work reported by other researchers (Taha et al., 2015) on this series of compounds. The QSAR and molecular docking results correspond with one another and give room for the design of new anti-diabetic compounds with better activity against α-glycosidase.
Acknowledgment
The authors sincerely acknowledge Ahmadu Bello University, Zaria for its technical support, Dr. Sani Uba and Abdulfatai Usman for their advice in the cause of this research.
References
- In Silico Study Of Some Anticonvulsant Compounds. Scholars’ Press; 2016. 978-3-330-65212-5
- Quantitative structure-activity relationship and molecular docking studies of a series of quinazolinonyl analogues as inhibitors of gamma amino butyric acid aminotransferase. J. Adv. Res.. 2017;8:33-43.
- [Google Scholar]
- Quantitative structure-activity relationship and molecular docking Of 4-alkoxy-cinnamic analogues as anti-mycobacterium tuberculosis. J. King Saud Univ. Sci. 2018
- [Google Scholar]
- Amit, C., Payal, C., R. K, D., 2014. Qsar Study Of 2,4-Dioxothiazolidine Antidiabetic Compounds.
- Insilco study on the toxicity of anti-cancer compounds tested against molt-4 And P388 cell lines using Ga-Mlr technique. Beni-Suef Univ. J. Basic Appl. Sci.. 2016;5:320-333.
- [Google Scholar]
- Qsar Study Of Flavonoid Derivatives As In Vitro Inhibitors Agents Of Aldose Reductase (Alr2) Enzyme. For Diabetic Complications; 2017.
- Design and synthesis of thiadiazole derivatives as antidiabetic agents. Med. Chem.. 2014;4:390-399.
- [Google Scholar]
- Pharmacological significance of synthetic heterocycles scaffold: a review. Adv. Biol. Res.. 2011;5:120-144.
- [Google Scholar]
- Use of computer-assisted methods for the modeling of the retention time of a variety of volatile organic compounds: a Pca-Mlr-ann approach. J. Chem. Inf. Comput. Sci.. 2004;44:1328-1335.
- [Google Scholar]
- Oxadiazoles and thiadiazoles: novel α-glucosidase inhibitors. Bioorg. Med. Chem.. 2014;22:5454-5465.
- [Google Scholar]
- Synthesis, Characterization and biological evaluation of novel 2, 5 substituted-1, 3, 4 oxadiazole derivatives. Saudi Pharm. J.. 2017;25:337-345.
- [Google Scholar]
- Synthesis of coumarin derivatives containing pyrazole and indenone rings as potent antioxidant and antihyperglycemic agents. Arabian J. Chem.. 2017;10:S3895-S3906.
- [Google Scholar]
- Synthesis and molecular docking studies of potent α-glucosidase inhibitors based on biscoumarin skeleton. Eur. J. Med. Chem.. 2014;81:245-252.
- [Google Scholar]
- Synthesis, characterization and anthelmintic activity (perituma posthuma) of new oxadiazole incorporated with imidazole and pyrazole. Int. J. Pharma Bio Sci.. 2010;1:1-14.
- [Google Scholar]
- Synthesis of 6-hydroxyaurone analogues and evaluation of their α-glucosidase inhibitory and glucose consumption-promoting activity: development of highly active 5, 6-disubstituted derivatives. Bioorg. Med. Chem. Lett.. 2017;27:3226-3230.
- [Google Scholar]
- Synthesis and in silico studies of novel sulfonamides having oxadiazole ring: as β-glucuronidase inhibitors. Bioorg. Chem.. 2017;71:86-96.
- [Google Scholar]
- Oxindole based oxadiazole hybrid analogs: novel α-glucosidase inhibitors. Bioorg. Chem.. 2018;76:273-280.
- [Google Scholar]
- Synthesis and molecular modelling studies of phenyl linked oxadiazole-phenylhydrazone hybrids as potent antileishmanial agents. Eur. J. Med. Chem.. 2017;126:1021-1033.
- [Google Scholar]
- Synthesis, molecular docking and α-glucosidase inhibition Of 5-Aryl-2-(6′-Nitrobenzofuran-2′-Yl)-1, 3, 4-Oxadiazoles. Bioorg. Chem.. 2016;66:117-123.
- [Google Scholar]
- Synthesis of 2-(2-Methoxyphenyl)-5-Phenyl-1, 3, 4-oxadiazole derivatives and evaluation of their antiglycation potential. Med. Chem. Res.. 2016;25:225-234.
- [Google Scholar]
- Synthesis of novel inhibitors of α-glucosidase based on the benzothiazole skeleton containing benzohydrazide moiety and their molecular docking studies. Eur. J. Med. Chem.. 2015;92:387-400.
- [Google Scholar]
- Synthesis, α-glucosidase inhibitory activity and in silico study of tris-indole hybrid scaffold with oxadiazole ring: as potential leads for the management of type-Ii diabetes mellitus. Bioorg. Chem.. 2017;74:30-40.
- [Google Scholar]
- The importance of being earnest: validation is the absolute essential for successful application and interpretation of Qspr models. Mol. Inf.. 2003;22:69-77.
- [Google Scholar]
- AutoDock Vina: improving the speed and accuracy of docking with a new scoring function, efficient optimization, and multithreading. J. Comput. Chem.. 2010;31:455-461.
- [Google Scholar]
- Validation of qsar models-strategies and importance. Int. J. Drug Des. Discov.. 2011;3:511-519.
- [Google Scholar]
- Synthesis, biological evaluation and molecular docking study of N-arylbenzo [D] oxazol-2-amines as potential α-glucosidase inhibitors. Bioorg. Med. Chem.. 2016;24:5374-5379.
- [Google Scholar]
- Padel-descriptor: an open source software to calculate molecular descriptors and fingerprints. J. Comput. Chem.. 2011;32:1466-1474.
- [Google Scholar]


