

Translate this page into:
In-silico modelling studies on some C14-urea-tetrandrine derivatives as potent anti-cancer agents against prostate (PC3) cell line
⁎Corresponding author. mustychem19@gmail.com (Mustapha Abdullahi)
-
Received: ,
Accepted: ,
This article was originally published by Elsevier and was migrated to Scientific Scholar after the change of Publisher.
Peer review under responsibility of King Saud University.
Abstract
Insilico modelling studies was executed on twenty-four (24) novel C14-urea-tetrandrine compounds as inhibitors of prostate cancer (PC3) cell line. The molecular structure of each compound was correctly drawn using ChemDraw software, then optimized using Density Functional Theory (DFT/B3LYP/6-31G*) at ground state with Spartan 14 V1.1.4 software. Accordingly, the optimized structures were numerically represented by computing diverse molecular descriptors using PaDEL calculator. The entire data set results were divided into training and test set. A multi-linear regression model based on genetic function approximation in selecting statistically significant descriptors was built from the training set. The resultant QSAR model (R2train = 0.8075, Q2LOO = 0.6866, R2test = 0.6147, cRp2 = 0.7397) was adequately validated using the leave-one-out (LOO) cross-validation method, MLR Y-randomization test, bias-variance estimation (bootstrapping), and it was accepted due to its statistical significance based on threshold values of accepting QSAR model globally. Compound 1 and 11 as the best inhibitors were docked with B-cell lymphoma 2 (Bcl-2) crystal structure so as to explore the kind of interactions in each stable complex formed. The results revealed binding scores of −8.7 kcal/mol for the ligand (compound 1) and −9.3 kcal/mol for the ligand (compound 11) which is the highest. It was observed also that both inhibitors made hydrophobic and hydrogen bond interaction with the amino acid residue of B-cell lymphoma 2 (Bcl-2) protein which control cell death in prostate cancer. The present findings could be useful in designing and synthesizing new C14-urea-tetrandrine with better inhibitory potentials against prostate (PC3) cell line.
Keywords
QSAR
Model
Molecular descriptors
Docking
Tetrandrine
Prostate cancer

1 Introduction
In recent times, prostate cancer is one of the most malicious syndromes in male worldwide (Gleave et al., 1999). It grows slowly after some cells in the prostate gland transformed and become abnormal. These mutations in the DNA of abnormal cells cause them to divide and grow faster than normal cells. The abnormal cells remain alive, while other cells perish which leads to the creation of a tumor that can develop and conquer neighboring tissues (Tso et al., 2000). It is being treated for adult men between the age of 30 s to 40 s, but more often for 65 years and above. However, black men were reported to have a greater risk than other races and the reason is not clearly understood (Tso et al., 2000). Though at an early stage of cancer, it can be well-managed by radiotherapy or medical surgery, while patients with chronic prostate cancer are treated with hormone therapy (Gleave et al., 1999). The B-cell lymphoma 2 (Bcl-2) is the first family member of the Bcl-2 protein type, which are regulatory proteins that control cell death in prostate cancer. These include BCL-2, BCL-xL BCL-w, and MCL-1 as anti-apoptotic proteins that inhibit apoptosis by confiscating the pro-apoptotic proteins (Bax & Bak) and by inhibiting their oligomerization (Chittenden et al., 1995; Diaz et al., 1997). Nonetheless, apoptosis induces cancer cells through extrinsic and intrinsic pathways. Cytotoxic drugs at high-dose radiation damage the DNA and mitochondria, causing inactivation of the ‘intrinsic’ caspase-9-mediated apoptotic pathway. Yet, numerous molecules participate in mitochondria-mediated apoptosis (Blagosklonny et al., 1997, 1996). Tetrandrines are compounds of dibenzyltetrahydroisoquinoline, derived from Chinese medicinal plant called Stephania tetrandra and it is reported to have anti-tumor activities, proliferation chemotherapeutic drugs and converses multidrug resistance (MDR) of tumor cell. New drugs with novel properties are synthesized via several trials, which is costly and exhausts time. The advent of insilico modeling techniques like Quantitative Structure-Activity Relationship (QSAR) and molecular or protein docking reduces these limitations and even helps in designing better drugs. The QSAR technique arrives at a mathematical model that correlates the chemical, physical, biological activities, or pharmaceutical effect with some numerical information (descriptors) from the chemical structure of molecule while molecular docking predicts the possible orientation of the stable complex formed, when ligand interacts with an enzyme or protein as a receptor (Ibrahim et al., 2020). The main aim of this research was to generate a new QSAR model for predicting inhibitory concentrations of some C14-urea tetrandrine compounds against prostate (PC3) cell line by a genetic function approximation-multi linear regression (GFA-MLR) technique, then dock the best inhibitors with B-cell lymphoma 2 (Bcl-2) protein crystal structure to study their molecular interaction. Furthermore, the QSAR model validation methods in this study include; leave-one-out (LOO) cross-validation, external test set, Y-randomization test, and the bias-variance estimation using bootstrapping re-sampling technique.
2 Methodology
2.1 QSAR Studies
2.1.1 Dataset
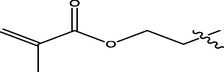
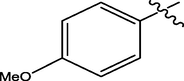
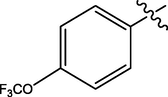
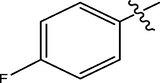
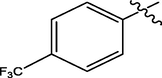
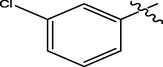
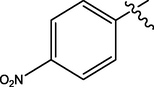
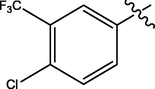
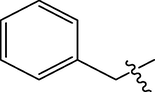
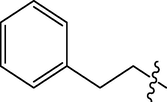
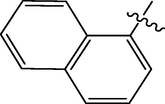
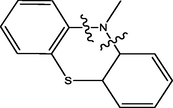
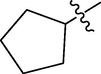
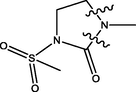
The twenty-four (24) synthesized C14-urea-tetrandrine analogs with their inhibitory concentrations (IC50) against prostate cancer (PC3) were gotten from the literature (Lan et al., 2017). The molecular structures of the inhibitors were aligned with their respective inhibitory concentrations (IC50) measured in micromolar (
of concentration as shown in Fig. 1 and Table 1 respectively. An IC50 value of a compound is defined as the required concentration to decrease 50% of the prostrate (PC3) cell line viability. The concentration was further normalized so as to reduce skewness in the activity values using logarithmic scale formula below.
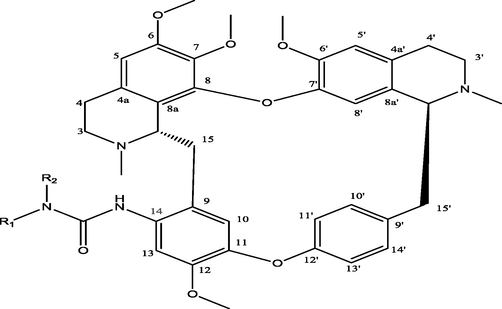
C14-urea tetrandrine structure.
S/N o.
R1
R2
IC50
pIC50
1

H
0.73
6.1366
2

H
0.88
5.3306
3

H
2.97
6.1307
4
Methyl
Methyl
1.71
5.6840
5

Methyl
0.98
5.2839
6

H
4.91
5.3429
7
H
7.82
5.1636
8
H
3.85
5.3279
9
H
3.15
5.2418
10
H
4.67
5.2291
11
H
0.74
5.8794
12
H
2.07
6.0555
13
H
5.2
5.5301
14
H
4.54
5.4220
15
H
6.86
5.7544
16
H
4.70
5.6635
17
H
5.73
5.4225
18
H
5.9
5.5272
19
H
1.32
5.7670
20
–
2.95
6.0087
21

H
3.78
5.3089
22
H
1.76
5.1067
23
–
2.17
5.4147
24

–
3.78
5.5016
2.1.2 Equilibrium geometry
The compounds displayed above were correctly drawn by employing ChemDraw software V12.0.2, and their equilibrium geometries were acquired via optimization with Density Functional theory (DFT/B3LYP/6-31G*) at ground state using Spartan V.1.1.4 2014 version (Abdulfatai et al., 2017, 2018; Arthur et al., 2018; Becke, 1993; Ibrahim et al., 2020).
2.1.3 PaDEL descriptors calculation
Pharmaceutical Data Exploration Laboratory (PADEL) descriptors calculator enable us to calculate 1875 molecular descriptors from a compound. These descriptors include spatial, topological, electrostatic, constitutional, geometrical, physiochemical, autocorrelation, structural, and thermodynamic descriptors (Alisi et al., 2018). The twenty-four (24) optimized compounds were appropriately saved as SD file before engaging PaDEL software (Yap, 2011).
2.1.4 Data pretreatment and division
The results from the PADEL- software which is in Microsoft Excel sheet format were pretreated by removing constant values, non-informative, redundant and highly correlated descriptors using a software called Data Pre-treatment GUI 1.2, downloaded from Drug Theoretical and Cheminformatics Laboratory (DTC Lab) (Ambure et al., 2015). Consequently, the data were further divided into two distinct sets (training and test set) via a data division software by applying Euclidean-based Kennard-Stone’s algorithm method as one of the best division technique reported in many QSAR studies.
2.1.5 Model building and validation
The training set compounds were exported to the Material studio (V8) software for model building by using genetic function approximation- multilinear regression (GA-MLR) technique, where dependent variables correspond to the inhibitory concentration (IC50) and the quantum molecular descriptors are considered as independent variables. In materials studio, LOF expression (Eq. (2)) is slightly different from the original Friedman expression (1991).
The QSAR validation technique tends to estimate the accuracy of mathematical models. There are numerous methods normally employed to validate the predictive capability of a model. However, the simplest method of validation is to divide the experimental data into two different sets: the training set (internal validation set) and the validation set (external test set). The model internal validation was examined using Leave-one-out (LOO) cross-validation method R2 (Q2cv), defined as shown in Eq. (4).
where p is the number of descriptors, n is the number of compounds as the training set.
The external test set is the optimal choice for checking the performance of a model with compounds that are not used in building the model (training set compounds). This measures model’s prediction competency and coefficient of determination
) defined as Eq. (5);
2.1.6 Prediction error analysis
The developed model was subjected to prediction error analysis based on bias-variance estimation. This technique allows QSAR users to understand the contribution of the two component of the prediction errors, specifically systematic (bias) error and random (variance) error in the model generated (Roy et al., 2017). The analysis was executed using a software tool called Bias-Variance Estimator downloaded from DTC lab website and it uses bootstrapping as a resampling technique. The parameters bias2, variance and mean square error (MSE) are evaluated using the equations below;
2.1.7 MLR Y-Randomization
The multi-linear regression analysis termed as Y-randomization was executed on the training set data by permuting the activity values with respect to the selected descriptors matrix (Minovski et al., 2013). It is expected to have models with low R2 and Q2 values for several trials (Roy, 2013). However, the Coefficient of determination (c
) is an alternate parameter evaluated that should be above 0.5 and it is defined as in Eq. (10)
2.1.8 Mean effect
The mean effect measures molecular descriptors influence on the activity of a compound in the model. However, the signs coupled with the magnitude of these descriptors depicts the individual strength and direction in influencing the activity of a compound. It is defined as;
2.1.9 Varian inflation factor (VIF)
The variance Inflation Factor is a measure of identifying the multicollinearity among the descriptors, usually expressed as:
2.1.10 Applicability domain
According to Netzeva and his coworkers, the applicability domain of a model is the response and compound structure space in which the model makes consistent predictions (Netzeva et al., 2005). In other words, it helps in detecting areas where the compound predictions can be reliably useful. Therefore, chemical compounds that drop outside the applicability domain cannot make a very good prediction. Consequently, the prediction that is interpolated in the chemical space is acceptable while extrapolated predictions in the chemical space are rejected as well. The leverage method is one of the simplest distance to the model technique used in evaluating the significant area of the QSAR model. Leverage for a compound (J) is calculated as in Eq. (13).
2.2 Computational docking studies
The molecular interactions study were carried out between best ligands (compound 1 and 11) with higher IC50 values and the Bcl-2 protein crystal structure (target) on Dell computer system, with processor properties of Intel ® Core i3-6100U CPU Dual@2.30 GHz, 12 GB (RAM)
2.2.1 Making of ligand and target
The two optimized compounds from Spartan software were appropriately saved as Protein Data Bank (PDB) file, then visualized using Discovery studio (Abdulfatai et al., 2017). Subsequently, the crystal structure of the Bcl-2 protein (target) was downloaded from Protein Data Bank website with PDB code 2XA0. Fig. 2 displays the structures of the prepared ligand and protein in 3D.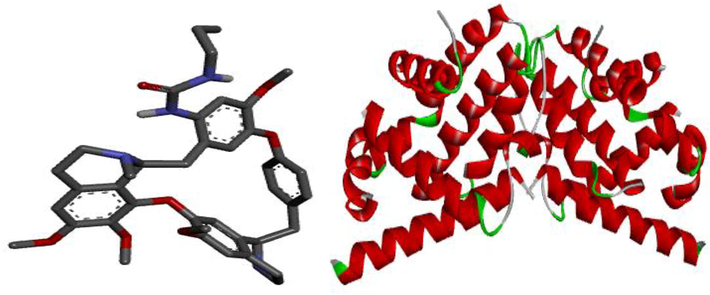
3D structures of the prepared ligand and target.
2.2.2 Docking process
The docking of the prepared ligands (compound 1 and 11) with Bcl-2 was conducted using the Auto vina version 4.0 of pyrex software. Hence, discovery studio software was used in visualizing the molecular interactions of the stable complex.
3 Results and discussion
3.1 QSAR studies
Firstly, the 32 quantum chemical descriptors for all the drawn compounds were obtained from Spartan 14 software via the optimization process. These were pooled with the 1875 molecular descriptors computed by PaDEL software to give a total of 1907. The results in MS excel (.csv) were subjected to data pretreatment which removed non-informative constant data and pair of variables with a correlation coefficient greater than 0.7 using the Data pretreatment software. The dataset results from the pretreatment process were partitioned using Kennard-Stone algorithm method, where 16 compounds are considered as training set and 8 compounds are the test set. The division was successfully done using the “Dataset Division GUI 1.2” software (Arthur et al., 2016 a,b). The training set was used in building a QSAR model by employing genetic function approximation-multilinear regression of material studio (Eq. (15)), which uses genetic algorithms technique for the selection of three (3) optimum descriptors as independent variables in the model. In order to assess the level of prediction errors (residuals), bootstrapping resampling procedure was applied by developing 10,000 bootstrap samples of the same size starting from the training set (Roy et al., 2017). The bias, variance and mean square errors were very low, which means that the model predictions are good. The validation parameters which expressed the steadiness, robustness and extrapolative capabilities of the model was presented in Table 2.
Validation Parameters
Model
Threshold
Reference
Friedman LOF
0.1195
–
R-squared (Training set)
0.8075
≥0.6
Tropsha (2010)
R-squared (Adjusted)
0.7593
>0.6
Tropsha (2010)
Cross validated (R-squared)
0.6866
≥0.6
Tropsha (2010)
Significant Regression
Yes
–
Significance-of-regression F-value
16.7796
–
Critical SOR F-value (95%)
3.6506
–
Replicate points
0
–
Computed experimental error
0
–
Lack-of-fit points
12
–
Min expt. error for non-significant LOF (95%)
0.1241
–
No. of Bootstrap Models
10,000
–
Variance
0.01124
–
Bias^2
0.0776
–
Mean Square Error
0.08425
–
R-square (test set)
0.6149
≥0.6
Tropsha (2010)
Inhibitory concentration (pIC50) from the experiment together with the predicted concentration (pIC50) from the model generated and their residual values were reported in Table 3. The Residual value is defined as the differences between experimental and predicted concentrations, and lower residual values signify that the model has a high predictive ability. *Superscript represent training set.
Name
Inhibitory concentrations (pIC50)
Predicted
Residuals
1*
6.1366
6.0819
0.0546
2*
6.0555
5.9704
0.0850
3*
5.5272
5.3361
0.1910
4
5.7670
5.9830
−0.2160
5
6.0087
6.0980
−0.0892
6*
5.3089
5.6969
−0.3880
7*
5.1067
5.1576
−0.0509
8*
5.4145
5.4088
0.0057
9
5.5016
5.4258
0.0758
10*
5.3306
5.3733
−0.0426
11*
6.1307
6.1137
0.0169
12*
5.6845
5.7349
−0.0506
13*
5.2839
5.2359
0.0480
14*
5.3429
5.3013
0.0416
15
5.1636
5.3186
−0.1549
16*
5.3279
5.3617
−0.0338
17*
5.2418
5.3935
−0.1517
18
5.2291
5.2086
0.0204
19*
5.8794
5.5773
0.3020
20
5.5301
6.1269
−0.5968
21
5.4225
5.7741
−0.3516
22*
5.7544
5.7846
−0.0301
23*
5.6635
5.6605
0.0029
24
5.4225
5.7806
−0.3581
The three (3) descriptors values were extracted from the training set, then subjected to Pearson’s correlation matrix, mean effect and variance inflation factor analysis as presented in Table 4. The Pearson correlation coefficients for each pair of descriptors was less than 0.5, which inferred an insignificant inter-correlation among the descriptors. The variance inflation factor (VIF) for all the three (3) descriptors are not greater than 1.5, this signifies that the descriptors were orthogonal and the model has clear statistical significance. Furthermore, the mean effect explained the relative significance and their direction of contribution in the model. ATSC3m is a 2D Centered Broto-Moreau autocorrelation - lag 3 / weighted by mass descriptor with positive mean effect, this indicates the positive contribution of the descriptor when increased. VE1_DzZ is the coefficient sum of the last eigenvector from Barysz matrix / weighted by an atomic number with the highest contribution whose direction also influences the activity positively as it increases. nsF is the number of fluorine atom-type in the energy state of the compound with least contribution having a negative mean effect, this signifies a negative influence on the activity. (Todeschini and Consonni, 2009). *VIF is the variance inflation factor.
ATSC3m
VE1_DzZ
nSF
Mean Effect
VIF
ATSC3m
1
0.2882
1.0682
VE1_DzZ
0.03341
1
0.8057
1.1351
nsF
−0.22592
0.327015
1
−0.0939
1.1948
The results in Table 5 shows the statistical regression output of the three descriptors used in the developed model. From results, the absolute t-statistics values for each descriptor are greater than 2, this also inferred that the selected descriptors were good. The p-values of all descriptors in the model are less than 0.05 which means that there is a relationship between the descriptors and the activities of the compounds.
Coefficients
Standard Error
t Stat
P-value
Intercept
6.4810
0.1866
4.7289
2.07E2−13
ATSC3m
0.0007
0.0001
4.8889
0.0003
VE1_DzZ
−1.8046
0.4284
4.2124
0.0012
nsF
0.3407
0.0599
5.6836
0.0001
MLR Y-Randomization output revealed low R2 and Q2 values for 10 trials as anticipated which confirmed that the QSAR model is robust, while the cRp^2 value is 0.7397 which is greater than 0.5 as shown in Table 6. (Roy et al., 2013). Fig. 3 displays the plot of predicted activities of both the training and the test sets versus the experimental activities (pIC50).
Model
R
R2
Q2
Original
0.8986
0.8075
0.6866
Trial 1
0.3388
0.1148
−2.1079
Trial 2
0.2252
0.0507
−1.4596
Trial 3
0.3990
0.1592
−2.1375
Trial 4
0.4332
0.1877
−0.4340
Trial 5
0.4406
0.1941
−1.2894
Trial 6
0.4408
0.1943
−0.1941
Trial 7
0.2712
0.0735
−2.4841
Trial 8
0.3829
0.1466
−0.7092
Trial 9
0.0741
0.0054
−2.3501
Trial 10
0.5975
0.3570
0.0006
Random Models Parameters
Average r:
0.3603
Average r2:
0.1483
Average Q2:
−1.3165
cRp2:
0.7397
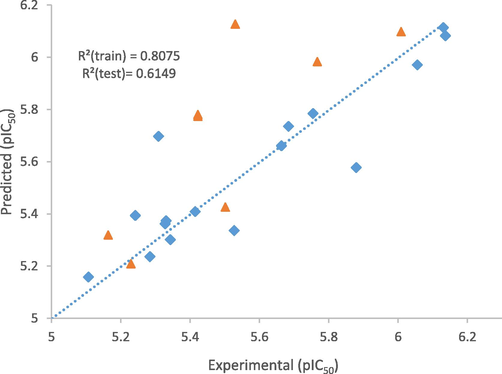
The plot of Predicted against inhibitory concentration (Experimental).
The standardized residual was plotted against IC50 (experimental) as presented in “Fig. 4”, and the plot illustrated a random scattering around the baseline of data at the standardized residual equal to zero which depicts no systematic error in the model.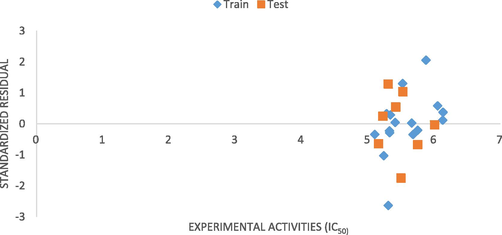
Standardized residual against inhibitory concentration (Experimental).
The standardized residuals were plotted against the leverage values (Williams Plot) as shown in Fig. 5 so as to detect the structural outliers in the model. The plot shows that all compounds are within the applicability domain with a threshold value (H*) of 0.75 except compound 11. Therefore, compound 11 is considered an influential compound which may be due to the differences in substitution pattern of the chemical structure in the dataset.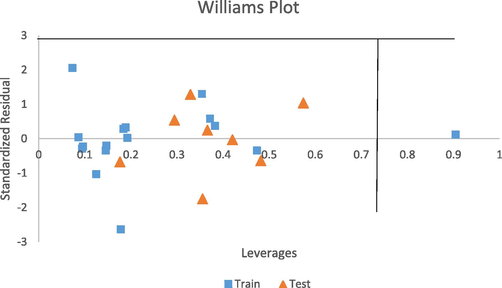
Standardized residuals vs leverages plot (Williams plot).
3.2 Docking results
Computational docking was carried out on the compound 1 and 11 with Bcl-2 protein crystal structure (target) respectively. The docking results comprising the binding affinity, interaction type, bond type, and distance was presented in Table 7. Our results show binding affinity of −8.7 kcal/mol for complex 1 and −9.3 kcal/mol for complex 11, which means that the latter forms the most stable complex when a ligand (compound 11) binds with the target. The two complexes were visualized using the discovery studio so as to elucidate their molecular interactions. Ligand 1 formed three (3) major interactions (hydrogen, hydrophobic and electrostatic) with the target. Furthermore, oxygen in carbonyl (C⚌O) of urea formed H-bond with ARG183 (2.8346 Ao) and two amino acids of ARG127 at different distances (1.9058 and 2.4960A0) respectively. Also, the pi-orbital containing delocalized electrons in the benzene ring (ligand 1) interacts with C—H, pi- orbitals and an alkyl group of THR122 (3.6935 Ao), HIS184 (5.886 Ao), and PRO123 (4.7943 Ao) amino acids to form hydrophobic bonds. However, ligand 11 formed four (4) major interactions namely; hydrogen bond, hydrophobic, halogen and electrostatic bond. The fluoro substituent on urea moiety of C14 acts as an H-bond donor (Halogen) which formed a conventional hydrogen bond with ARG127 at 2.26417Ao bond distance. There was also hydrogen bond interaction between —NH group of urea on C14 and GLU135 (2.96421 Ao), between an oxygen on C6 (—O—CH3) and HIS184 (2.2300 Ao) respectively. The result revealed carbon-hydrogen bond interactions for ARG183 (3.3161Ao), halogen bond interaction with two TRP176 amino acids at different distance (3.3161 & 3.44563 Ao) and GLU179 (3.40773Ao), then hydrophobic bond interactions with HIS120 (5.68146Ao), ALA131 (4.50067Ao) and electrostatic bond with ARG129 (3.87199Ao) which is a pi-orbital-cation interaction. The hydrogen bond together with hydrophobic interactions in the complexes is an indication that ligand 1 and 11 of the inhibitor compounds are potent against Bcl-2 receptor (Abdulfatai et al., 2016). Figs. 6a and 6b showed the molecular interaction in 2D and 3D, while Figs. 7a and 7b exposed the H-bond molecular interaction in 3D for both complex 1 and 2 respectively.
Complex
Binding Affinity (kcal/mol)
Amino acids
Bond type
Interaction
Distance (A0)
1
−8.7
ARG127
Hydrogen Bond
Conventional Hydrogen Bond
1.9058
ARG127
Hydrogen Bond
Conventional Hydrogen Bond
2.4960
ARG183
Hydrogen Bond
Conventional Hydrogen Bond
2.8346
ARG129
Hydrogen Bond
Conventional Hydrogen Bond
2.1102
HIS184
Electrostatic
Pi- Cation
4.7956
THR122
Hydrophobic
Pi-Sigma
3.6935
HIS184
Hydrophobic
Pi-Pi T-shaped
5.8869
PRO123
Hydrophobic
Pi-Alkyl
4.7943
11
−9.3
ARG127
Hydrogen Bond; Halogen
Conventional Hydrogen Bond; Halogen (Fluorine)
2.2641
HIS184
Hydrogen Bond
Conventional Hydrogen Bond
2.2300
GLU135
Hydrogen Bond
Conventional Hydrogen Bond
2.9642
ARG183
Hydrogen Bond
Carbon-Hydrogen Bond
3.3161
TRP176
Halogen
Halogen (Fluorine)
3.6732
TRP176
Halogen
Halogen (Fluorine)
3.4456
GLU179
Halogen
Halogen (Fluorine)
3.4077
HIS184
Electrostatic
Pi-Cation
3.8719
ARG129
Electrostatic
Pi-Cation
4.2961
HIS120
Hydrophobic
Pi-Pi Stacked
5.6814
ALA131
Hydrophobic
Pi-Alkyl
4.5006
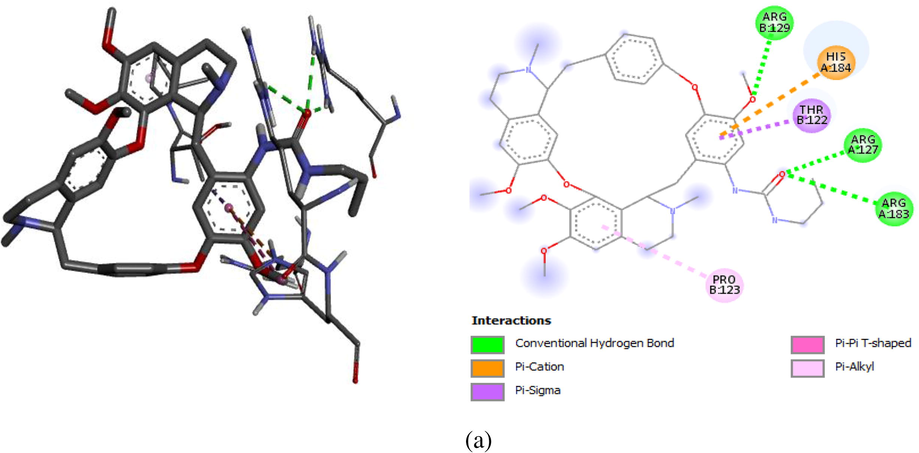
2D and 3D molecular interactions for Complex 1 (−8.7 kcal/mol).
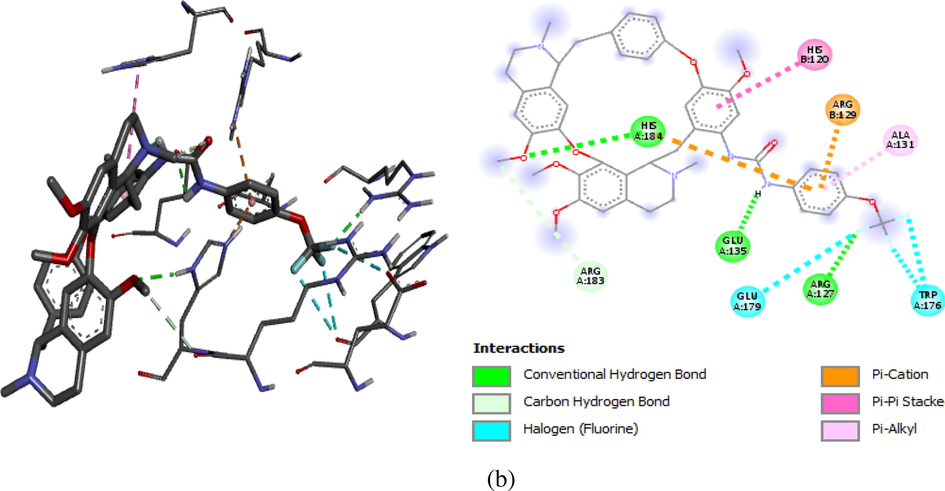
2D and 3D molecular interaction for Complex 11 (−9.3 kcal/mol).
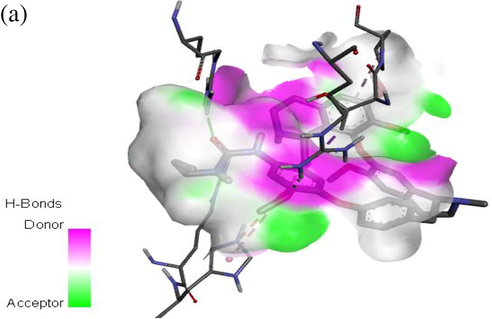
H-bond molecular interaction between compound 1 and Bcl-2 protein (target).
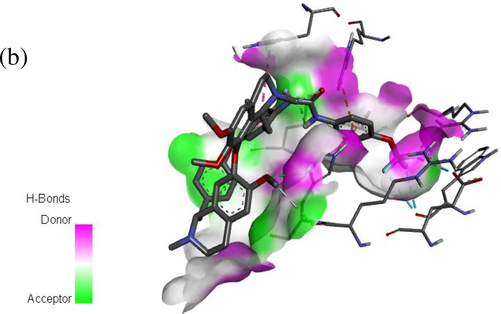
H-bond molecular interaction between compound 11 and Bcl-2 protein (target).
3.3 Conclusion
The computational modelling results adequately provide knowledge on the quantum structure–activity relationship by using some numerical features from structures of C14-urea compounds that influence the biological activities of prostate cancer (PC3) cell line. The QSAR model containing ATSC3m, VE1_DzZ and nsF descriptors from genetic function approximation was able to predict the activity (IC50) values of the inhibitors. Results from mean effect analysis of these descriptors revealed the positive relative importance of ATSC3m and VE1_DzZ descriptors on influencing the inhibitory concentrations, while nsF depicts negative influence. The model was accepted due to its statistical significance based on the global threshold values for accepting QSAR model. Docking studies further exposed the kind of interactions between the best inhibitors among the data set and the Bcl-2 protein as a target. The docking results showed compound 1 and 11 having binding values of −8.3 kcal/mol and −9.3 kcal/mol formed hydrophobic and hydrogen bond interaction with the amino acid residue of B-cell lymphoma 2 (Bcl-2) protein which control cell death in prostate cancer. This research depicted a route for designing new C14-urea-tetrandrine derivatives with excellent inhibitory potentials.
Acknowledgements
We wish to acknowledge the theoretical and physical chemistry team, chemistry department, Ahmadu Bello University Zaria, Dr Sani Uba, Abdullahi B. Umar, Abdulfatai Usman for their technical support and advice in the course of this research.
References
- Abdulfatai, U., Uzairu, A., Uba, S., 2016. In silico study of some anticonvulsant compounds. Scholars’ Press ISBN, 978-3.
- Quantitative structure-activity relationship and molecular docking studies of a series of quinazolinonyl analogues as inhibitors of gamma amino butyric acid aminotransferase. J. Adv. Res.. 2017;8(1):33-43.
- [CrossRef] [Google Scholar]
- Adeniji, S.E., Uba, S., Uzairu, A., 2018. QSAR Modeling and Molecular Docking Analysis of Some Active Compounds against Mycobacterium tuberculosis Receptor (Mtb CYP121), 2018.
- Quantitative structure activity relationship analysis of coumarins as free radical scavengers by genetic function algorithm. Phys. Chem. Res.. 2018;6(1):209-223.
- [Google Scholar]
- “NanoBRIDGES” software: open access tools to perform QSAR and nano-QSAR modeling. Chemom. Intell. Lab. Syst.. 2015;147:1-13.
- [Google Scholar]
- Insilico modelling of quantitative structure-activity relationship of Pgi50 anticancer compounds on k-562 Cell Line. Cogent Chem. 2018:1432520.
- [Google Scholar]
- Insilco study on the toxicity of anti-cancer compounds tested against MOLT-4 and p388 cell lines using GA-MLR technique. Beni-Suef Univ. J. Basic Appl. Sci.. 2016;5(4):320-333.
- [Google Scholar]
- QSAR modelling of some anticancer PGI50 activity on HL-60 cell lines. Albanian J. Pharm. Sci.. 2016;3(1):4-9.
- [Google Scholar]
- Becke’s three parameter hybrid method using the LYP correlation functional. J. Chem. Phys.. 1993;98:5648-5652.
- [Google Scholar]
- Raf-1/bcl-2 phosphorylation: a step from microtubule damage to cell death. Cancer Res.. 1997;57(1):130-135.
- [Google Scholar]
- Taxol-induced apoptosis and phosphorylation of Bcl-2 protein involves c-Raf-1 and represents a novel c-Raf-1 signal transduction pathway. Cancer Res.. 1996;56(8):1851-1854.
- [Google Scholar]
- Brandon, V., Orr, A., 2015. Comprehensive R archive network (CRAN): http://CRAN.Rproject.org.
- A conserved domain in Bak, distinct from BH1 and BH2, mediates cell death and protein binding functions. The EMBO J.. 1995;14(22):5589-5596.
- [Google Scholar]
- A common binding site mediates heterodimerization and homodimerization of Bcl-2 family members. J. Biol. Chem.. 1997;272(17):11350-11355.
- [Google Scholar]
- Prostate cancer. treatment of advanced disease. Cancer Med. Assoc. J.. 1999;160:225-232.
- [Google Scholar]
- In-silico studies of some oxadiazoles derivatives as anti-diabetic compounds. J. King Saud Univ. Sci.. 2020;32:423-432.
- [Google Scholar]
- Quantitative structure and activity relationship modeling study of corrosion inhibitors: genetic function approximation and molecular dynamics simulation methods. Int. J. Electrochem. Sci.. 2011;6:4077-4094.
- [Google Scholar]
- Design and synthesis of novel C14-urea-tetrandrine derivatives with potent anti-cancer activity. Eur. J. Med. Chem. 2017
- [CrossRef] [Google Scholar]
- Assessment of applicability domain for multivariate counter-propagation artificial neural network predictive models by minimum Euclidean distance space analysis: a case study. Anal. Chim. Acta. 2013;759:28-42.
- [Google Scholar]
- Classical and Modern Regression Application (second ed.). CA: Duxbury Press; 1990.
- Current status of methods for defining the applicability domain of (quantitative) structure-activity relationships. ATLA. 2005;33:155-173.
- [Google Scholar]
- How important is to detect systematic error in predictions and understand statistical applicability domain of QSAR models? Chemom. Intell. Lab. Syst.. 2017;162:44-54.
- [Google Scholar]
- Some case studies on application of “rm2” metrics for judging quality of quantitative structure-activity relationship predictions: emphasis on scaling of response data. J. Comput. Chem.. 2013;34(12):1071-1082.
- [Google Scholar]
- Best practices for QSAR model development, validation, and exploitation. Mol. Inf.. 2010;29(6–7):476-488.
- [Google Scholar]
- The importance of being earnest: validation is the absolute essential for successful application and interpretation of QSPR models. Mol. Inform.. 2003;22:69-77.
- [Google Scholar]
- The importance of being earnest: validation is the absolute essential for successful application and interpretation of QSPR models. QSAR Comb. Sci.. 2003;22(1):69-77.
- [Google Scholar]
- Androgen deprivation induces selective outgrowth of aggressive hormone-refractory prostate cancer clones expressing distinct cellular and molecular properties not present in parental androgen-dependent cancer cells. Cancer J. (Sudbury, Mass.). 2000;6(4):220-233.
- [Google Scholar]
- Todeschini, R., Consonni, V., 2009. Molecular descriptors for chemo-informatics. Weinheim: Wiley-VCH; (Methods and principles in medicinal chemistry). ISBN: 9783527318520.
- PaDEL-descriptor: an open source software to calculate molecular descriptors and fingerprints. J. Comput. Chem.. 2011;32(7):1466-1474.
- [Google Scholar]


