

Translate this page into:
In-line detection of defects in steel pipes using flexible GMR sensor array
⁎Corresponding authors. mathivanand04@gmail.com (Mathivanan Durai), f10381@ntut.edu.tw (Ho Chang)
-
Received: ,
Accepted: ,
This article was originally published by Elsevier and was migrated to Scientific Scholar after the change of Publisher.
Peer review under responsibility of King Saud University.
Abstract
Steel pipes serve as the main source for transporting water, gas, and other petrochemical substances for longer distances. These pipes were able to withstand extreme weather conditions and hostile environments because of their remarkable properties such as higher strength, durability, lower cost, and improved wear and corrosion resistance. However, prolonged usage of these pipes in such environments may lead to the initiation of defects in their inner surface such as leak holes, cracks, corrosion, etc. In overtime, these defects may become more severe, resulting in component failure and property losses. Hence, earlier detection of defects is highly recommended to avoid these failures. In this work, an in-line robot system has been proposed for detecting the defects in the steel pipes. This robot utilizes a non-destructive way for evaluating the flaws by means of the magnetic flux leakage (MFL) technique. A 3D finite element model has been developed with the aid of ANSYS Maxwell 3D software for evaluating the generated magnetic field and optimizing the lift-off distance. The permanent magnet is preferred as the magnetizing material for implementing local magnetization in the inspection area. The magnetic flux leakage from the defect region is sensed by using a flexible GMR sensor array of six sensors. Artificial defects were introduced in a 6-inch diameter steel pipe in various shapes and the Arduino UNO controls the overall process. The data from the sensor array were collected using the Arduino and plotted as the waveform graph. From this graph, the voltage variations among the sensors represent the defect region. In addition, the higher peak in amplitude denotes that the flux is influenced by the defect’s depth. Thus, the waveform graph for the introduced defects was analyzed and all graph represents a better signal to noise ratio (SNR) for identifying the defects.
Keywords
In-line inspection
Pipeline robot
Magnetic flux leakage
Flexible GMR sensor array
Nondestructive testing

1 Introduction
Pipelines are used to transfer substances like oils, water, petrochemicals, and etc., in an effective manner. It is one of the most efficient modes of transportation over long distances. It is highly preferred due to remarkable properties such as uninterrupted transfer of fluids, greater volume of transport, cost-effective, less environmental impacts, minimum energy consumption, and so on. Based on the substance they carry, it can be either buried under the ground or kept exposed to the atmosphere (Chebouba et al., 2009; Milidiú et al., 2003; Camacho et al., 1990). Among the various types of pipes, steel pipes are generally preferred for supplying water, oil, and gas in domestic and hostile environments. It exhibits remarkable features such as better hardness, higher strength, good resistance to wear, economic, better fabricability, acceptable level of corrosion resistance and sustain in elevated pressure conditions. These properties paved the way for these pipes to get implemented in power plants, critical boilers, dams, nuclear reactors, mines, etc. (Mahmoodian, 2018; Thakur, 2019). Normally steel pipes are buried if they transfer hazardous substances and are kept outside for irrigation purposes. The buried steel pipelines are prone to more damages than the exposed pipes due to the prevailing environmental conditions and transporting materials (Psyrras and Sextos, 2018; Rahman and Ismail, 2012). Prolonged exposure of buried pipes in such environments results in the reduction of service life and durability. Stress cracks were observed in these pipes due to the effect of mechanical and external disturbances. More amount of stress cracks can damage the pipes and thus stops the supply (Qaddoumi et al., 2000). The molten salt deposits in petrochemical pipelines react with the inner surface in elevated temperatures and form leak holes due to corrosion. These leak holes will drain the hazardous substances below the earth’s surface and causes pollution. It also affects the groundwater table (Bariha et al., 2016). The combined effect of mechanical stress and corrosion will initiate the formation of stress corrosion cracks which are considered to be very aggressive in degrading the material properties (Ryakhovskikh et al., 2018). Hence, if the defects occurred are not detected earlier, will lead to loss of property and pollution to the environment.
The Nondestructive Technique (NDT) serves as the most appropriate method for evaluating these defects in both quantitative and qualitative aspects. Among the various NDT methods available, the MFL technique is more efficient for interrogating the defects in ferromagnetic materials. It works on the principle of flux leakage and this flux is sensed by the sensor in the system. This technique is recognized for its advantages like fast detection, non-contact, cost-effective, better precision, ease of implementation, and able to detect both the inner and outer surface defects (Xie and Tian, 2018; Peng et al., 2020). These advantages made this technique a more reliable method for investigating the defect in steel pipes and other types of ferromagnetic material in various applications (Liu et al., 2017). The sensor used in this technique monitors the volumetric variations of flux in the defect region (Niese et al., 2006). The choice of sensors plays a vital role in analyzing these volumetric changes.
Hall effect sensors are widely used by researchers for analyzing flux leakage in ferromagnetic applications. But it exhibits poor sensitivity at high temperatures and is not suitable for detecting small flaws. It needs a high electronic gain and no saturation effects were observed at greater magnetic fields. Moreover, the sensor should be placed perpendicular to the generated field (Popovic et al., 2002; Chen et al., 2005). Giant Magnetoresistance (GMR) sensor belongs to the class of Magnetoresistance (MR) sensor which possesses high sensitivity towards flux leakage at elevated temperature conditions. It provides better performance, good spatial resolution, excellent bandwidth, less power consumption when compared with the hall effect sensors (Pelkner et al., 2018; Park et al., 2017). It efficiently detects the leakage even placed parallel to the magnetic field (Popovic et al., 2002). Yashan et al. (2006) inspected the hidden defects in aerospace structures using the GMR arrays and reported that the array is effective in detecting the defects more than 20 mm depth. Cacciola et al. (2011) evaluated the GMR performance in terms of spatial resolution. The results showed that the GMR provides high-resolution inspection up to 250 µm. Singh et al. (2015) analyzed the localized damages occurring in the water tubes of thermal power plants with the aid of a flexible GMR array and reported that this array is able to detect the exterior erosion and internal corrosion in the tubes efficiently. Kreutzbruck et al. (2012) reported that the very small cracks can be detected with a good Signal to Noise ratio (SNR) by using the GMR sensors. In addition, GMR sensors possess accurate detection towards the medium size defects (Atzlesberger and Zagar, 2010). Hence from the above literature, it is evident the GMR sensor provides better performance and good sensitivity for detecting the defects. By amplification of the signal, defects were clearly identified.
This work is aimed to investigate the defects in steel pipes using an in-line inspection robot. This robot works on the principle of the MFL technique and the flux leakage at the defect region was detected using a flexible GMR sensor array. The thrust required for the robot’s movement inside the pipe is offered by the electric motor and the overall setup is controlled by the Arduino UNO program coded using the sketch software. By using the ANSYS Maxwell software, the 3D model is developed for optimizing the lift-off distance between the sensor location and the analyzing surface. Artificial defects were introduced in the 6-inch diameter steel pipe and the permanent magnet is used as the excitation source for generating the required magnetic field. The flux leakages were recorded at the defect region by the sensors and plotted as a waveform graph. From this graph, the voltage variations were observed at the defect location due to the flux leakage. Thus, the results of different types of defects were presented with a good SNR without signal processing and amplification.
2 MFL principle and 3D modeling
2.1 MFL inspection process
The MFL process can be applied to inspect defects in ferromagnetic materials. It is based on magnetic permeability and the refraction law. The three major factors which influence the MFL inspection process are the required magnetic field for magnetizing the parts, the choice of the sensor and the lift-off distance. The parts to be inspected are said to be magnetized near the saturation level. If not, there won’t be sufficient leakage of flux at the defect region. The sensor used in this process should have high sensitivity towards the flux leakage. The lift-off distance plays a vital role in this inspection process. It is defined as the distance between the magnetizing material and the part to be magnetized. A lower lift-off distance results in effective magnetization on the testing surface (Sun and Kang, 2010; JANSEN et al., 1994).
Fig. 1 represents the principle of the MFL inspection used in this work. Here, the permanent magnet serves as the magnetization source for magnetizing the pipe wall and the GMR sensor is used as the sensing element to detect the flux leakage. The pipe wall is magnetized near the saturation limit and the local magnetization is implemented in the inspection area. If there are no defects in the pipe wall, the flux lines will be uniformly distributed. But if the pipe wall has some defects, there will be some volumetric changes in the flux. In addition, due to the difference in the magnetic permeability between the flaw region and the non-defect region, some parts of magnetic flux lines will start to leak out from the defect region. This flux leakage is sensed by the GMR sensor array, placed between the permanent magnet and the pipe wall. Thus, the leaked data is recorded and plotted as the waveform graph. By analyzing this data, the defect region is localized as a result of the amplitude (voltage) variations in the plotted graph (Lijian et al., 2009; LiYing et al., 2012; Liu et al., 2013).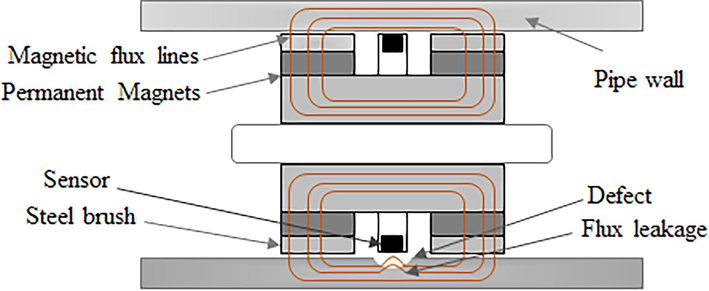
MFL working principle.
2.2 3D finite element analysis of MFL system
The fundamental electromagnetic phenomena of the MFL system are always consistent with well-known electromagnetism. In the MFL modeling, Maxwell equations are used to evaluate the magnetic and the electric phenomena. Our work is focused on using the permanent magnet as the magnetization source, the magnetostatic analysis is taken into account without considering the electric field (Li et al., 2007). Hence the magnetostatic in the MFL process is governed by the Maxwell relations (Eqs. (1) and (2)).
2.3 Construction of FEM model
Fig. 2 shows the constructed solid model for the ANSYS simulation. It consists of a yoke with two permanent magnets attached to the brushes. NdFeB (N42 grade) is used as the permanent magnet material due to its notable characteristics such as lightweight, less volume and greater coercivity, whereas the brush and yoke are of the same materials of steel. The specimen represents the material to be inspected (steel pipe). A 6 mm diameter hole (defect) is introduced at the center of the specimen to analyze the magnetic flux leakage at the defect region. The relative permeability is said to be 186,000.
Constructed 3D solid model.
ANSYS Maxwell simulation provides information on the behavior of a system by creating 2D or 3D models in the digital environment. Fig. 3 shows the flow process of modeling and analysis setup of the Magnetic flux leakage technique. This ANSYS simulation is carried out without considering the air model. After defining the characteristics of the permanent magnet in the material property section, the equivalent current is applied to each element and node of the meshed model (Ji et al., 2009). By solving this model, the magnetic field distribution is obtained accounting for the effects of the lift-off distance. This process is repeated for numerous values of the lift-off distance at 1 mm to 3 mm from the wall surface and their effects were analyzed based on the field distribution. Finally, a better FEM model (Fig. 4) is built after optimizing the lift-off distance value as 1 mm.
Flowchart of FEM based approach for optimization of MFL technique.

Simulated response of the magnetic flux density for the hole defect.
3 Experimentation
3.1 Measurement setup
The MFL inspection process is carried out using an in-line inspection robot. It consists of the magnetizing unit and the detection unit. The magnetizing unit provides the necessary magnetic field and the detection unit senses the flux leakage. The body (chassis) of the robot is made by using the Polylactide (PLA) filament through the 3D printing process. This filament reduces the total weight of the robot when compared with the metal chassis. It also exhibits outstanding characteristics required for FDM (Fused Deposition Modelling) process during the 3D printing (Tymrak et al., 2014). The mechanical structure of this moving robot is designed using SOLIDWORKS software which serves as the input for the 3D printer. The magnetizing unit consists of two NdFeB permanent magnets (20 × 40 × 10 mm3), yoke (80 × 40 × 14 mm3) and two steel brushes (20 × 40 × 5 mm3), respectively. The magnet is placed between the yoke and steel brushes. The detection unit comprises a flexible GMR sensor array of six sensors mounted on a printed circuit board (PCB). The distance between the sensors mounted on the PCB is 10 mm. This sensor array can detect minute volumetric variations occurring in the flux. This array is positioned between the two magnets and the yoke’s center. The working setup and the proposed system are illustrated in Fig. 5.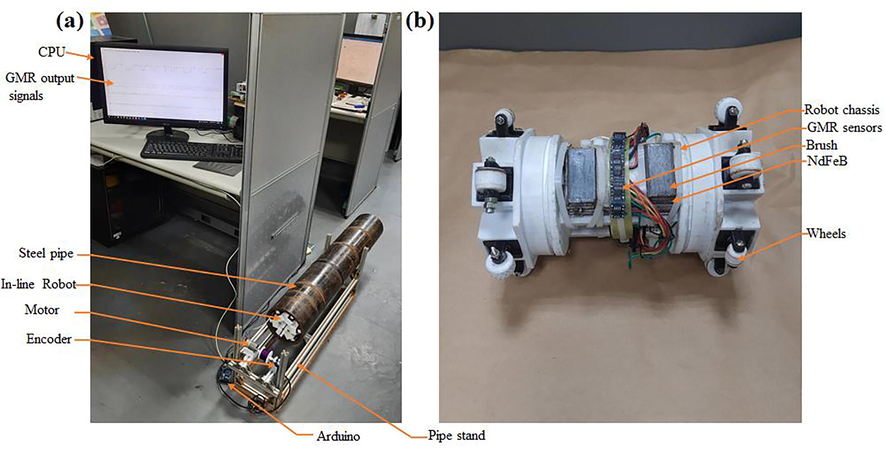
(a) Working setup (b) Proposed system consisting of flexible GMR sensor array and permanent magnet.
The robot movement is offered by the electric motor and controlled by the joystick. The wheels of the robot are supported using the spring suspension system to balance the robot’s movement and control the noise during the measurement data. The Arduino UNO attached to the backside of the detection unit is responsible for the overall control of the inspection process. It is run by using the program written in sketch software. The robot moves inside the steel pipe and the local magnetization is implemented in the inner surface by the magnetizing unit. The sensor array will detect the flux leakage at the defect region and the array data were recorded with the help of Arduino. The collected data were plotted as the waveform graph. The flux leakage at the defect region is depicted as the voltage variations in this graph. This variation will represent the defect location in the pipe. Thus the obtained results were presented.
3.2 Artificial defect
To evaluate the performance of the proposed in-line robot, artificial defects were introduced in the 6-inch diameter steel pipe as shown in Fig. 6(a–e). This pipe is 1.5 m long, 7.2 mm thick, and equally cut into three sections. Four sets of defects were made artificially with different shapes and sizes. In the first section, the center of the pipe was cut into two sections using an Electrical discharge machining (EDM) process. Then developed for different depths of the holes on the inner surface. The size of the defects in the first section is designed for 8 mm diameter holes at various depths in the axial direction and a 6 mm diameter through holes along the circumference of the steel pipe. The second section rectangular slots were developed with different depths in the circumference of the pipe. The last section contains LMA defects (Loss of Metallic cross-sectional Area) at various depths along with the corrosion defects. Finally, all three sections are joined together to start the inspection process.
Structural defects (a) Axial holes, (b) Circumferential holes, (c) Rectangular slots, (d) LMA defects, and (e) Corrosion.
4 Results and discussion
The MFL inspection process is carried using the designed robot for investigating the carved artificial defects inside the pipe. The local magnetization is implemented by the permanent magnet and the flux leakage is interrogated by the flexible GMR sensor array consisting of six sensors namely S1, S2, S3, S4, S5, and S6 respectively. Further discussions are as follows:
4.1 Axial and circumferential holes
Fig. 6a represents the three axial holes of 8 mm diameter with 2, 4, and 6 mm depths in the steel pipe. The distance between each hole is said to be 20 mm. After the inspection process, the obtained GMR array responses are shown in Fig. 7a. From this figure, it can be inferred that the sensor S4 shows voltage variations while the robot crosses the defect region. Because this sensor is located near to the defect region and the remaining sensors are located at some distance from the inner surface which reduces the sensing ability. On analyzing the voltage variation of the S4 plot, the 6 mm depth hole experiences maximum leakage of flux which is represented by the higher peak in its signal amplitude. In addition, a constant decrease in amplitude is obtained for the 4 mm and 2 mm depths due to the low level of flux leakage. Thus higher depth experiences maximum leakage of magnetic flux (Sharatchandra Singh et al., 2011). And the SNR was observed at 17, 18, and 19 dB, respectively.
GMR sensors response for (a) Axial holes of the same diameter with various depths (b) Circumferential through-holes.
Fig. 7b shows the voltage variations of the three through-holes of 6 mm diameter (Fig. 6b) along the circumference of the pipe. These defects can be sensed by more sensors compared to the axial holes due to their alignment along the circumference. The obtained GMR response is in the form of a stack and the sensors S3, S4, and S5 have better sensitivity towards the detection than the other sensors. These sensors are very near to the holes compared with the S1, S2, and S6 sensors. The SNR of the obtained sensor signal of S5, S4, S3 was calculated at 10, 17, and 19 dB, respectively. Since the pipe inner surface is not smooth, there are some noises were observed in the plots due to the mechanical vibrations of the robot system (Kreutzbruck et al., 2012; Wu et al., 2015).
4.2 Rectangular slots
Fig. 6c shows the rectangular slot carved in the steel pipe along its circumference with the size of 20 mm length, 15 mm width at various depths such as 1, 3, 5, and 7 mm, respectively. After the inspection, the GMR sensor array responses have been recorded and plotted as in Fig. 8(a–d). Since the area occupied by the rectangular slot is nearly twice than that of the axial and circumferential holes, the probability of sensors recognizing the defect also increases. For the 1 mm depth rectangular slot, the recorded response is shown in Fig. 8a. As expected, it can be seen that this defect is sensed by four sensors namely S2, S3, S4, and S5 respectively. The amplitude response of S2 and S5 is lower than that of S3 and S4. S4 exhibits a maximum peak in amplitude since it is located very near to the defect region than S2, S3, and S5. Further increasing the depth to 3 mm results in an increase in the signal amplitude of S4 (Fig. 8b). The voltage variations of the 5 mm and 7 mm depth rectangular slots are represented in Fig. 8c and d. From these figures, it is evident that the higher depth will exhibit greater leakage of flux. For the 7 mm depth, the sensor S4 has the maximum peak response compared to the 1, 3, and 5 mm depth. In addition, all the rectangular slots are recognized by more than one sensor due to the increase in the defect area.
GMR sensors response for rectangular slots of (a) 1 mm depth (b) 3 mm depth (c) 5 mm depth and (d) 7 mm depth.
4.3 LMA and corrosion defects
Generally, pipelines are prone to many types of corrosion attacks due to the prevailing environmental conditions. These attacks are unavoidable and able to penetrate through the pipes resulting in massive destruction. In the oil and gas industry, the molten salt deposits found in the pipes consist of chloride and sulfide which readily reacts with the steel surface forming corrosion that leads to catastrophic failure due to diffusion of sediments into the steel under elevated temperature conditions (Yang and Cheng, 2012). To evaluate the early and later stages of corrosion, we use the saw cutter to develop the early stage of metal removal (LMA) to a particular depth (Sharatchandra Singh et al., 2011) and for the later stage, uneven metal removal was carried out in a particular area inside the pipe. Fig. 6d shows the three saw cut that represents the LMA having 3 mm width with a various depth of 1, 3, and 5 mm, respectively. These saw cuts are created axially and mimic the early stages of corrosion. The corresponding voltage response for the three saw cut from the GMR sensor array is shown in Fig. 9a. From this figure, it can be inferred that the sensors S3, S4 and S5 have sensitivity towards these saw cuts. The greater peaks are observed in S4 which proves that it has high sensitivity and experiences greater leakage of flux than S3 and S5 sensors. The SNR of the S4 sensor was observed at 18, 19, and 20 dB, respectively. In addition, there is a decreasing trend of amplitude is observed in S4 as the saw cut depth decreases.
GMR sensors response for (a) LMA at various depths of 1, 3 and 5 mm (b) Corroded area.
Fig. 6e exhibits the uneven metal removal from the inner surface which was performed using the mini hand engraver. This uneven metal removal from the inner surface mimics the corroded area in the steel pipe. On evaluating the plotted voltage variations for the corroded area (Fig. 9b), the wider area of the metal removal leads to get recognized by three sensors (S3, S4 and S5). Out of these, S3 recorded very low peaks whereas S4 has broad and high peaks compared to S5. This broad peak proves the existence of uneven metal removal in the inspected area. Hence, the proposed in-line robot system works effectively for evaluating different types of structural defects in the steel pipes with better SNR without signal processing and amplification.
5 Conclusion
This work is attempted to evaluate the inner defects in the steel pipe using an in-line inspection robot. The permanent magnet is used as the excitation source for implementing the local magnetization in the inspection area and the flux leakage from the defect region is sensed using the flexible GMR sensor array of six sensors. With the aid of ANSYS Maxwell 3D software, the finite element model is developed and lift-off distance has been optimized to 1 mm. For evaluating our proposed model, artificial defects such as holes, rectangular slots, LMA, and corrosion defects were introduced in a 6-inch diameter steel pipe in both axial and circumferential directions. After the inspections process, the data from the array were collected using the Arduino and plotted as the waveform graph. Thus, the defects were localized based on the voltage variation among the six sensors and all waveforms exhibit good signal to noise ratio without signal processing and amplification, resulting in the clear identification of the defect region.
Acknowledgments
This research was supported by the Ministry of Science and Technology of Taiwan (Grant No. MOST 109-2637-E-027-009).
Declaration of Competing Interest
The authors declare that they have no known competing financial interests or personal relationships that could have appeared to influence the work reported in this paper.
References
- Magnetic flux leakage measurement setup for defect detection. Procedia Eng.. 2010;5:1401-1404.
- [Google Scholar]
- Hazard analysis of failure of natural gas and petroleum gas pipelines. J. Loss Prev. Process Ind.. 2016;40:217-226.
- [Google Scholar]
- A GMR–ECT based embedded solution for applications on PCB inspections. Sens. Actuators, A. 2011;167(1):25-33.
- [Google Scholar]
- Optimal operation of pipeline transportation systems. IFAC Proceedings Volumes. 1990;23(8):455-460.
- [Google Scholar]
- Optimization of natural gas pipeline transportation using ant colony optimization. Comput. Oper. Res.. 2009;36(6):1916-1923.
- [Google Scholar]
- A giant-magnetoresistance sensor for magnetic-flux-leakage nondestructive testing of a pipeline. Russ. J. Nondestruct. Test.. 2005;41(7):462-465.
- [Google Scholar]
- Magnetisation as a key parameter of magnetic flux leakage pigs for pipeline inspection. Insight (Northampton). 1994;36(9):672-677.
- [Google Scholar]
- Application of 3-D FEM in the simulation analysis for MFL signals. Insight: Non-Destr. Test. Cond. Monit.. 2009;51(1):32-35.
- [Google Scholar]
- Kreutzbruck, M., Neubauer, A., Pelkner, M. and Reimund, V., 2012, April. Adapted gmr array used in magnetic flux leakage inspection. In 18th World Conference on Nondestructive Testing, Durban.
- Review and analysis of three representative electromagnetic NDT methods. Insight: Non-Destr. Test. Cond. Monit.. 2017;59(4):176-183.
- [Google Scholar]
- August. Sensor development and application on the oil-gas pipeline magnetic flux leakage detection. In: 2009 9th International Conference on Electronic Measurement & Instruments. 2009. p. :2-876.
- [Google Scholar]
- Comparison of Magnetic Flux Leakage (MFL) and Acoustic Emission (AE) techniques in corrosion inspection for pressure pipelines. In: Proceedings of the 31st Chinese control conference. IEEE; 2012. p. :5375-5378.
- [Google Scholar]
- Application of zero-phase digital filter in magnetic flux leakage testing for tank floor inspection. In: Applied Mechanics and Materials, Trans Tech Publications Ltd. 2013. p. :1644-1648.
- [Google Scholar]
- Experiment and simulation study of 3D magnetic field sensing for magnetic flux leakage defect characterisation. NDT&E Int.. 2007;40(2):179-184.
- [Google Scholar]
- Mahmoodian, M., 2018. Reliability and maintainability of in-service pipelines. Gulf Professional Publishing. Cambridge, MA, USA: Elsevier. ISBN: 9780128135785, 1-48.
- Milidiú, R.L., dos Santos Liporace, F. and de Lucena, C.J., 2003. Pipesworld: Planning pipeline transportation of petroleum derivatives. Edelkamp, & Hoffmann (Edelkamp & Hoffmann), In Proceedings of ICAPS’03—Workshop on the competition: Impact, organization, evaluation, benchmarks. Trento, Italy.
- Niese, F., Yashan, A. and Willems, H., 2006, September. Wall thickness measurement sensor for pipeline inspection using EMAT technology in combination with pulsed eddy current and MFL. In 9th European Conference on NDT, Berlin, 18, pp. 45-52.
- Enhanced detection of defects using GMR sensor based remote field eddy current technique. J. Magn.. 2017;22(4):531-538.
- [Google Scholar]
- Analysis of magnetic-flux leakage (MFL) data for pipeline corrosion assessment. IEEE Trans. Magn.. 2020;56(6):1-15.
- [Google Scholar]
- Pelkner, M., Stegemann, R., Sonntag, N., Pohl, R. and Kreutzbruck, M., 2018. Benefits of GMR sensors for high spatial resolution NDT applications. AIP Conf. Proc. AIP Publishing LLC, 1949, No. 1, p. 040001.
- Popovic, R.S., Drljaca, P.M. and Schott, C., 2002. Bridging the gap between AMR, GMR, and Hall magnetic sensors. In 2002 23rd International Conference on Microelectronics. Proceedings (Cat. No. 02TH8595), 1, pp. 55-58.
- Safety of buried steel natural gas pipelines under earthquake-induced ground shaking: A review. Soil Dyn. Earthq. Eng.. 2018;106:254-277.
- [Google Scholar]
- Microwave detection of stress-induced fatigue cracks in steel and potential for crack opening determination. J. Nondestruct. Eval.. 2000;12(2):87-103.
- [Google Scholar]
- Corrosion protection coating for buried pipelines: a short review. World Appl. Sci. J.. 2012;4:524-531.
- [Google Scholar]
- Intergranular stress corrosion cracking of steel gas pipelines in weak alkaline soil electrolytes. Eng. Failure Anal.. 2018;94:87-95.
- [Google Scholar]
- GMR-based magnetic flux leakage technique for condition monitoring of steel track rope. Insight: Non-Destr. Test. Cond. Monit.. 2011;53(7):377-381.
- [Google Scholar]
- Detection of localized damage in water wall tubes of thermal power plants using GMR sensor array based magnetic flux leakage technique. J. Nondestruct. Eval.. 2015;34(3):1-7.
- [Google Scholar]
- Magnetic compression effect in present MFL testing sensor. Sens. Actuators, A. 2010;160(1–2):54-59.
- [Google Scholar]
- Thakur, P., 2019. Advanced mine ventilation. Respirable Coal Dust, Combustible Gas and Mine Fire Control. Elsevier, pp.157-187.
- Mechanical properties of components fabricated with open-source 3-D printers under realistic environmental conditions. Mater. Des.. 2014;58:242-246.
- [Google Scholar]
- 3-D FEM simulation and analysis on the best range of lift-off values in MFL testing. J. Test. Eval.. 2015;43(3):673-680.
- [Google Scholar]
- A review on pipeline integrity management utilizing in-line inspection data. Eng. Failure Anal.. 2018;92:222-239.
- [Google Scholar]
- Parametric effects on the erosion–corrosion rate and mechanism of carbon steel pipes in oil sands slurry. Wear. 2012;276:141-148.
- [Google Scholar]
- Yashan, A., Bisle, W. and Meier, T., 2006. Inspection of hidden defects in metal-metal joints of aircraft structures using eddy current technique with GMR sensor array. Proc. 9th ECNDT, Berlin, pp. 1-8.


