

Translate this page into:
Impact of various irrigation levels and nitrogen rates on wheat (Triticum aestivum L.) yield and nitrate leaching
⁎Corresponding author. Rehmatullahsoil123@gmail.com (Rehmat Ullah)
-
Received: ,
Accepted: ,
This article was originally published by Elsevier and was migrated to Scientific Scholar after the change of Publisher.
Peer review under responsibility of King Saud University.
Abstract
Background
Nitrogen (N) is a crucial macronutrient for plants and serves as a significant measure of soil productivity. The leaching of N-nitrate creates significant hazards for human health and ground water quality. Supplemental irrigation applied to various field crops significantly alters crop yield and nitrate (NO3–) leaching within the soil. Determining the influence of various N rates and irrigation levels on yield and NO3– leaching could help to select the optimum combination of irrigation and N.
Methods
The influence of various irrigation levels and N rates on NO3– leaching, soil physicochemical characteristics and grain yield of wheat crop was investigated. Two irrigation levels, i.e., I1 and I2 (60% and 75% of field capacity) and three N levels, i.e., 105, 130 and 160 kg/ha named as N1, N2 and N3 were included in the study. The irrigation and N levels were optimized in preliminary studies. Data relating to yield-related characteristics of wheat and soil physicochemical properties were recorded.
Results
The growth and yield traits of the wheat crop were considerably influenced by varying degrees of irrigation N application. The interactive effect of I2N3 resulted in the highest numbers of tillers m−2 (18.9), 1000-grain weight (40.3 g), and straw (5.87 t ha−1) and grain (4.17 t ha−1) yields. Irrigation significantly affected infiltration rate, hydraulic conductivity of the saturated soil and soil strength. The bulk density of soil increased, while soil porosity decreased with increasing depth. Economic analysis revealed that higher irrigation and N levels, i.e., I2N3 resulted in the highest net economic returns. The NO3– concentration was significantly affected by soil depth and time after application of fertilizer. The NO3– concentration exhibited its greatest value at a depth of 0.35 m, while its lowest value was seen at a depth of 1 m. In addition, the concentration of NO3– exhibited a decline throughout the course of time after the administration of N.
Conclusion
It is concluded that higher application of irrigation water and N fertilizer increased wheat yield and economic returns, and NO3– leaching. Therefore, alternative N sources with lower NO3– leaching must be used to reduce the adverse impacts on groundwater and environment.
Keywords
Nitrogen-nitrate
Hydraulic conductivity
Soil organic carbon
NPK uptake

1 Introduction
Nitrogen (N) and water shortages exert significant negative impacts on the global agricultural systems. Adequate N and water availability are essential prerequisites for achieving an optimal and high-quality gain yield (Zörb et al., 2018). Nitrogen has a crucial role as an essential constituent of chlorophyll, proteins, various nucleic acids, and other fundamental molecules (Leghari et al., 2016). The significance of this phenomenon is elucidated by its pivotal function in the development of plants and the enhancement of agricultural output (Leghari et al., 2016). It is an essential element that performs vital functions such as protein synthesis, chlorophyll production, energy production, and root development (Liu et al., 2022). Plants are unable to grow and flourish in the absence of adequate N (Zhao et al., 2005). It has been stated that the modification of N application on a global scale has a substantial impact on the productivity of crops. (Guo et al., 2022). However, higher application of N causes environmental problems in the areas where crop production is reliant on extensive irrigation (Barakat et al., 2016; Zhang et al., 2018).
Intensive cropping in regions characterized by a low groundwater table has led to the contamination of groundwater and the depletion of water resources (Magesan et al., 2002). The N lost through leaching from agricultural soils is subjected to significant variation, contingent upon several factors such as the quantity and type of fertilizer used, soil type and composition, climatic conditions, and cropping techniques. It has been reported that ∼20–30% of the N used in agricultural soils is lost through leaching. Nevertheless, in certain instances, the proportion of lost N via leaching may be substantially greater, with figures exceeding 50% in certain regions (Galloway, 2005; Galloway et al., 2004; Zhao et al., 2022a).
Leaching refers to the process of soluble salts being transported downwards through various soil layers via water (Lal et al., 2015; Zhao et al., 2022b). Generally, nitrate (NO3–) leaching can exert considerable adverse effects on soil quality and fertility, and well-being of humans and the ecosystem (Bouchard et al., 1992; Redwan et al., 2020). The process of nitrate leaching results in the depletion of essential nutrients, eventually causing a decline in both plant growth and production (Padilla et al., 2018). However, the leaching of NO3– has been shown to result in the contamination of both aquifer and surface water. The presence of high levels of NO3– ions in potable water is a potential hazard to human well-being (Bouchard et al., 1992; Lal et al., 2015; Redwan et al., 2020). Therefore, implementation of strategies aimed at mitigating NO3– leaching and fostering sustainable soil management practices is of paramount significance (Nouri et al., 2022).
Irrigation significantly contributes towards NO3– leaching, especially in regions characterized by coarse-textured soils. The application of irrigation water causes percolation through soil profile, which may result in the transportation of soluble N, predominantly in the form of NO3–. If the quantity of irrigation water applied surpasses the water holding capacity of the soil, NO3– may leach beyond the root zone, and has the potential to result in the pollution of groundwater or surface water. Compared to reduced drainage and low N application, higher drainage led to elevated levels of groundwater pollution (Grignani and Zavattaro, 2000). Flood irrigation is the predominant approach for the application of fertilizer to diverse crops. This approach results in an irregular distribution of essential elements to crops, increases the amount of nutrient runoff, which adversely affect crop productivity (Fan et al., 2014). Hence, by adjusting the quantity of water used, it is possible to reduce N losses and mitigate associated issues.
Wheat (Triticum aestivum L.) crop has an active root zone of 0.2 m due to shallow roots. Hence, increased irrigation frequency or rainfall results in greater N loss (Wang et al., 2022). Greater nitrogen application than crop needs also causes considerable N loss through leaching or gaseous emissions (He et al., 2023). Nitrate leaching is a prevalent concern in wheat cultivation. Nitrogen is a crucial element required for wheat plants; therefore, farmers use N-fertilizers to improve wheat production (Lu et al., 2019). However, overuse of N-fertilizers may result in the accumulation of NO3– in the soil, which can subsequently seep into surface water or groundwater. The leaching of NO3– in wheat cultivation can result in adverse impacts on both the ecosystem and human well-being. Therefore, reducing N losses in wheat is of paramount importance since wheat grains are directly consumed by humans.
The primary objective of this research was to examine the impacts of irrigation and N doses interaction on NO3– leaching, soil properties, yield, and economic returns of wheat crop. Our hypothesis posited that increasing the rate of N application and irrigation water level would lead to greater N losses in comparison to lower levels of irrigation and N application.
2 Materials and methods
2.1 Experimental site
The current study was conducted at a famer field in Dera Ghazi Khan, Pakistan. The previous crop was cotton and the experimental field followed cotton-wheat rotation for the last five years.
2.2 Treatments
Two irrigation levels, i.e. I1 (60% field capacity) and I2 (75% field capacity) and three nitrogen levels, i.e., N1 (105 kg N ha−1), N2 (130 kg ha−1), and N3 (160 kg ha−1) were included in the study. Irrigation and N levels suitable for the study area were optimized in a preliminary study. The experimental design used in this study followed a randomized full block design with split plot layouts. The main plots were irrigation levels, whereas the sub plots had randomized N levels. The application of irrigation water was conducted using a cutthroat flume. The application of N occurred in three equal splits, i.e., at the time of sowing, and during the first and second irrigation events. To mitigate any bias in the treatments, the experimental plots were uniformly treated with the recommended levels of phosphorus (P) and potassium (K).
2.3 Agronomic attributes
Data related to plant height, number of productive (spike-bearing) tillers m−2, 1000-grain weight, grain and straw yields and harvest index were recorded at maturity of the crop. From each experimental unit, the heights of 10 randomly chosen plants were measured and averaged. The number of productive tillers in 1 m2 area were counted from three random places in each treatment and averaged. The whole experimental unit was harvested at maturity, and threshed manually to record straw and grain yields, which were then converted to tons ha−1 using unitary method. Each experimental unit had three 1000-grain samples drawn at random, weighed, and averaged. The ratio of grain yield to biological yield, reported as a percentage, was used to calculate the harvest index. The roots were extracted from 0 to 15 cm depth after crop harvest, dried and weighed to record root biomass. Water use efficiency was computed according to equation (1).
2.4 Soil properties
To determine distinct soil properties before and after crop harvest, soil samples were taken from all experimental units. To make the analysis easier, the collected samples were allowed to air dry before being sieved through a 2 mm screen. The measurement of soil bulk density was conducted in accordance with the methodology outlined by Blake and Hartge (1986). Soil porosity was estimated by using the methodology proposed by Danielson and Sutherland (1986). According to Nelson and Sommers (1996), soil organic carbon in samples taken from 0 to 5, 5–10, 10–20, and 20–30 cm of soil depth was assessed by dichromate oxidation. Soil porosity was determined according to Danielson and Sutherland (1986). The soil samples (collected from 35, 70 and 100 cm soil depth) were extracted using a 2 mol L−1 KCl solution at a ratio of 1:5 (mass to volume). The NO3– concentration was then determined by using the vanadium oxidation technique Doane and Horwáth (2003). Soil infiltration rate and penetration resistance were determined by the procedure given by Zalacáin et al. (2019). Similarly, hydraulic conductivity was measured according to Ragusa et al. (1994). Table 1 lists the soil characteristics prior to the experiment’s initiation.
Characteristics
Unit
Value
Sand
%
40
Silt
%
37.5
Clay
%
22.5
Textural Class
Loam
Bulk density
0–5 cm
Mg m−3
1.45
5––10 cm
1.50
10––20 cm
1.54
Infiltration rate
mm hr-1
25.4
Field saturated hydraulic conductivity
45
Penetration resistance at 9% moisture percentage
kPa
1100
ECe
dSm−1
1.45
pH
7.9
Saturation percentage
%
35.3
Na+
mmolc L-1
3.55
K+
0.67
Ca2+ + Mg2+
10.15
CO3-2
0.72
HCO3–
8.2
Cl-
4.80
SO4-2
0.78
Soil organic carbon
0–––5 cm
g kg−1
5.0
5–––10 cm
4.5
10–20 cm
3.8
Total nitrogen
0–15 cm
0.48
15–30 cm
0.35
Available phosphorus
0–15 cm
mg kg−1
9.5
15–30 cm
6.58
Available potassium
0–15 cm
124.6
15–30 cm
105
NO3–
0–10 cm
14.3
10–20 cm
14.6
20–40 cm
16.4
40–60 cm
32.5
60–80 cm
25.5
80–100 cm
15.6
2.5 Nutrient uptake by plants
The grain, straw and leaf samples were collected at harvest to determine nutrient uptake. The collected samples were oven-dried for 72 h, ground and sieved for NPK analysis. The N, P and K were then analyzed by Micro-Kjeldhal (Kirk, 1950), Dry Ashing Vanado-molybdate, and dry ashing/flame photometer methods, respectively (Page, 1982).
2.6 Statistical analysis
Analysis of variance (ANOVA) approach was used to examine the gathered information on agronomic parameters (Steel et al., 1997). Some of the parameters had non-normal distribution; therefore, those were transformed by arcsine y-transformation technique to meet the normality assumption of ANOVA. The means were compared by least significant difference test (95%) probability where ANOVA indicated significant differences among treatments. The soil attributes were graphically presented by using SigmaPlot software.
2.7 Economic analysis
The economic viability of the applied treatments was evaluated by calculating the expenses made and benefits obtained from the produce. The costs relating to land rent, land preparation, irrigation, fertilizer application, labor charges etc. were computed based on the existing prices. Similarly, the cost of straw and grain yields were combined to get the gross income. To get the net income, the costs were subtracted from the gross revenue (Byerlee and Halter, 1974).
3 Results
3.1 Agronomic attributes
Different combinations of N and irrigation levels significantly affected the agronomic attributes, except for plant height (Table 2). Overall, the combination of I2 and N3 resulted in the highest values of number of productive tillers m−2 (18.9), 1000-grain weight (40.3 g), grain yield (4.7 t ha−1), straw yield (5.87 t ha−1), root biomass (2.21 kg m3), and harvest index (41.2%). Similarly, the lowest values for number of productive tillers m−2 (16.2), 1000-grain weight (33.9 g), grain yield (3.39 t ha−1), straw yield (5.13 t ha−1), root biomass (1.02 kg m3), and harvest index (40.4%) were noted for I1N1 interaction (Table 2). In contrast, the highest (10.59 kg ha−1 mm−1) and the lowest (7.67 kg ha−1 mm−1) water use efficiency was recorded for I1N1and I2N1, interactions respectively (Table 2). The means followed by same letters within a column are statistically non-significant (p > 0.05). I1 and I2 stand for 60% and 75% field capacity, whereas N1, N2 and N3 denote 105 kg ha−1, 130 kg ha−1 and 160 kg ha-1N application, respectively.
Treatments
Plant height (cm)
Number of tillers (m−2)
1000- grain weight (g)
Grain yield (t/ha)
I1N1
82.2 a
16.2c
33.9b
3.39c
I1N2
85.4 a
17.7 abc
36.1 ab
3.62 bc
I1N3
85.3 a
18.7 a
38.4 a
3.97 ab
I2N1
89.3 a
16.5 bc
36.1 ab
3.45c
I2N2
86.0 a
18.2 ab
39.0 a
3.72 ab
I2N3
89.3 a
18.9 a
40.3 a
4.17 a
Straw yield (t/ha)
Root biomass (kg m3)
Harvest index (%)
Water use efficiency
(kg ha−1 mm−1)
I1N1
5.13b
1.02 d
40.4 abc
9.04 bc
I1N2
5.20b
1.27c
41.3 ab
9.66 ab
I1N3
5.50 ab
1.72b
42.2 a
10.59 a
I2N1
5.67 ab
1.80b
39.6c
7.67 d
I2N2
5.70 ab
1.90b
40.3 ab
8.27 cd
I2N3
5.87 a
2.21 a
41.2 a
9.27 bc
3.2 Nutrient uptake by wheat plants
Nutrient uptake was significantly altered by different combinations of N and irrigation levels included in the current study (Table 3). The highest (47.0% increase over I1N1) N uptake was recorded with I2N3 combination. Treatments I2N2 and I1N2 showed statistically similar effects (26.1 and 22.5% increase over I1N1). The highest P uptake (35.6 kg ha−1) was noted for I2N3 followed by treatment I1N3 (35.4 kg ha−1) and the lowest P uptake (28.5 kg ha−1) was noted for I1N1. The results revealed that the highest K uptake (143.1 kg ha−1) was noted in treatment combination I2N3 followed by I1N3 (138.1 kg ha−1), whereas the lowest P uptake (131.8 kg ha−1) was recorded for I1N1 (Table 3). The means followed by same letters within a column are statistically non-significant (p > 0.05). I1 and I2 stand for 60% and 75% field capacity, whereas N1, N2 and N3 denote 105 kg ha−1, 130 kg ha−1 and 160 kg ha-1N application, respectively.
Treatments
N uptake
(kg ha−1)
P uptake
(kg ha−1)
K uptake
(kg ha−1)
I1N1
75.7c
28.5 d
131.8c
I1N2
92.7b
31.5c
133.7 bc
I1N3
109.9 a
35.5 ab
138.1 ab
I2N1
80.0c
30.30 cd
134.2 bc
I2N2
95.4b
33.6b
135.3 bc
I2N3
111.3 a
35.6 a
143.1 a
3.3 Soil properties after crop harvest
Different irrigation levels significantly affected soil organic carbon (SOC) concentration, while the effect of N rates was non-significant (Fig. 1). The extent of SOC was N3 > N2 > N1 at all the sampling depths. The extent of variation was significantly noted in topsoil horizon and lesser at deeper depth. The extent of decrease in SOC was 20–30 < 10–20 < 5–10 < 0–5 cm (Fig. 1).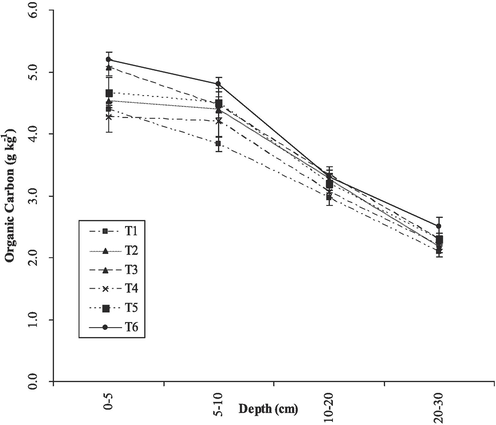
Effect of irrigation and nitrogen rates on soil organic carbon concentration (g kg−1) at wheat harvest from 0 to 5, 5–10, 10–20 and 20–30 cm depth. In the legend, T1 = I1N1 (37.5 cm irrigation + 105 kg N/ ha), T2 = I1N2 (37.5 cm irrigation + 130 kg N/ha), T3 = I1N3 (37.5 cm irrigation + 160 kg N ha−1), T4 = I2N1 (45 cm irrigation + 105 kg N ha−1), T5 = I2N2 (45 cm irrigation + 130 kg N ha−1), and T6 = I2N3 (45 cm irrigation + 160 kg N ha−1).
The NO3– concentration was not significantly affected by irrigation and significantly by N levels at 0.35 m depth (Fig. 2). The highest NO3– concentration (91.9 mg kg−1) was noted with N3 and minimum (77.3 mg kg−1) with N1. The interactive effect of irrigation and N doses was significant of NO3– concentration at 0.35 m depth. The NO3– concentration according to the interactive effect of irrigation and N doses was in the order I2N3 > I1N3 > I1N2 > I1N1. Similar results were recorded at 0.70 m depth where irrigation was non-significant, while N doses had significant effect. The application of 160 kg N ha−1 resulted in 68.2 mg kg−1 NO3– concentration at 0.7 m depth. Statistically similar results were recorded for all treatments at 1.0 m (Fig. 2). The extent of NO3– concentration regarding depth was as 0.35 m > 0.70 m > 1.0 m.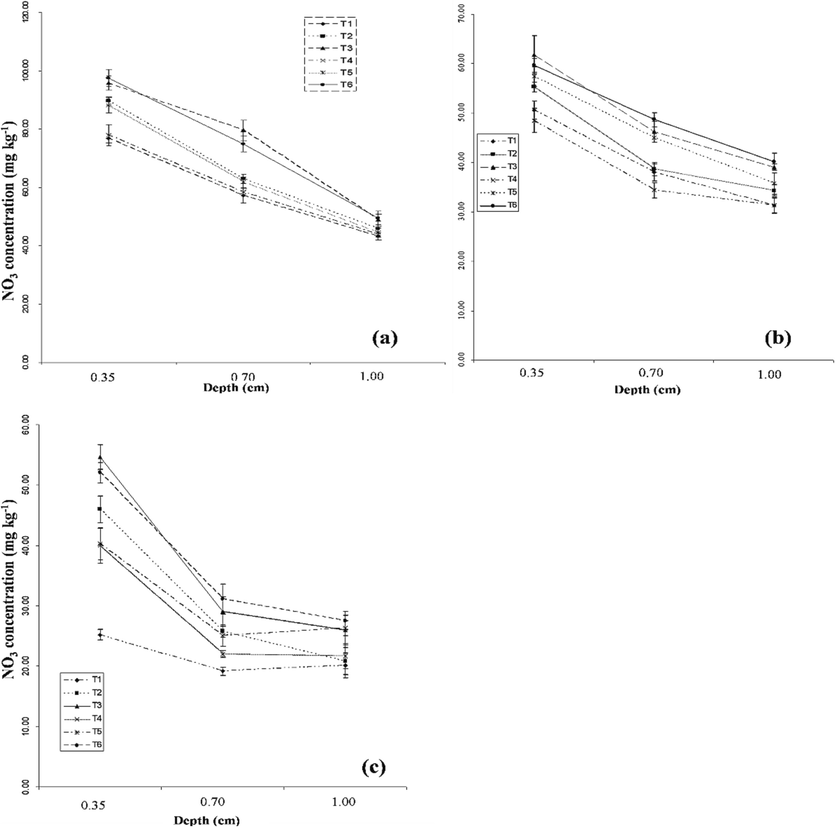
Effect of irrigation and nitrogen rates on NO3– concentration (mg kg-1soil) at 0.35, 0.7 and 1.0 m depth 50 days after sowing (a), 100 days after sowing (b) and at wheat harvest (c). In the legend, T1 = I1N1 (37.5 cm irrigation + 105 kg N/ ha), T2 = I1N2 (37.5 cm irrigation + 130 kg N/ha), T3 = I1N3 (37.5 cm irrigation + 160 kg N ha−1), T4 = I2N1 (45 cm irrigation + 105 kg N ha−1), T5 = I2N2 (45 cm irrigation + 130 kg N ha−1), and T6 = I2N3 (45 cm irrigation + 160 kg N ha−1).
Irrigation and N rates had non-significant impact on saturated hydraulic conductivity, nevertheless the highest average value of saturated hydraulic conductivity (197.4 mm hr-1) was recorded I2 followed by I1 (196.2 mm hr-1). The extent of saturated hydraulic conductivity of field was as I2N3 > I1N1 > I2N1 (Fig. 3). Irrigation had significant effect on hydraulic conductivity and a decreasing effect due to more moisture content (9%) in I2 whereas low moisture level (7%) in case of I1. The N rates affected the infiltration rate non-significantly. In case of irrigation, higher infiltration rate (34.4 mm hr-1) was observed for I1 than I2 (25.8 mm hr-1). Irrigation had a significant effect on soil penetration resistance, whereas N rates had non-significant effect in this regard. The I1 recorded the highest value of soil penetration resistance (965.7 kPa) and whereas I2 resulted in the lowest value (869.3 kPa). The mean decrease in soil strength at harvest was 10.0% in I2 compared to I1. The reduction in soil strength was due to higher water content, i.e., 9 % in I2 compared to I1 (7 %) (Fig. 3).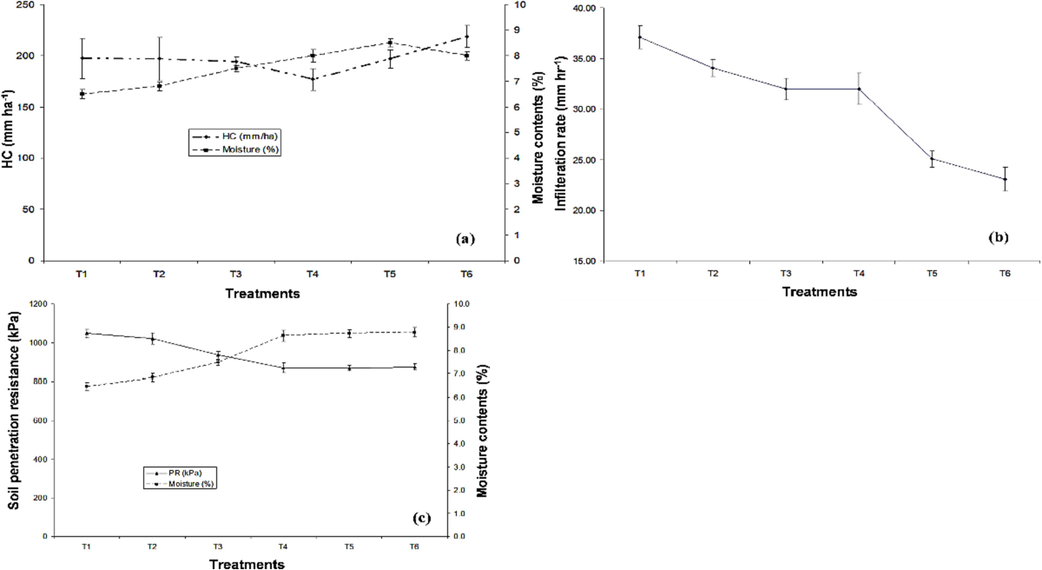
Effect of irrigation and nitrogen rates on the saturated hydraulic conductivity (a), infiltration rate (b) and soil strength (c). In the legend, T1 = I1N1 (37.5 cm irrigation + 105 kg N/ ha), T2 = I1N2 (37.5 cm irrigation + 130 kg N/ha), T3 = I1N3 (37.5 cm irrigation + 160 kg N ha−1), T4 = I2N1 (45 cm irrigation + 105 kg N ha−1), T5 = I2N2 (45 cm irrigation + 130 kg N ha−1), and T6 = I2N3 (45 cm irrigation + 160 kg N ha−1).
Lower and higher bulk density was noted for 0–5 cm and 20–30 cm soil depth, respectively. All the treatment showed non-significant impact on the bulk density of the soil, nevertheless the highest bulk density (1.55 Mg m−3) was noted for I1N1 (Fig. 4). Soil depth significantly impacted bulk density, and it ranged from 1.51 to 1.58 Mg m−3. The highest bulk density (1.58 Mg m−3) was recorded for 20–30 cm soil depth, whereas the lowest (1.51 Mg m−3) was noted for 0–5 cm. The combined effect of irrigation and fertilizer rates had non-significant effect on soil porosity. Higher soil porosity was noted at upper depth compared to lower depths (Fig. 4).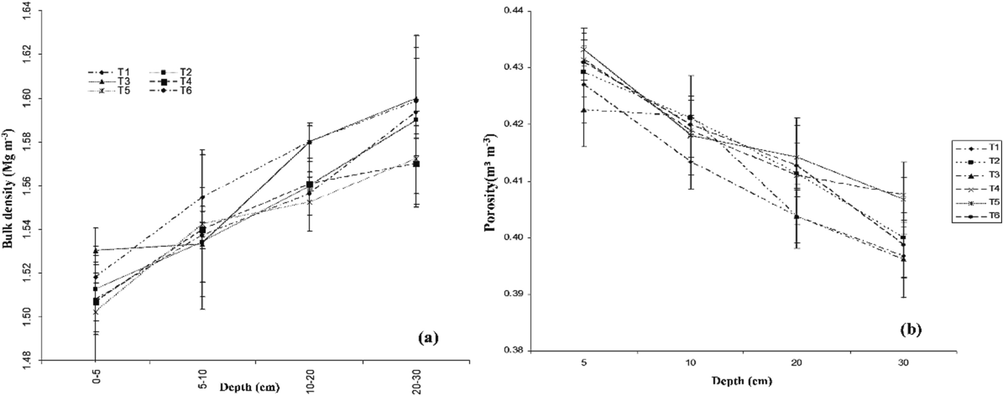
Effect of irrigation and nitrogen rates on soil bulk density (a) and soil porosity (b). In the legend, T1 = I1N1 (37.5 cm irrigation + 105 kg N/ ha), T2 = I1N2 (37.5 cm irrigation + 130 kg N/ha), T3 = I1N3 (37.5 cm irrigation + 160 kg N ha−1), T4 = I2N1 (45 cm irrigation + 105 kg N ha−1), T5 = I2N2 (45 cm irrigation + 130 kg N ha−1), and T6 = I2N3 (45 cm irrigation + 160 kg N ha−1).
3.4 Economic analysis
Economic analysis of wheat grown under different N and irrigation levels is presented in Table 4. The net returns increased with increasing N levels up to N2, while N3 decreased the net return. The highest net returns (646.57 US$) were noted for I2N3, whereas I2N1 resulted in the lowest economic returns. Here, BCR = benefit:cost ratio. I1 and I2 stand for 60% and 75% field capacity, whereas N1, N2 and N3 denote 105 kg ha−1, 130 kg ha−1 and 160 kg ha-1N application, respectively.
Treatments
Expenditure
Income from wheat
Net
Return
US$BCR
Expenses due to
Treatments US$Sowing + NPK
Expenses US$Total
ExpensesGrain
US$Straw
US$TotalTotalTotal
US$
I1N1
–
220.88
220.88
613.69
132.75
746.44
525.56
2.38
I1N2
6.9
220.88
227.78
655.87
134.47
790.34
562.56
2.47
I1N3
15.18
220.88
236.06
719.23
142.23
861.46
625.40
2.65
I2N1
25.26
220.88
246.14
624.43
142.23
766.66
520.52
2.11
I2N2
33.15
220.88
254.03
673.97
147.40
821.38
567.35
2.23
I2N3
40.44
220.88
261.32
755.32
152.57
907.89
646.57
2.47
4 Discussion
Numerous studies have investigated the effects of varying N and irrigation rates on wheat production, NO3– leaching, and soil characteristics. The use of irrigation and N has been shown to enhance wheat production; however, it is important to note that these practices may also lead to N loss and subsequent buildup of soil NO3– (Li et al., 2023). Moisture and nutrient availability (particularly N) are crucial for enhancing crop productivity. The earlier studies have reported that surface soil qualities are altered by tillage, irrigation, fertilization, and other agronomic practices (Li et al., 2023; Pirmoradian et al., 2005). This study investigated the impact of different N and irrigation rates on wheat productivity, soil properties and NO3– leaching in soil. The results revealed that higher moisture and N availability improved growth, productivity, and economic returns of wheat; however, exerted negative impacts on soil properties and NO3– leaching. The application of excessive amounts of N and the use of irrigation might intensify the process of NO3– leaching in wheat production (Zheng et al., 2020). The application of high N rate increased wheat production and economic returns in the current study compared to the application of low N. This increase in yield was accompanied by a corresponding increase in N absorption by the wheat plants and an elevation in soil N content. This can be attributed to the combined effect of N availability and use by the plants (Li et al., 2023).
Increased irrigation quantities elevate NO3– leaching. Nitrate leaching refers to the process through which NO3– is transported from the soil to groundwater or surface water. This phenomenon is of relevance within agricultural contexts, where the widespread use of fertilizers, which often include NO3–, amplifies the significance of the issue. This phenomenon can be attributed to intensified water flow, reduced N use, and the specific characteristics of the soil and fertilizer employed. The results of the current study are attributed to these processes where higher N application increased NO3– leaching due to intensified water flow, reduced N use (Kuchta et al., 2020).
Irrigation coupled with higher land use intensity tends to modify the physical characteristics of soil. This phenomenon may lead to alterations in soil properties, rendering them comparable to those seen in regions with greater precipitation levels. Under irrigation, it is possible for the volume of big pores that are responsible for drainage and aeration to decrease. The higher moisture availability under increased irrigation can be owed to these processes (Drewry et al., 2021). Similarly, higher N application also altered physical properties of soil and nutrient availability in the current study. The impacts of increased N application on soil characteristics may differ based on soil composition, climatic conditions, crop variety, and agricultural management techniques. Effective N management is of paramount importance to maximize crop output while simultaneously mitigating adverse effects on soil quality and the environment. The maintenance of soil health and the mitigation of possible adverse impacts may be achieved by carefully aligning N application rates with crop needs, while also considering soil testing and implementing effective nutrient management strategies (Drewry et al., 2021; Sainju et al., 2020). The current study revealed that although higher N application increased wheat productivity, it also increased NO3– leaching. Therefore, alternative N sources should be tested in future studies to reduce NO3– leaching.
5 Conclusion
Irrigation and nitrogen (N) levels significantly influenced yield attributes of wheat crop in the current study. A significant increase in the number of productive tillers, spike length, 1000-grain weight, number of spikelets per spike, straw as well as grain yields was observed under higher irrigation and N rates included in the study. Higher soil NO3– was noted at 35 cm and lower at 100 cm depth. Soil NO3– was decreased with the passing time after N application. It is concluded that higher application of irrigation water and N fertilizer increased wheat yield and economic returns, and NO3– leaching. Therefore, alternative N sources with lower NO3– leaching must be used to reduce the adverse impacts on groundwater and environment.
Acknowledgement
The authors extend their appreciation to the Researchers supporting project number (RSPD2023R686), King Saud University, Riyadh, Saudi Arabia.
Declaration of competing interest
The authors declare that they have no known competing financial interests or personal relationships that could have appeared to influence the work reported in this paper.
References
- Influence of the irrigation technique and strategies on the nitrogen cycle and budget: a review. Agric Water Manage.. 2016;178:225-238.
- [CrossRef] [Google Scholar]
- Blake, G.R., Hartge, K.H., 1986. Bulk density. Methods of soil analysis: Part 1 Physical and mineralogical methods 5, 363–375.
- Nitrate contamination of groundwater: sources and potential health effects. J. Am. Water Works Assoc.. 1992;84:85-90.
- [CrossRef] [Google Scholar]
- A macro-economic model for agricultural sector analysis. Am. J. Agric. Econ.. 1974;56:520-533.
- [CrossRef] [Google Scholar]
- Danielson, R.E., Sutherland, P.L., 1986. Porosity. Methods of Soil Analysis: Part 1 Physical and Mineralogical Methods 5, 443–461.
- Spectrophotometric Determination of Nitrate with a Single Reagent. Anal. Lett.. 2003;36:2713-2722.
- [CrossRef] [Google Scholar]
- Effects of irrigation on soil physical properties in predominantly pastoral farming systems: a review. N. Z. J. Agric. Res.. 2021;64:483-507.
- [CrossRef] [Google Scholar]
- Conventional flooding irrigation causes an overuse of nitrogen fertilizer and low nitrogen use efficiency in intensively used solar greenhouse vegetable production. Agric Water Manag. 2014;144:11-19.
- [CrossRef] [Google Scholar]
- The global nitrogen cycle: past, present and future. Sci. China. Ser. C, Life Sci./Chinese Acad. Sci.. 2005;48
- [CrossRef] [Google Scholar]
- Nitrogen cycles: past, present, and future. Biogeochemistry. 2004;70:153-226.
- [CrossRef] [Google Scholar]
- A survey on actual agricultural practices and their effects on the mineral nitrogen concentration of the soil solution. Eur. J. Agron.. 2000;12:251-268.
- [CrossRef] [Google Scholar]
- A global meta-analysis of crop yield and agricultural greenhouse gas emissions under nitrogen fertilizer application. Sci. Total Environ.. 2022;831:154982
- [CrossRef] [Google Scholar]
- Mitigation of nitrogen losses and greenhouse gas emissions in a more circular cropping-poultry production system. Resour. Conserv. Recycl.. 2023;189:106739
- [CrossRef] [Google Scholar]
- Nitrogen, irrigation, and alley management effects on nitrate leaching from raspberry. Vadose Zone J.. 2020;19
- [CrossRef] [Google Scholar]
- Long-term impact of wastewater irrigation and nutrient rates II. Nutrient balance, nitrate leaching and soil properties under peri-urban cropping systems. Agric. Water Manage.. 2015;156:110-117.
- [CrossRef] [Google Scholar]
- Role of nitrogen for plant growth and development: a review. Adv. Environ. Biol.. 2016;10:209-218.
- [Google Scholar]
- Effects of irrigation and nitrogen application on NO3–N distribution in soil, nitrogen absorption, utilization and translocation by winter wheat. Agric. Water Manage.. 2023;276
- [CrossRef] [Google Scholar]
- Nitrogen assimilation in plants: current status and future prospects. J. Genet. Genomics. 2022;49:394-404.
- [CrossRef] [Google Scholar]
- Accumulation and leaching of nitrate in soils in wheat-maize production in China. Agric. Water Manage.. 2019;212:407-415.
- [CrossRef] [Google Scholar]
- Effect of prolonged storage of soil lysimeters on nitrate leaching. Agr Ecosyst Environ. 2002;88:73-77.
- [CrossRef] [Google Scholar]
- Nelson, D.W., Sommers, L.E., 1996. Total carbon, organic carbon, and organic matter. Methods of soil analysis: Part 3 Chemical methods 5, 961–1010.
- When do cover crops reduce nitrate leaching? A global meta-analysis. Glob. Chang. Biol.. 2022;28:4736-4749.
- [CrossRef] [Google Scholar]
- Global trends in nitrate leaching research in the 1960–2017 period. Sci. Total Environ.. 2018;643:400-413.
- [CrossRef] [Google Scholar]
- Page, A.L., 1982. Methods of soil analysis-Part 2: Chemical and Microbiological properties, second ed. Am. Soc. Agron. Inc. Publ.Madison, USA 9.
- Application of fractal theory to quantify soil aggregate stability as influenced by tillage treatments. Biosyst. Eng.. 2005;90:227-234.
- [CrossRef] [Google Scholar]
- The effect of microorganisms, salinity and turbidity on hydraulic conductivity of irrigation channel soil. Irrig. Sci.. 1994;15:159-166.
- [CrossRef] [Google Scholar]
- Sources and health risk assessments of nitrate in groundwater, West of Tahta area, Sohag. Egypt. Episodes. 2020;43:751-760.
- [CrossRef] [Google Scholar]
- M. Sainju, U., Ghimire, R., P. Pradhan, G., 2020. Nitrogen Fertilization I: Impact on Crop, Soil, and Environment. In: Nitrogen Fixation. IntechOpen. https://doi.org/10.5772/intechopen.86028.
- Steel, R.G.D., Torrie, J.H., Dickey, D., 1997. Principles and procedure of statistics. A biometrical approach, third ed. McGraw HillBookCo. Inc., New York, pp. 352–358.
- Integrated organic and inorganic fertilization and reduced irrigation altered prokaryotic microbial community and diversity in different compartments of wheat root zone contributing to improved nitrogen uptake and wheat yield. Sci. Total Environ.. 2022;842:156952
- [CrossRef] [Google Scholar]
- Influence of reclaimed water irrigation in soil physical properties of urban parks: a case study in Madrid (Spain) Catena (amst). 2019;180:333-340.
- [CrossRef] [Google Scholar]
- Human health risk assessment of groundwater nitrogen pollution in Jinghui canal irrigation area of the loess region, northwest China. Environ. Earth Sci.. 2018;77:273.
- [CrossRef] [Google Scholar]
- Global reactive nitrogen loss in orchard systems: a review. Sci. Total Environ.. 2022;821:153462
- [CrossRef] [Google Scholar]
- Agronomic and environmental factors influencing the marginal increase in nitrate leaching by adding extra mineral nitrogen fertilizer. Agric. Ecosyst. Environ.. 2022;327
- [CrossRef] [Google Scholar]
- Nitrogen deficiency effects on plant growth, leaf photosynthesis, and hyperspectral reflectance properties of sorghum. Eur. J. Agron.. 2005;22:391-403.
- [CrossRef] [Google Scholar]
- Nitrogen supply modulates nitrogen remobilization and nitrogen use of wheat under supplemental irrigation in the North China Plain. Sci. Rep.. 2020;10:3305.
- [CrossRef] [Google Scholar]
- Perspective on wheat yield and quality with reduced nitrogen supply. Trends Plant Sci.. 2018;23:1029-1037.
- [CrossRef] [Google Scholar]


