

Impact of placement and field conditions on hydraulic conductivity and lifetime of liners
⁎Corresponding author. ena_almahpashi@hotmail.com (Ahmed M. Al-Mahbashi) aalmahbashi@ksu.edu.sa (Ahmed M. Al-Mahbashi)
-
Received: ,
Accepted: ,
This article was originally published by Elsevier and was migrated to Scientific Scholar after the change of Publisher.
Peer review under responsibility of King Saud University.
Abstract
The sand-expansive clay liners have a wide application in geoenvironmental and geotechnical projects as hydraulic barriers or cover layers in waste management systems. The flow and mass variations have a significant effect on the hydraulic conductivity of sand-expansive clay liners during their lifetime. This study suggests the use of flooding and/or standing water as a technique to ensure adequate long-term performance. The placement conditions and environmental exposures do have a major effect on the lifetime of liners. The performance of liners is influenced by the size of fluid flow, mass stability, and applied vertical-stresses. This study aimed at investigating the effect of flow and mass variations on the hydraulic conductivity of sand-expansive clay liners during their lifetime. A series of permeability tests were conducted for compacted specimens of sand-expansive clay mixtures with 15 and 20% clay content and sand with 15%-bentonite. The influence of two different vertical stresses (7 and 30 kPa) on the hydraulic conductivity of sand-expansive clay mixture with 20% clay content is monitored and compared over 100 days period, applying a continuous flow of water. The effect of temperature variations and volume-changes were also observed. It was found that the hydraulic conductivity initially measured would not remain stable when subjected to continuous flow for an extended time. The mass loss contributed initially to increasing the hydraulic conductivity until a certain stage where the hydraulic conductivity improves due to soil-structure collapse. The outcome of this work suggests the use of flooding and/or standing water as a technique to ensure adequate long-term performance to accommodate the influence of placement and environmental exposure.
Keywords
Hydraulic conductivity
Clay
Bentonite
Liners
Lifetime
Vertical stress

1 Introduction
The design of constructed hydraulic barriers or cover layers in waste management systems depends on the hydraulic conductivity as a prime factor. The value of the hydraulic conductivity controls the decision for the selection of lining material, layer thickness, and the geometry of the system. Sand-expansive clay and sand-bentonite mixtures have been widely used in the design of waste control barriers and liner systems (Daniel, 1984; Chapuis, 1990; Kenney et al., 1992; Sällfors and Öberg-Högsta, 2002; Lake and Rowe, 2005; Cui et al., 2008; Obrike et al., 2009; Dafalla, 2014; Dafalla and Obaid, 2018; Al-Mahbashi and Dafalla, 2019). The use of by-products or additives to improve the hydraulic conductivity received wide attention in recent studies (Falacinski and Szarek, 2016; Alnuaim et al., 2020; Julina and Thyagaraj, 2020; Xu et al., 2020).
The lifetime and serviceability conditions of sand-expansive clay liners are very significant in the design of waste containment and cover layers used in the landfill site. Due to the difficulties in field-evaluation assessment, prediction of performance can be achieved by extended laboratory testing. Very few studies were found in the literature that addresses the performance of liners after construction. Abdolahzadeh et al. (2011) measured the hydraulic permeability and flow rate for cover seepage-control layer enhanced with sand-gravel capillary barrier for a landfill over four years. They observed that the flow rate through these layers decreases with time and found that the settlement can significantly influence the saturated permeability of the seepage control layer.
Haug and Wong, (1992), studied the hydraulic conductivity of sand-bentonite as a function of molding moisture content and found that the hydraulic conductivity decreases with time but they stated molding moisture content is not a significant parameter due to the level of reduction observed.
Chapuis (1990), Chapuis (2011), Chapuis (2017) introduced a prediction method based on laboratory tests for sands containing bentonite of different concentrations. He suggested using empirical equations taking into account bentonite content, porosity, and the degree of saturation of sand. This approach ignored time-dependent changes and the stability of fines within the mixture.
Ross model (Ross, 1990) is among the known approaches to predict the diversion length of cover layers enhanced with capillary effect sub-layers. This model uses flow rate, saturated and relative permeability as well as suction values. The downward flow rate is taken as equal to the seepage flow rate from the cover liner. This reference also indicated that settlement will alter the permeability value.
Leakage or failures in different forms may result from utilizing non-reliable parameter test results or assumptions. Ignoring the environmental impact and weather changes that can take place during the lifespan of a landfill may contribute to unwanted pollution. Leachate collection systems depend on the design concept of infiltration rate during the construction time of the landfill. The lifetime of landfill sites may vary from 30 to 100 years depending on the patterns of waste disposal. Failure in observing regulation can result in a significant environmental risk. Robust systems need to be considered to achieve a high engineering standard that can provide long term and satisfactory performance. For successful pollution control, the environmental risk assessment must be carried out considering adverse environmental impacts and changes that can take place during the life span of the facility.
The problem of measuring field permeability and permeability changes over time in landfill liners was raised by some researchers. Harrop‐Williams (1985) suggested estimating the value based on the dry density and moisture content or the use of statistical ranges and confidence levels.
Purdy and Suryasasmita (2006) discussed comparison testing methods for the field and laboratory and highlighted the need for quick tests that may save considerable time and provides a reliable prediction of the liner performance.
Long term effectiveness is a justified requirement and an issue need to be addressed for all proposed barrier systems. US EPA (1994) introduced guidelines for evaluating the behavior of barriers during extended time performance. The main objective of these guidelines is to assure that the constructed systems will retain their structural integrity over an extended period. The Hydrologic Evaluation of Landfill Performance (HELP) model is a computerized program for landfills developed by the Corps of Engineers for the Environmental Protection Agency (EPA), 1994. This model considers an input parameter ‘failure rate’ to allow for uncertainties in the perdition approach. Among the factors that pose a significant influence are thermal changes, chemical and physical changes in addition to the loss of mass due to water flow. The design life-span of a facility or time before the closure is a significant factor.
Issues of subsidence and desiccation cracking are to be addressed in long term performance. Macro fissures increase the hydraulic conductivity and Darcy’s law may not be applicable (Anderson et al., 1991). Hydraulic conductivity can be reduced by increasing the layer thickness (Benson and Daniel, 1994). The level of reduction shown in this study does not imply that extra thick layers are an economical alternative.
Previous works lack long-term observation studies on the hydraulic conductivity of clay-sand mixtures subjected to flow from standing water or floods. The lifetime of liners can be influenced by environmental exposure and loss of soil mass.
This study aims to investigate the effectiveness of designed liners of sand and expansive materials during their lifetime. The effect of flow and mass variations on the hydraulic permeability of sand-expansive clay liners and sand-bentonite liner were laboratory examined. A series of permeability tests were conducted for long-period on compacted specimens of sand-expansive clay with 15 and 20% clay content and sand with 15% bentonite. The influence of two different vertical stresses; 7 and 30 kPa on the hydraulic conductivity of sand-expansive clay liner with 20% clay content is monitored and compared for over 90 to 100 days period applying a continuous flow. The effect of temperature variations and volume changes on computed hydraulic conductivity was observed.
2 Materials and testing procedures
2.1 General
Local expansive clay intermixed with fine to medium sand was used in this study to compose waste management liner layers. Utilized sand characterized by a coefficient of uniformity, Cu, of 1.713, and a coefficient of concavity, Cc, of 0.945 was used in all mixtures suggested in this research. The sand is classified as SP according to ASTM D2487-017. Expansive clay sampled from the eastern province of Saudi Arabia was found to contain a considerable amount of montmorillonite in the range of 3% to 23% and palygorsite in the range of 5% to 33% (Rafi, 1988). This clay is classified as CH with moderate to high expansion potential (Al-Mahbashi, 2014; Al-Mahbashi et al., 2015). Table 1 presents the geotechnical characterization of this expansive clay and the (OCMA) bentonite used in the study. Table 2 presents the chemical composition of Al-Qatif expansive clay and the (OCMA) bentonite used in the study. The pH and cation exchange capacity of this expansive clay is estimated to be about 7.6 and 55.80 (meq/100 g m) (Al-Mahbashi, 2014; Elkady and Al-Mahbashi, 2017). The bentonite material properties were established for comparison purposes.
| Test | Value |
|---|---|
| Specific Gravity, Gs | 2.70 |
| Liquid Limit, LL (%) | 160% |
| Plastic Limit, PL (%) | 60% |
| Shrinkage Limit, wsh (%) | 12% |
| % passing Sieve No. 200 | 65–95% |
| Unified soil classification | CH |
| Maximum dry unit weight (kN/m3) | 12 kN/m3 |
| Optimum water content (%) | 38% |
| Swelling potential (ASTM D4546) | 16–18% |
| Swelling pressure (ASTM D4546) | 550–600 kN/m2 |
| OCMA Bentonite | |
| Specific Gravity, Gs | 2.65 |
| Liquid Limit, LL (%) | 480% |
| Plastic Limit, PL (%) | 50% |
| Plasticity index, PI (%) | 430% |
| 2.a Al-Qatif Soil | |||||||
|---|---|---|---|---|---|---|---|
| K+ (%) | K2O (%) | Al (%) | Al2O3 (%) | Si (%) | SiO2 (%) | Ca2+ (%) | CaO (%) |
| 1.8 | 2.2 | 3.3 | 6.3 | 8.1 | 17.3 | 0.7 | 0.9 |
| 2.b OCMA grade bentonite | |||||||
|---|---|---|---|---|---|---|---|
| FeO3% | K2O% | Na2O% | Al2O3% | MgO% | SiO2% | TiO2% | CaO% |
| 2.9 | 0.1 | 1.9 | 17.0 | 4.6 | 55.2 | <0.1 | 0.9 |
2.1.1 Grain size distribution for fine material
Al-Qatif expansive clay soil is very rich in fine materials. Around 65–95% of the total mass passes through the sieve number 200 in wet sieving. Hydrometer analysis was conducted to show the grain size distribution for fine particles. Fig. 1 presents the hydrometer analysis conducted following ASTM D7928 (2017). The fine material passing sieve number 200 for the 15% Al-Qatif clay-sand mixture was measured as 11.02% before conducting the permeability tests. This is taken as the average weight when sieving (i.e., by washing) the mixture through sieve number 200 and then oven-dried to obtain the total fines before the permeability test.
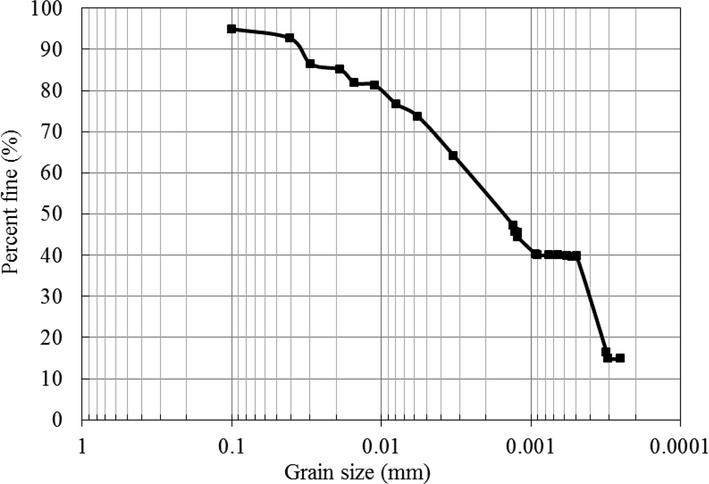
- Hydrometer analysis of Al-Qatif clay.
2.2 Specimen preparation
The sand-clay materials were prepared by mixing dry sand with 15% and 20% clay. The choice of 15% clay was based on previous studies conducted by (Dafalla, 2014) in which 15% clay content was found sufficient to satisfy the requirements of hydraulic conductivity for liner materials (10−7 cm/sec). Moisture density relationship was established using standard compaction tests following ASTM D698 (2000). The maximum dry density (MDD) and optimum water content (OWC) values obtained from the compaction curve for 15% and 20% clay content mixture were 17.76 to 18.30 kN/m3 and 14% to 15.5% respectively. All samples were statically compacted to achieve the relevant MDD.
2.3 Falling head permeability
The sand-clay mixtures were statically compacted to the maximum dry density and optimum moisture content inside a permeability cell of 80 mm diameter and 30 mm height. Wire mesh and porous stones were placed on the top and bottom of the soil specimen. Each specimen was inundated with distilled water to allow for swelling under a slight surcharge load for some time 5 to 7 days. This period was found satisfactory for primary expansion to take place. A surcharge load of 7 or 30 kPa was applied at this stage. The vertical displacement is recorded using LCD transducer connected to a data logger. When the change in vertical displacement is not significant within 24 h the specimen is considered ready for the permeability test. The falling head permeability test method was conducted following ASTM (D5856-02) standard. The flow is considered steady when the average of 4 successive permeability measurements fall within ±25% of the mean value and the ratio of outflow rate to the inflow rate falls within 0.75 to 1.25 compared to the previous measurement. When the steady follow is established and the permeability is attained, a continuous flow was then allowed on the soil specimen through an elevated tank at a surcharge of pressure 7 kPa. The time and the amount of outflow water were recorded and the rate of outflow was calculated. During the discharge or flow, the permeability measurements were conducted 1–3 times per day by closing the flow valve and using a graduated burette connected at the same outflow level of the tank. The records of the outflow rate and permeability were performed continuously for an extended period. The test duration varied from 60 to more than 100 days until no significant variations in the outflow rate and permeability are observed. Fig. 2 presents the setup of the permeability testing unit used.
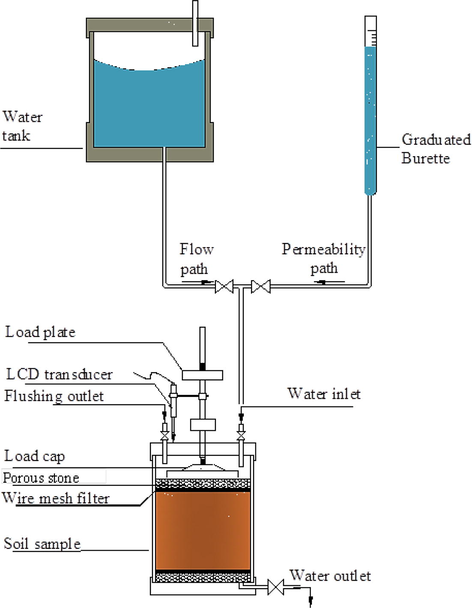
- Schematic diagram of testing setup.
3 Results and discussion
3.1 Behavior of liners with 15 and 20% of expansive clay
The flow rate and cumulative flow were plotted for the 15% and 20% clay content mixtures against time in days. The two mixtures indicated similar trends for the flow rate and the cumulative flow with a notable difference in magnitude as shown in Fig. 3a and b. Significant variations in the flow rates were observed within the first 20 days. The flow rate started to increase in the first period of 5 days and then dropped gradually until a period of 20 days where a low flow rate is achieved. The increases in flow rate for the two mixtures during the first 5 days of continuous water flow were due to the washout of fine clay particles leaving a room or voids. These additional voids cause the permeability to increase. The maximum increase occurs at a cumulative flow of 3200 to 4200 cc for the 15% and 20% clay content mixtures. This indicates that the hydraulic conductivity will increase until 600 mm and 480 mm will pass through the tested section. Converting these figures for a liner of 30 cm thickness 6000 mm to 8400 mm will be required to pass through the layer until the permeability starts to reduce to the initial tested value or below. Reduction in the permeability beyond the peak is caused by the collapse of the porous skeleton and the voids and channels transmitting water are reduced.
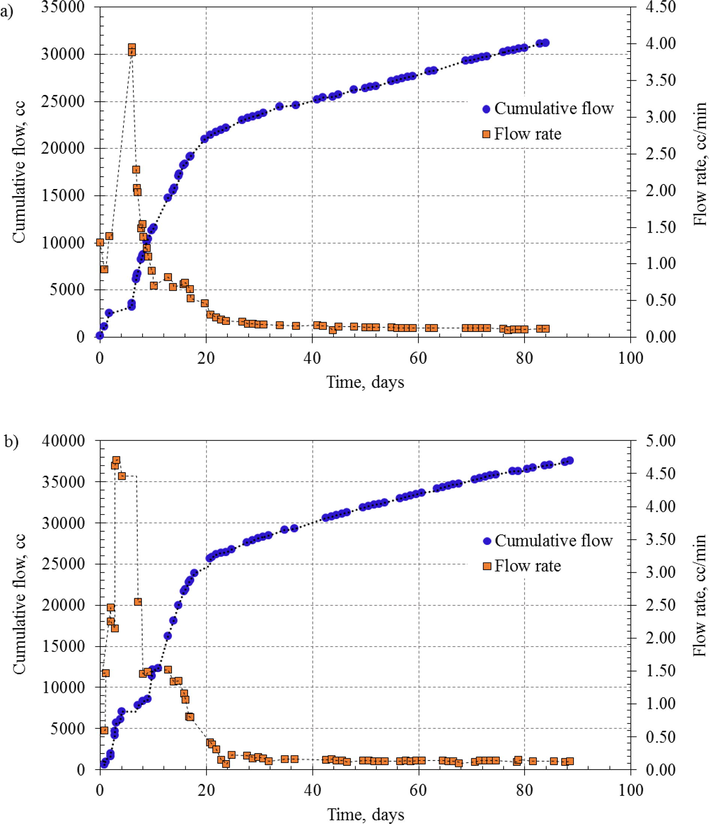
- Flow rate versus cumulative flow a) 15% clay and b) 20% clay.
Computed permeability values reported daily indicated an increasing trend for the first 5 to 10 days and then reducing to lower value through 20 days of continuous flooding. The 20% clay mixture showed higher increase on permeability values for the first days than what is reported for 15% clay mixture. Fig. 4 indicates that the peak of permeability value for the 15% clay occurs after 10 days while the peak of the 20% clay occurred after 5 days. This indicates that rapid loss of permeability occurs for liners rich in clay content. To compare the inundation in the field to that conducted in the laboratory standing water need to be present throughout 5 to 10 days. This can only occur in the case of flooding and low evapotranspiration. Adding up periods of exposure to precipitation during rainy seasons it may be possible to estimate the period during which permeability will be high. The temperature was monitored during measuring the permeability. As seen in Fig. 4 no significant variations in room temperature is observed. The impact of temperature differences of 2 to 3 degrees centigrade is not associated with any change in flow rate or permeability values. The temperature gradient in the field in which variations is in the order of 20 to 40 degrees is expected to have a significant influence.
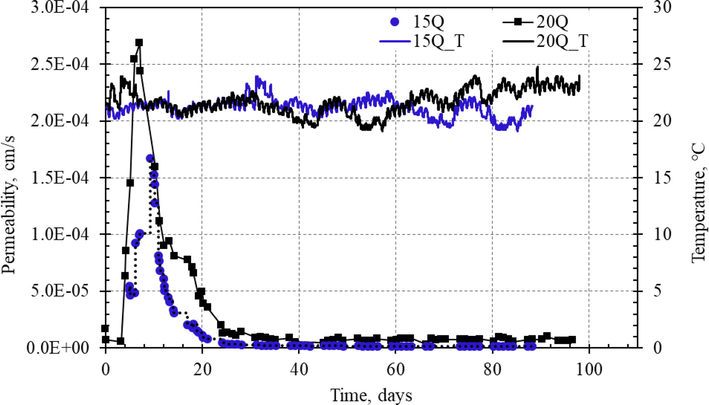
- Measured permeability with temperature.
The bottom layer of waste containment may be flooded over a week to attain the required permeability before allowing wastes to be placed. For cover layers, this phenomenon cannot be avoided except for intercepting the flow below the layer and then directed via sloping ground for disposal.
Fig. 5 presents the measured permeability values for 20% clay mixture less than two different stress; 7 kPa and 30 kPa. It can be seen that the time needed for washing out non-stable fines is reduced and also the time to establish a low permeability is not exceeding three days. Compression or applied stress can reduce permeability value. This is shown in Fig. 6 as strain is increased from 1.28% to 1.365% in 10 days. The reduction in permeability is observed for time beyond 10 days but at a non-significant rate. It seems that primary consolidation continued till 20 days and the secondary consolidation started at a strain of 1.41%.
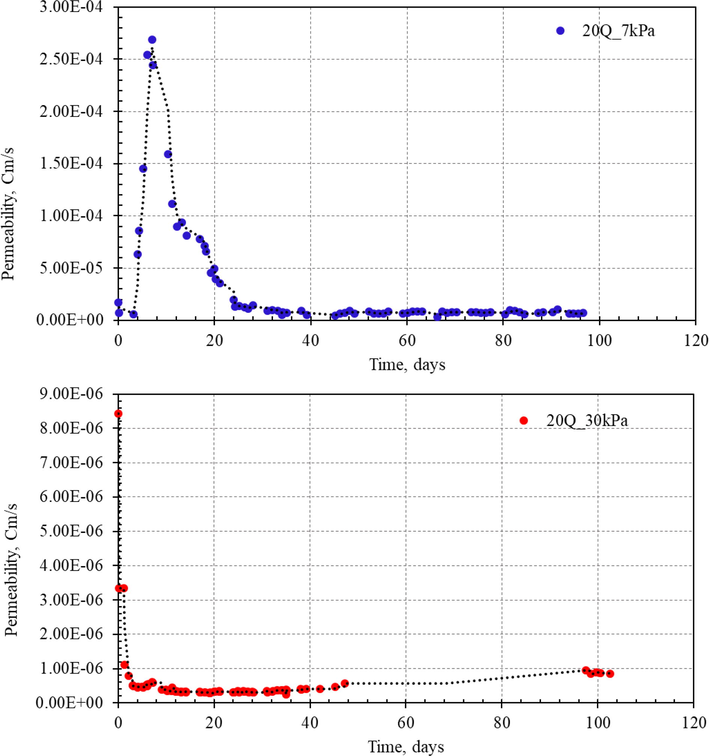
- Permeability under different stresses.
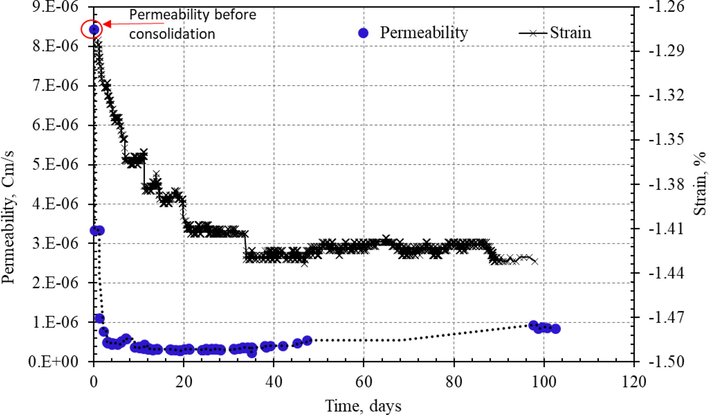
- Permeability and associated strain for Q20 under 30 kPa stress.
Several researchers confirmed that the hydraulic stability of sand bentonite mixture degraded with time when permeated with chemical instead of distilled water (Gipson, 1985; Shackelford, 1994; Gleason et al., 1997).
Works of Dafalla et al. (2015) indicated that the influence of effective stress on the hydraulic conductivity is very significant as pressures cause the voids and flow channels to reduce. Table 3 presents the variations of the permeability as calculated from consolidation tests for stresses ranging from 50 kPa up to 400 kPa. The stress considered for this study is limited to 30 kPa to view the level of wash out under low stresses. This is more relevant to top layers and can also be considered for bottom layers for the initial period of waste disposal.
| Confining Pressure, kPa | 50 | 100 | 200 | 400 |
|---|---|---|---|---|
| Clay content, % | ||||
| 0 | 9.535E−07 | 5.435E−07 | 2.675E−07 | 1.396E−07 |
| 5 | 6.098E−07 | 2.889E−07 | 1.284E−07 | 4.628E−08 |
| 10 | 3.665E−07 | 1.748E−07 | 6.697E−08 | 2.962E−08 |
| 15 | 2.829E−07 | 1.151E−07 | 5.688E−08 | 2.561E−08 |
| 20 | 2.712E−07 | 1.090E−07 | 5.359E−08 | 2.633E−08 |
| 25 | 2.615E−07 | 9.754E−08 | 4.795E−08 | 1.894E−08 |
Reduction in permeability as a result of applied stresses is minor for mixtures with less than 15% Al-Qatif clay content and very noticeable for the 20% clay content and beyond.
3.2 Bentonite behaviour
To assess the wash of fines phenomenon a sand mixture consisting of 15% bentonite is similarly tested for permeability as conducted for Al-Qatif expansive clay. The increase in permeability is reported in 25 days of continuous flow then reduced in further 5 days. The permeability remained low for about 10 days period and then started a second increase until a new peak is formed. This phenomenon is repeated many times with peaks reducing each time for the first 70 days. In Fig. 7 four peaks were observed within the first 70 days. Beyond this period more frequent peaks are formed increasing the permeability by two to three folds. It can be seen in Fig. 7 that the bentonite sand mixture introduced multiple peaks due to the rate at which moisture penetrates the clay. The bentonite is far from saturation within the periods considered in this study.
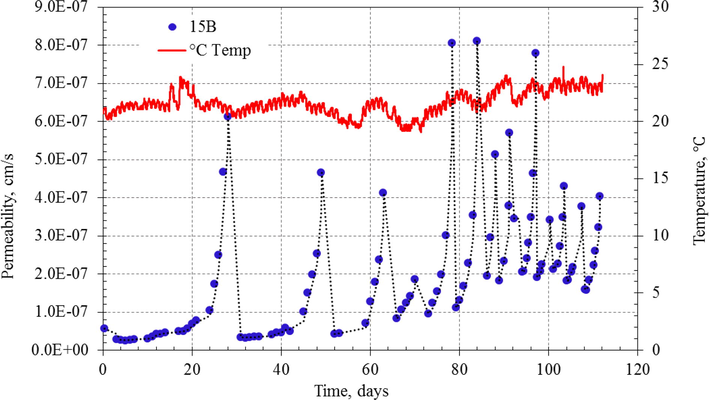
- Measured permeability with temperature for 15B.
3.3 Loss of fines
The fine materials play a significant role in sealing off the pores of the sand used. It is seen here by the authors that the more suspended fines the more the loss of fines. The hydrometer shows more than 55% particles less than 0.002 mm in size. The fines before starting the test were 11.02% gm and when checked out after completing 100 days the fines were found 9.46%.
The continuous flow approach used in this study when compared to environmental exposure and precipitation or other sources of flooding can be simulated to years in the case of rainfall or short periods if flooding or other massive exposures are possible. Computation and simulation of rainfall and flow through the liner is beyond the scope of this study.
The results obtained for Al-Qatif expansive clay-sand mixtures and bentonite confirmed the phenomenon of rising and fall of permeability during the first 10 to 20 days. These findings call for a new measure to be adopted for clay sand liners. This can be done by flooding the liner with standing water for an initial period to eliminate all washable fine clay particles and attain the stabilized mass before leachates are introduced.
4 Summary and conclusion
This study addressed a very important issue concerning the use of clay sand liners in waste containment projects and landfills. The loss of fines during the initial stages of the lifetime of the facility will cause the hydraulic conductivity to drop sharply to unacceptable levels due to washing out of fines. 15% and 20% clay content were investigated and tested over an extended period of more than 90 days to assess the stability of the mixtures and variations of the permeability under a continuous steady flow of water. The results showed a clear increase in the computed permeability values in the first 5 to 10 days and then started to drop to a lower value in 20 days. The 20% clay content mixture sample was subjected to different stress levels of 7 kPa and 30 kPa. It was confirmed that higher stress values contribute to mass stability and reduction in permeability.
The outcome of this study calls for a new measure to be adopted for clay sand liners. This can be done by flooding the liner with standing water for an initial period to eliminate all washable fine clay particles and attain the stabilized mass before leachates are introduced.
Acknowledgements
The authors are grateful to the Deanship of Scientific Research, King Saud University, for funding this research through Vice Deanship of Scientific Research Chairs Program.
Declaration of Competing Interest
The authors declare that they have no known competing financial interests or personal relationships that could have appeared to influence the work reported in this paper.
References
- Assessment of the design of an experimental cover with capillary barrier effect using 4 years of field data. Geotech. Geol. Eng.. 2011;29(5):783-802.
- [Google Scholar]
- Soil water characteristic curves of treated and untreated highly expansive soil subjected to different stresses. M.Sc. thesis, Dept. of Civil Engineering, King Saud Univ. 2014
- [Google Scholar]
- Shear strength prediction for an unsaturated Sand Clay Liner. Int. J. Geotech. Eng. 2019
- [CrossRef] [Google Scholar]
- Soil water characteristic curve and improvement in lime treated expansive soil. Geomech. Eng.. 2015;8(5):687-706.
- [CrossRef] [Google Scholar]
- Alnuaim, A., Dafalla, M. & Al-Mahbashi, A. (2020). Enhancement of Clay–Sand Liners Using Crushed Limestone Powder for Better Fluid Control. Arab J Sci Eng 45, 367–380 (2020). https://doi.org/10.1007/s13369-019-04258-y.
- Factors controlling minimum soil layer thickness. Project Summary EPA/600/S2-91/008. In: Risk Reduction Engineering Laboratory, U.S. Cincinnati, Ohio: Environmental Protection Agency; 1991.
- [Google Scholar]
- ASTM D7928-17, Standard Test Method for Particle-Size Distribution (Gradation) of Fine-Grained Soils Using the Sedimentation (Hydrometer) Analysis, ASTM International, West Conshohocken, PA, 2017, www.astm.org.
- ASTM D2487-17, Standard Practice for Classification of Soils for Engineering Purposes (Unified Soil Classification System), ASTM International, West Conshohocken, PA, 2017, www.astm.org, DOI: 10.1520/D2487-17.
- ASTM D5856 (2002), Standard Test Method for Measurement of Hydraulic Conductivity of Porous Material Using a Rigid-Wall, Compaction-Mold Permeameter, ASTM International, West Conshohocken, PA, 1995, www.astm.org.
- ASTM D698. Standard Test Methods for Laboratory Compaction Characteristics of Soil Using Standard Effort (12 400 ft-lbf/ft3 (600 kNm/ m3)). ASTM International Vol. 4.08 2000 West Conshohocken, PA, USA D-18 Committee on Soils and Rocks.
- Minimum thickness of compacted soil liners: II. Analysis and case histories. J. Geotech. Eng.. 1994;120(1):153-172.
- [Google Scholar]
- Sand–bentonite liners: predicting permeability from laboratory tests. Can. Geotech. J.. 1990;27(1):47-57.
- [Google Scholar]
- Sand–bentonite liners: field control methods. Can. Geotech. J.. 2011;27:216-223.
- [CrossRef] [Google Scholar]
- Chapuis, R., 2017. Compacted Clay: Difficulties Obtaining Good Laboratory Permeability Tests. Geotech. Test. J. 40, no. 2 (2017): 185-198. https://doi.org/10.1520/GTJ20150286.
- Determining the unsaturated hydraulic conductivity of a compacted sand-bentonite mixture under constant-volume and free-swell conditions. Phys. Chem Earth A/B/C. 2008;33(Suppl. 1):462-471.
- [Google Scholar]
- Dafalla, M., Obaid, A., 2018. Assessment of Flow Through Clay-sand Liners using Laboratory Models. KSCE J Civ Eng 22, 1684–1690 (2018). https://doi.org/10.1007/s12205-017-1746-8.
- Effects of confining pressure and effective stress on hydraulic conductivity of sand-clay mixtures. Arab J Geosci. 2015;8(11):9993-10001.
- [CrossRef] [Google Scholar]
- Dafalla, M.A., 2014. “Efficiency of Sand Clay Liners in Controlling Subsurface Water Flow.” Engineering Geology for Society and Territory-Volume 3: River Basins, Reservoir Sedimentation and Water Resources, 497–499.
- Predicting hydraulic conductivity of clay liners. J. Geotech. Eng. Division, ASCE. 1984;110(2):285-300.
- [Google Scholar]
- Effect of solute concentration on the volume change and shear strength of compacted natural expansive clay. Environ. Earth Sci.. 2017;76(14):483.
- [Google Scholar]
- Possible applications of hardening slurries with fly ash from thermal treatment of municipal sewage sludge in environmental protection structures. Arch. Hydro Eng. Environ. Mech.. 2016;63(1):47-61.
- [CrossRef] [Google Scholar]
- Hydraulic Barriers in Soil and Rock. 100 Barr Harbor Drive, PO Box C700, West Conshohocken, PA 19428-2959: ASTM International; 1985. p. :140-140-15.
- [CrossRef]
- Calcuim and sodium bentonite for hydraulic containment applications. J. Geotech. Geoenviron. Eng. ASCE. 1997;123(5):438-445.
- [Google Scholar]
- Clay liner permeability: evaluation and variation. J. Geotech. Eng.. 1985;111(10):1211-1225.
- [Google Scholar]
- Impact of molding water content on hydraulic conductivity of compacted sand-bentonite. Can. Geotech. J.. 1992;29(2):253-262.
- [CrossRef] [Google Scholar]
- Julina, M., Thyagaraj, T., 2020. Combined effects of wet-dry cycles and interacting fluid on desiccation cracks and hydraulic conductivity of compacted clay, Eng. Geol. 267, 2020, 105505, ISSN 0013-7952
- Kenney, T.C., van Veen, W.A., Swallow, M.A., Sungaila, M.A., 1992. Hydraulic conductivity of compacted bentonite-sand mixture. Can. Geotech. J., 29(3): 364–374, https://doi.org/10.1139/t92-042
- Lake, C.B., Rowe, R.K., 2005. The 14-year Performance of a Compacted Clay Liner used as Part of a Composite Liner System for a Leachate Lagoon. Geotech Geol Eng 23, 657–678 (2005). https://doi.org/10.1007/s10706-004-8815-8
- S.E. Obrike C.C. Osadebe S.S. Omoniyi 68 3 2009 417 419.
- Purdy, S., Suryasasmita, V., 2006. Comparison of hydraulic conductivity test methods for landfill clay liners. In Advances in Unsaturated Soil, Seepage, and Environmental Geotechnics (pp. 364-372).
- Rafi, A., 1988. “Engineering Properties and Mineralogical Composition of Expansive Clays in Al-Qatif Area.” (Doctoral dissertation, KFUPM). doi:10.3168/jds.S0022-0302(88)79586-7.
- Diversion capacity of capillary barriers. Water Resour. Res.. 1990;26(10):2625-2629.
- [Google Scholar]
- Determination of hydraulic conductivity of sand-bentonite mixtures for engineering purposes. Geotech. Geol. Eng.. 2002;20(1):65-80.
- [Google Scholar]
- Shackelford, C.D., 1994. ‘Waste-soil interactions that alter hydraulic conductivity.’ Hydraulic conductivity and waste contaminant transport in soil, ASTM STP 1142, D. E. Daniel and S. J. Trautwein, eds., ASTM, West Conshohoken, Pa., 111–168
- US EPA, 1994. Hydrologic Evaluation of Landfill Performance (HELP) Model B (Set Includes, A- User's Guide for Version 3 w/disks, B-Engineering Documentation for Version 3) (PDF). Publication No. EPA/600/R-94/168b, 1994.
- Xu, K., Yang, B., Wang, J., et al., 2020. Improvement of mechanical properties of clay in landfill lines with biochar additive. Arab J Geosci 13, 584 (2020). https://doi.org/10.1007/s12517-020-05622-1


