

Translate this page into:
Impact of green space environment on the prevalence of diabetes mellitus in European countries
⁎Corresponding author. smeo@ksu.edu.sa (Sultan Ayoub Meo)
-
Received: ,
Accepted: ,
This article was originally published by Elsevier and was migrated to Scientific Scholar after the change of Publisher.
Peer review under responsibility of King Saud University.
Abstract
Objectives
The rapid growth in population, urbanization, and industrialization reduces the natural green space environment and increases air pollution on the planet. The green space environment minimizes air pollutants, and swift climate changes and provides fresh and clean air. This study investigates the prevalence of diabetes mellitus in environmentally highly green and less green countries in Europe.
Subjects and methods
Based on the Environmental Performance Index (EPI) score, which rates a country’s environment, 43 European countries with 760 million people were selected. The EPI score was recorded from the USA's Environmental Performance Index (EPI) website. 60% of the EPI score is based on seven categories related to ecosystem vitality: biodiversity and habitat, ecosystem, fisheries, climate change, pollution emissions, agriculture, and water resources. 40% of the score is based on four categories related to environmental health: air quality, sanitation and drinking water, heavy metals, and waste management system. The prevalence of diabetes mellitus in all 43 European countries was obtained from the International Diabetes Federation (IDF). The European countries' populations were obtained from the World Bank. We divided the countries into three groups based on each country's EPI score. The 11 countries with an EPI score of more than 75 were classified as highly green space, 24 countries with an EPI score of 50–75 were classified as moderately green space, and 8 countries with an EPI score of less than 50 were classified as less green space environment countries in Europe.
Results
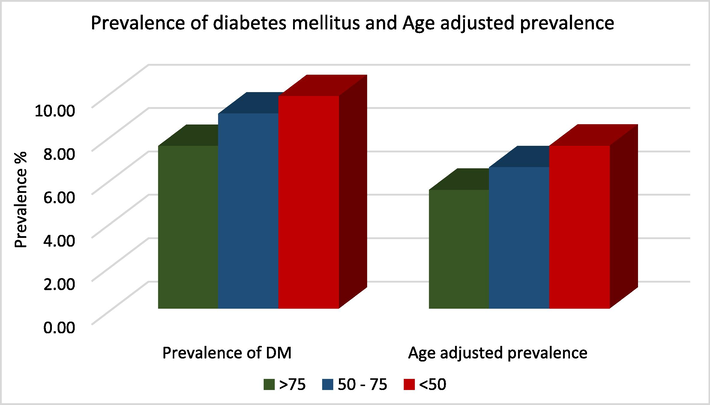
The mean prevalence of diabetes mellitus for highly green space environment countries was 7.49 ± 1.53%; moderately green space countries were 8.98 ± 2.38%, and for less green space environment countries was 9.79 ± 3.05%. In countries with less green space (i.e., environment, EPI scores less than 50), the prevalence of DM was significantly higher than in green space countries with EPI scores of more than 75 (p = 0.041). The results revealed a negative correlation between the green space environment (EPI Score) and the prevalence of diabetes mellitus.
Conclusions
The prevalence of diabetes mellitus is significantly reduced in environmentally high green space countries than in low green space countries in Europe. This means that countries with environmentally sustainable environment policies have less diabetes. It is suggested to establish strategies to keep the living environment green and clean to minimize air pollution and fight against diabetes mellitus.
Keywords
Green space
Environment
Prevalence
Diabetes Mellitus
Europe

1 Introduction
In the 21st century, the global burden of diseases has shifted from communicable to non-communicable diseases. Although, the current COVID-19 pandemic has presented a threatening situation worldwide. Diabetes mellitus is one of the challenging global health issues of the 21st century. For the past two decades, diabetes mellitus (DM) has become a significant health issue that has reached alarming levels during this century. The most recent data demonstrates that in 2021, 537 million people had DM, and this number is estimated to increase to 643 million by 2030. In addition, 541 million people have impaired glucose tolerance. DM caused 6.7 million deaths and 966 billion US dollars in health expenditure in 2021 (IDF Report, 2021).
The concept of etiopathology of DM has markedly changed in recent years. The science community and policymakers now appreciate the environment and its impact on human health. Worldwide, about 4.2 billion people reside in urban regions. The rapid growth in population and urbanization have resulted in an air-polluted environment and minimized healthy and sustainable living environments (World Bank report, 2021). Moreover, the swift industrialization has limited access to nature, a green space environment, and increased exposure to air pollution. The green space environment mitigates air pollution and environmental hazards. It offers disease prevention, provides healthy lifestyles, and improves residents' wellbeing (Urban green spaces report, 2021; Taylor and Hochuli, 2017). Plants, parks, playgrounds, or vegetation in public and private places can provide residents with healthy climate conditions and natural opportunities. However, non-green space areas can cause desert zones, sandstorms, and ecological pollution, resulting in adverse effects on human health (Meo et al., 2021a). The green space environment has been positively associated with health and wellbeing (James et al., 2015). It minimizes exhaustion and stress (Roe et al., 2013), offers space and opportunities for social and physical activities (Richardson et al., 2013) and reduces air and noise pollution, and improves air quality (Maas et al., 2009; Bodicoat et al., 2014). Worldwide, environmental pollution has become a leading cause of communicable diseases and pandemics (Meo et al., 2021b; Wang et al., 2021). The rapid growth in population, urbanization, and industrialization reduces the green space areas and increases environmental pollution on the planet (Meo et al., 2021c). The green space environment, plants, grass, and green vegetation minimize air pollution and provides fresh and clean air. Many countries have developed environmental policies intended to promote a green environment in recent years. This study investigates the prevalence of diabetes mellitus in environmentally highly green, moderately green, and less green countries in Europe.
2 Research methodology
2.1 Selection of highly green and less green space countries:
This cross-sectional study selected 43 European countries based on the “Environmental Performance Index (EPI)” score (Table 1). The EPI ranks the countries on environmental conditions, biological and natural green regions, and ecosystem sustainability (Environmental Performance Index-EPI, 2021). A total of 32 performance indicators were used across 11 defined categories. We selected countries per the United Nations list; however, countries lacking data on green space environments were excluded from the study. The European countries chosen for this study are presented in Table1. EPI: Environmental Performance Index; Prevalence of DM among 20–79 years older people with 95% CI;
Countries
EPI Score
Number of diabetic people per 1,000 s population and 95% CI
Prevalence of DM and 95% CI
Age-adjusted prevalence of DM and 95% CI
Country Name
Highly Green Space Countries
Denmark
82.5
309.4 (287.9–328.2)
7.3 (6.8–7.7)
5.3 (4.9–5.6)
Luxembourg
82.3
34.6 (25.5–43.2)
7.3 (5.3–9.1)
5.9 (4.3–7.4)
Switzerland
81.5
327.6 (262.3–515.1)
6.3 (5.0–9.8)
6.6 (5.6–12.3)
United Kingdom
81.3
3996.3 (3992.0–4000.3)
8.2 (8.2–8.2)
6.3 (6.3–6.3)
France
80.0
3942.9 (2229.6–4428.8)
8.6 (4.8–9.6)
5.3 (3.4–6.6)
Austria
79.6
447.1 (398.9–496.9)
6.6 (5.9–7.3)
4.6 (4.1–5.2)
Finland
78.9
392.9 (334.8–435.9)
9.7 (8.2–10.7
6.1 (5.4–7.0)
Sweden
78.7
496.2 (453.7–538.1)
6.8 (6.2–7.4)
5.0 (4.6–5.4)
Norway
77.7
190.7 (187.9–334.7
4.8 (4.7–8.4)
S
Germany
77.2
6199.9 (5033.4–6847.3)
10.0 (8.1–11.0)
6.9 (5.5–7.7)
Netherlands
75.3
857.0 (800.8–1069.5)
6.8 (6.3–8.5)
4.5 (4.2–5.6)
Moderately Green Space Countries
Spain
74.3
5141.3 (4283.6–5313.4)
14.8 (12.3–15.3)
10.3 (8.7–10.9)
Belgium
73.3
404.9 (394.6–549.7)
4.9 (4.7–6.6)
3.6 (3.5–5.4)
Ireland
72.8
139.1 (123.5–156.3)
4.0 (3.6–4.5)
3.0 (2.6–3.5)
Iceland
72.3
20.1 (14.0–21.7)
8.3 (5.8–9.0)
5.5 (4.5–6.0)
Slovenia
72.0
137.8 (132.3–201.4)
8.9 (8.5–13.0)
5.8 (5.6–9.2)
Italy
71.0
4470.3 (4019.4–5743.5)
9.9 (8.9–12.7)
6.4 (5.7–8.3)
Czech Republic
71.0
791.4 (634.1–1230.2)
9.8 (7.9–15.3)
7.1 (5.5–11.0)
Malta
70.7
37.8 (29.2–46.5)
11.2 (8.7–13.8)
8.0 (6.4–9.6)
Greece
69.1
736.1 (675.3–803.3)
9.6 (8.8–10.5)
6.4 (5.8–7.1)
Slovakia
68.3
349.7 (290.8–429.8)
8.4 (7.0–10.3)
5.8 (5.1–7.7)
Portugal
67.0
994.1 (958.4–1195.8)
13.0 (12.5–15.7)
9.1 (8.6–10.8)
Estonia
65.3
83.9 (63.7–103.2)
8.7 (6.6–10.7)
6.5 (4.8–7.8)
Cyprus
64.8
87.5 (69.8–118.1)
9.7 (7.8–13.1)
8.6 (6.5–11.3)
Romania
64.7
1199.0 (632.5–1670.3)
8.4 (4.4–11.7)
6.5 (3.1–9.2)
Hungary
63.7
661.4 (523.3–865.6)
9.1 (7.2–11.8)
7.0 (5.3–8.8)
Croatia
63.1
212.7 (199.0–396.5)
7.0 (6.5–13.0)
4.8 (4.4–9.2)
Lithuania
62.9
186.9 (145.2–214.1)
9.5 (7.4–10.8)
5.8 (5.0–7.1)
Latvia
61.6
115.8 (105.7–134.9)
8.6 (7.8–10.0)
5.9 (5.2–6.9)
Poland
60.9
2677.0 (2274.8–2948.4)
9.4 (8.0–10.3)
6.8 (6.0–7.6)
Bulgaria
57.0
519.3 (432.8–554.4)
9.9 (8.3–10.6)
7.4 (6.0–8.3)
Serbia
55.2
796.8 (512.7–992.3)
12.2 (7.9–15.2)
9.1 (5.9–11.2)
Armenia
52.3
133.6 (122.1–143.6)
6.4 (5.8–6.9)
5.6 (5.1–6.0)
Belarus
53.0
483.0 (439.4–517.3)
6.9 (6.3–7.4)
5.6 (5.1–6.0)
Russian Federation
50.5
7392.1 (6810.3–7783.1)
7.0 (6.4–7.3)
5.6 (5.1–5.9)
Less Green Space Countries
Ukraine
49.5
2325.0 (2101.7–2492.6
7.1 (6.4–7.6)
5.6 (5.1–6.0)
Albania
49.0
241.1 (150.0–304.0)
11.5 (7.1–14.5)
9.1 (5.9–11.2)
Azerbaijan
46.5
397.1 (367.3–429.1)
5.6 (5.2–6.1)
5.6 (5.1–6.0)
Montenegro
46.3
54.7 (33.0–69.7)
12.0 (7.3–15.3)
9.1 (5.9–11.2)
Bosnia-Herzegovina
45.4
305.9 (204.6–375.2)
12.2 (8.2–15.0)
9.1 (5.9–11.2)
Moldova
44.4
207.3 (188.1–223.1)
6.7 (6.1–7.2)
5.6 (5.1–6.0)
Monaco
42
2.7 (1.4–2.9)
9.3 (5.0–10.0)
6.2 (3.6–7.0
Andorra
39.99
8.0 (7.2–8.8)
13.9 (12.5–15.3)
9.7 (8.8–10.7)
2.2 EPI scoring system of environmentally green space and less green countries
The EPI classified the grading of the individual countries based on the various biological, agricultural, physical, and environmental factors. The majority, 60% of the EPI score is based on ecological vitality and depends on seven categories, including “biodiversity (plants and animals life on the earth, and habitat natural environment), ecosystem, pollution productions, climate change, fisheries, agriculture, and water resources. However, 40% of the score was based on environmental health and depends on four categories: air quality, heavy metals, sanitation, drinking water, and waste management system” (Environmental Performance Index-EPI” 2021).
2.3 Prevalence of diabetes mellitus in European countries
After selecting the countries with data on environmental green space, information on diabetes mellitus prevalence in 43 European countries was obtained from the (International Diabetes Federation (IDF), atlas 2021). A datasheet was established with each country's name, EPI score, and prevalence of DM. The information on the EPI scoring system of environmentally highly green, moderate, and less green space countries and the prevalence of DM was recorded by two investigators, and another investigator rechecked the information.
2.4 Statistical analysis and ethical statement
For this study, the data on the EPI score and prevalence of diabetes mellitus and allied information were obtained from publicly available databases; hence ethical approval was not required.” The data were evaluated using the SPSS software version 22.0 for Microsoft Windows, USA. The “mean values with SD were calculated using a paired sample t-test. The correlation and regression analysis were executed to predict the association and impact of the green space environment, and EPI score with the prevalence of diabetes mellitus. A p-value less than 0.05 was considered statistically significant.
3 Results
The 43 European countries were divided into three groups based on each country's green space environment EPI score. Eleven countries with an EPI score of more than 75 were classified as highly green space countries. Twenty-four countries with an EPI score of 50–75 were classified as moderately green space environment countries, and eight countries with an EPI score of less than 50 were classified as less green space environment countries (Table 1).
The mean prevalence of diabetes mellitus in 11 European countries with highly green space environments and an EPI score of more than 75 was 7.49 ± 1.53%. In the 24 countries with moderately green space countries and EPI scores of 50–75, the mean prevalence of diabetes mellitus was 8.98 ± 2.38%, and in 8 countries with a less green space environment, with EPI scores less than 50, the mean prevalence of diabetes mellitus was 9.79 ± 3.05% (Table 2, Fig. 1).
Variables
EPI Score
N
Mean ± SD
95% Confidence Interval
p-value
Lower
Upper
Prevalence of DM
>75
11
7.49 ± 1.53
6.46
8.52
0.095
50–75
24
8.98 ± 2.38
7.98
9.99
<50
8
9.79 ± 3.05
7.24
12.34
Age adjusted prevalence
>75
11
5.46 ± 1.00
4.79
6.14
0.028
50–75
24
6.51 ± 1.68
5.80
7.22
<50
8
7.50 ± 1.89
5.92
9.08
Effect of the green space environment, EPI Score on the prevalence of diabetes mellitus and age-adjusted prevalence in 43 European countries.
The age-adjusted mean prevalence of diabetes mellitus in highly green space environment countries was 7.49 ± 1.53; moderately green space countries, was 8.98 ± 2.38%, and in less green space environments was 9.79 ± 3.05% (Table 2). There was a significantly lower age-adjusted prevalence of diabetes mellitus in highly green space countries (p = 0.028). The age-adjusted prevalence of diabetes mellitus was the highest in less green space countries than in moderately and highly green space countries (p = 0.028) (Table 2). While analyzing a correlation, the results revealed a negative correlation between the green space environment based on EPI score and prevalence of diabetes mellitus and age-adjusted prevalence. The correlation between EPI score and prevalence of diabetes mellitus was negatively weak. However, the correlation between the EPI score and age-adjusted prevalence of diabetes mellitus was negatively moderate and significant (Table 3).
EPI Score
Prevalence of DM
Age-adjusted prevalence
Pearson Correlation
−0.259
−0.368*
p-value
0.093
0.015
In addition, we also performed a regression analysis to determine the impact of high, moderate, and low green space environments with EPI scores on the prevalence of diabetes mellitus. The results revealed that the prevalence of DM was higher in countries with low EPI scores than in countries with high EPI scores. In countries with EPI score less than 50, the prevalence and age-adjusted prevalence of DM was significantly higher than in countries with EPI scores greater than 75 (p = 0.041; and p = 0.008). Similarly, in countries with EPI scores of 50 to 75, the prevalence of DM was higher than in countries with EPI scores more than 75, but it was not statistically significant (Table 4). The overall results show that the countries with high green space environments and higher EPI scores have a low prevalence of DM (Table 4).
Variables
EPI Score
Β
p-value
95% Confidence Interval
Lower
Upper
Prevalence of DM
>75
Reference
50–75
1.49
0.088
−0.23
3.21
<50
2.30
0.041*
0.10
4.49
Age adjusted prevalence
>75
Reference
50–75
1.04
0.077
−0.12
2.21
<50
2.04
0.008*
0.55
3.52
4 Discussion
The present study findings reveal that a green space environment is beneficially associated with a lower DM prevalence in European countries. This is the first study to explore the association between the green space environment and DM in 43 countries in Europe. The present study’s findings are significant for policymakers to design a suitable green space environment both at regional and global levels. Worldwide, green areas are highly essential for natural biological productivity, environmental eminence, and promoting overall human health (Reynolds et al., 2008). Green spaces have direct health benefits by providing people more opportunities for physical activity, social interaction, psychological restoration, and healthy living (Lee et al., 2015). The living lifestyle plays a significant role in the overall health of human beings. The green space environment, plants, trees, and green vegetation minimize air pollution and disease burden and offer a happy and healthy living environment (Wolch et al., 2014; Chen et al., 2014; Ferrini et al., 2020). De la Fuente et al. (2020) reported that people living in green or near green spaces enjoy reduced risks of type 2 diabetes mellitus (T2DM) (see Fig. 2).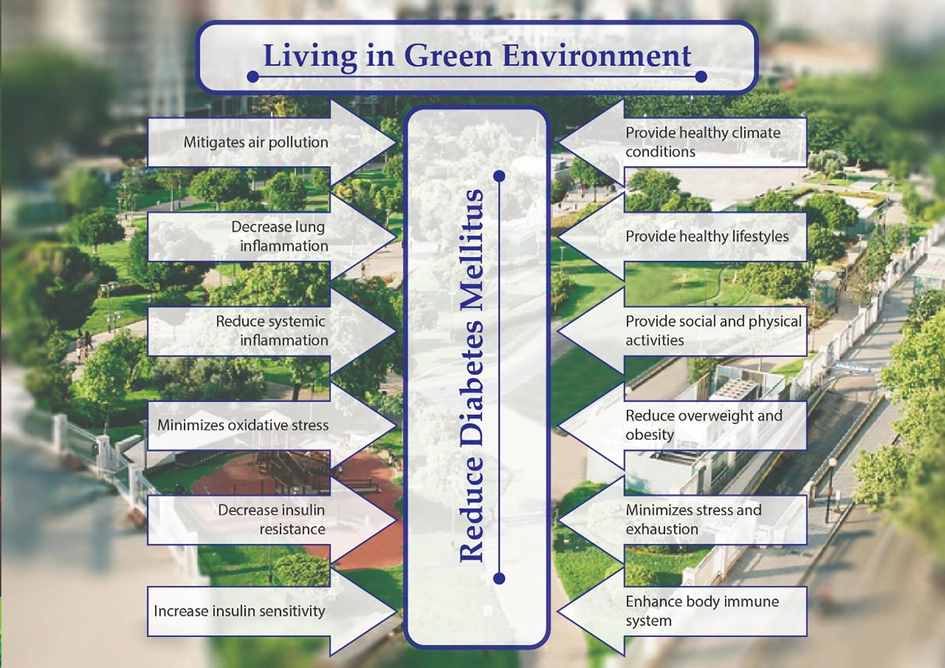
Possible mechanisms of how a green space environment reduces the diabetes mellitus.
Similarly, Ngom et al. (2016) reported a significant relationship between proximity to green spaces and the risk of DM in two metropolitan regions of Canada. The authors found a higher diabetes prevalence rate among the participants with the greatest distance from green space equipped with sports infrastructure than those with the least distance. Compared to the closest population, the most distant people equipped with sports infrastructure had a diabetes risk of 9% than the closest. Another study (Li et al., 2021) demonstrated that proximity to residential green space was associated with lower fasting blood glucose levels and a lower risk of T2DM in a Chinese population. The findings further suggest that green areas have beneficially linked to reducing T2DM.
The studies performed by Lee et al. (2017), Thiering et al. (2016) and Liao et al. (2019) identified a negative association between the people residing in green spaces and fasting blood glucose levels. Higher green space lowers the fasting blood glucose levels. For the first time, we established a relationship between a green space environment and with lower prevalence of DM in European countries. The literature suggested an inverse association, a low type 2 diabetes was among people residing in highly green space areas (Bodicoat et al., 2014; Dalton et al., 2016). Similarly, Yang et al. (2019) and Bodicoat et al. (2014) reported the results consistent with the present study's findings that the people benefited more from the protective effect of greenness than the general population (Yang et al., 2019; Bodicoat et al., 2014).
Few significant interactions were also found between the green space areas and decreased prevalence of DM in Asian studies conducted by Dadvand et al. (2018) and Fan et al. (2019). Dadvand et al. (2018) found an inverse relationship between time spent in natural green spaces and FBG levels. Approximately 1.83 h spent in the greenspace regions were linked with a −0.5 mg/dl change in FBG levels. The authors also observed a reduced risk of impaired fasting glucose (IFG) with time spent in natural green spaces. Similarly, Fan et al. (2019) reported that residing in areas with greenness was associated with decreased risk of DM. Doubleday et al. (2022) reported a 21% decrease in the risk of developing diabetes per interquartile range increase in greenspace. Mazumdar and colleagues (2021) noted that an environment with 30%–40% green space within a walkable distance from home is optimal for reducing the risk of T2D. (Rodriguez-Loureiro et al., 2022) reported a positive perception that neighbourhood green spaces reduces the risk of diabetes-related mortality. The present study result reveals that diabetes mellitus was significantly low in highly green countries compared to less green countries in Europe. The findings support the hypothesis that plants, trees, and vegetation provide a healthy living environment and decrease diabetes mellitus. The results have an important message that nature positively impacts human health.
4.1 Possible mechanisms of how a green space environment reduces the diabetes mellitus
The present study findings are consistent with several potential mechanisms for understanding the impact of the greenspace environment and its association with a lower prevalence of DM. The first mechanism linked to how the green space environment minimizes DM prevalence is that the green space environment significantly reduces air pollution. It is established that less green space environment is the leading cause of environmental pollution. (McDonald et al. 2007) reported an increase in green areas, trees, and plants covering up to a theoretical maximum of 54% of the space in West Midlands, UK, could reduce air pollutants by 26% by removing 200 tons of particulate matter pollutants per annum.
Plant leaves absorb air pollutants and minimize environmental pollution. The study findings of Yang et al. (2005) demonstrated that plants removed about 1241 tons of particulate matter air pollutants per annum in Beijing. Similarly, in Glasgow, Scotland, increasing plant cover from 3.6% to 8% could reduce pollutants by 2% from the entire environment.
Similarly, Nowak et al. (2013) studied removing PM2.5 pollutants from the trees in 10 US cities. The amount of PM2.5 removed annually from trees varies from 4.7 tons in NY to 64.5 tons in Atlanta. The second mechanism relates to the lungs' exposure to environmental pollutants and oxidative stress. The lungs' exposure to air pollutants can cause lung injury because of a mechanism of oxidative stress, macrophage disfunction, and a disrupted epithelial barrier. These factors drive increased lung inflammation and can cause systemic inflammation, insulin resistance, and DM (Meo et al., 2015d; Liu et al., 2019; Wolf et al., 2016; Squillacioti et al., 2022; Fong et al., 2018; Guilbert et al., 2019)). The third mechanism is that a greenspace environment reduces stress and provides fresh air, more relaxation, sports, and physical activities. These pieces of evidence support the premise that the green space environment plays a role in reducing the prevalence of DM. This indicates that nature positively impacts human wellbeing. Plants, grass, and vegetation could capture air pollutants and decrease the amount and prevalence of diabetes mellitus.
5 Study strengths and limitations
This study highlights the impact of the green space environment on diabetes mellitus in European countries. The second strength of this study is that the data is based on 43 European countries with 760 million people, and the findings have a significant contribution to the existing literature. Third, this study enhances knowledge of how the green environment minimizes air pollutants and reduces diabetes mellitus. The limitation of this study is the absence of actual data on the people's lifestyles, and socioeconomic status, that may contribute to diabetes. A second limitation is that there is no general information on exact exposure with greenspace use when linking the proximity of greenspace with a risk of diabetes.
6 Conclusions
The prevalence of diabetes mellitus was significantly decreased in highly green space countries with a high EPI score compared to counties with low green space areas and low EPI scores. The study findings have an important message to policymakers and the public about the health impact of people living in environmentally green space countries and how this living pattern is associated with minimizing the incidence of diabetes mellitus.
Acknowledgements
We thank the “Researchers supporting project number (RSP-2021/47), King Saud University, Riyadh, Saudi Arabia”.
Declaration of Competing Interest
The authors declare that they have no known competing financial interests or personal relationships that could have appeared to influence the work reported in this paper.
References
- The association between neighbourhood green space and type 2 diabetes in a large cross-sectional study. BMJ Open. 2014;4(12):e006076.
- [Google Scholar]
- Effect of urban green patterns on surface urban cool islands and seasonal variations. Urban For. Urban Green.. 2014;13:646-654.
- [Google Scholar]
- Use of green spaces and blood glucose in children; a population-based CASPIAN-V study. Environ. Pollut.. 2018;243:1134-1140.
- [Google Scholar]
- Residential neighbourhood green space is associated with reduced risk of incident diabetes in older people: a prospective cohort study. BMC Public Health.. 2016;16(1):1171.
- [CrossRef] [Google Scholar]
- Green space exposure association with type 2 diabetes mellitus, physical activity, and obesity: A systematic review. Int. J. Environ. Res. Public Health.. 2020;18(1):97.
- [Google Scholar]
- Neighborhood greenspace and risk of type 2 diabetes in a prospective cohort: the Multi-Ethnicity Study of Atherosclerosis. Environ Health.. 2022;21(1):18.
- [CrossRef] [Google Scholar]
- Associations of residential greenness with diabetes mellitus in Chinese Uyghur adults. Int. J. Environ. Res. Public Health.. 2019;16(24):5131.
- [CrossRef] [Google Scholar]
- Role of Vegetation as a Mitigating Factor in the Urban Context. Sustainability. 2020;12:4247.
- [CrossRef] [Google Scholar]
- A review of epidemiologic studies on greenness and health: updated literature through. Curr Envir Health Rpt.. 2018;5:77-87.
- [CrossRef] [Google Scholar]
- Personal exposure to traffic-related air pollutants and relationships with respiratory symptoms and oxidative stress: A pilot cross-sectional study among urban green space workers. Sci. Total Environ.. 2019;649:620-628.
- [CrossRef] [Google Scholar]
- Environmental Performance Index (EPI) data. Available at: https://epi.yale.edu/epi-results/2020/component/epi. Cited date, Dec 12, 2021.
- International Diabetes Federation (IDF). Diabetes Facts and Figures, Atlas, 10 editions. Available at: https://www.idf.org/aboutdiabetes/what-is-diabetes/facts-figures.html. Cited date Jan 12, 2022.
- A review of the health benefits of greenness. Curr. Epidemiol. Rep.. 2015;2(2):131-142.
- [CrossRef] [Google Scholar]
- Association of built environment characteristics with adiposity and glycaemic measures. Obes. Sci. Pract.. 2017;3(3):333-341.
- [Google Scholar]
- Value of urban green spaces in promoting healthy living and wellbeing: prospects for planning. Risk Manag. Healthc. Policy. 2015;8:131-137.
- [CrossRef] [Google Scholar]
- Residential green and blue spaces and type 2 diabetes mellitus: a population-based health study in China. Toxics. 2021;9(1):11.
- [CrossRef] [Google Scholar]
- Effect of residential exposure to green space on maternal blood glucose levels, impaired glucose tolerance, and gestational diabetes mellitus. Environ. Res.. 2019;176:108526
- [Google Scholar]
- Associations between long-term exposure to ambient air pollution and risk of type 2 diabetes mellitus: A systematic review and meta-analysis. Environ. Pollut.. 2019;252:1235-1245.
- [Google Scholar]
- Morbidity is related to a green living environment. J. Epidemiol. Community Health.. 2009;63(12):967-1673.
- [CrossRef] [Google Scholar]
- Which green space metric best predicts a lowered odds of type 2 diabetes? Int. J. Environ. Res. Public Health.. 2021;18:4088.
- [CrossRef] [Google Scholar]
- Quantifying the effect of urban tree planting on concentrations and depositions of PM10 in two UK conurbations. Atmos. Environ.. 2007;41(38):8455-8467.
- [Google Scholar]
- Sandstorm and its effect on particulate matter PM 2.5, carbon monoxide, nitrogen dioxide, ozone pollutants and SARS-CoV-2 cases and deaths. Sci. Total Environ.. 2021;795:148764.
- [Google Scholar]
- Effect of environmental pollutants PM-2.5, carbon monoxide, and ozone on the incidence and mortality of SARS-COV-2 infection in ten wildfire affected counties in California. Sci. Total Environ.. 2021;757:143948.
- [Google Scholar]
- Meo, S.A., Almutairi, F.J., Abukhalaf, A.A., Usmani, A.M. 2021c; Effect of Green Space Environment on Air Pollutants PM2.5, PM10, CO, O3, and Incidence and Mortality of SARS-CoV-2 in Highly Green and Less-Green Countries. Int J Environ Res Public Health. 18(24):13151. doi: 10.3390/ijerph182413151.
- Effect of environmental air pollution on type 2 diabetes mellitus. Eur. Rev. Med. Pharmacol. Sci.. 2015;19(1):123-128.
- [Google Scholar]
- Type and proximity of green spaces are important for preventing cardiovascular morbidity and diabetes–A cross-sectional study for Quebec, Canada. Int. J. Environ. Res. Public Health.. 2016;13(4):423.
- [CrossRef] [Google Scholar]
- Modelled PM2. 5 removals by trees in ten US cities and associated health effects. Environ. Pollut.. 2013;178:395-402.
- [Google Scholar]
- Optimal soil physical quality inferred through structural regression and parameter interactions. Geoderma. 2008;146:466-474.
- [CrossRef] [Google Scholar]
- Role of physical activity in the relationship between urban green space and health. Public Health.. 2013;127(4):318-324.
- [CrossRef] [Google Scholar]
- Long-term exposure to objective and perceived residential greenness and diabetes mortality: A census-based cohort study. Sci. Total Environ.. 2022;27:153445
- [CrossRef] [Google Scholar]
- Green space and stress: evidence from cortisol measures in deprived urban communities. Int. J. Environ. Res. Public Health.. 2013;10(9):4086-4103.
- [CrossRef] [Google Scholar]
- Multisite greenness exposure and oxidative stress in children. The potential mediating role of physical activity. Environ Res.. 2022;209:112857
- [CrossRef] [Google Scholar]
- Taylor, L., Hochuli, D.F. 2017. Defining greenspace: Multiple uses across multiple disciplines. 158, 25-38
- Associations of Residential Long-Term Air Pollution Exposures and Satellite-Derived Greenness with Insulin Resistance in German Adolescents. Environ Health Perspect.. 2016;124(8):1291-1298.
- [Google Scholar]
- Urban green spaces: a brief for action. Available at: https://www.euro.who.int/en/health-topics. Cited date Dec 20, 2021.
- Long-term exposure to ozone and diabetes incidence: A longitudinal cohort study in China. Sci Total Environ.. 2021;151634
- [CrossRef] [Google Scholar]
- Urban green space, public health, and environmental justice: The challenge of making cities just green enough. Landsc. Urban Plan.. 2014;125:234-244.
- [Google Scholar]
- KORA-Study Group. Association between long-term exposure to air pollution and biomarkers related to insulin resistance, subclinical inflammation, and adipokines. Diabetes. 2016;65(11):3314-3326.
- [Google Scholar]
- World Bank: Urban population (% of the total population). Available at: https://data.worldbank.org/indicator/SP.URB.TOTL.IN.ZS. Cited date Dec 22, 2021.
- One-year record of organic and elemental carbon in fine particles in downtown Beijing and Shanghai. Atmos. Chem. Phys.. 2005;2005(5):1449-1457.
- [Google Scholar]
- Associations of greenness with diabetes mellitus and glucose-homeostasis markers: The 33 Communities Chinese Health Study. Int. J. Hyg. Environ. Health. 2019;222(2):283-290.
- [Google Scholar]


