

Translate this page into:
Impact of cropping intensity on soil nitrogen and phosphorus for sustainable agricultural management
⁎Corresponding author. dr.arya999@gmail.com (Vivak M. Arya)
-
Received: ,
Accepted: ,
This article was originally published by Elsevier and was migrated to Scientific Scholar after the change of Publisher.
Abstract
Sustainable agriculture plays a critical role in maintaining environmental health and also promotes long-term food security and the preservation of natural resources. We therefore, examined the response of intensified cropping systems over four years across five diverse cropland ecosystems viz. Basmati rice-Wheat-Cowpea, Basmati Rice-Potato-Wheat-Mixed Fodder (Maize + Cowpea + Charni), Basmati Rice-KnolKhol-Potato-Greengram, Basmati Rice-Radish-Green onion-French bean vegetable-Okra, and Rice-Fenugreek-KnolKhol-Green Onion-Dry Onion-Black gram to assess the changes in substrate availability and fertilizer application on nitrogen and phosphorus pools. Soil samples were collected from three different depths (0–5 cm, 5–15 cm, and 15–30 cm) during the kharif season. Significant results were observed in the mean values of mineralizable nitrogen, total nitrogen, ammonical nitrogen, nitrate nitrogen, and soil microbial biomass nitrogen at the 0–5 cm depth, with the highest values recorded under Rice-Fenugreek-KnolKhol-Green Onion-Dry Onion-Black gram. At the soil depth of 0–5 cm, available phosphorus and labile organic phosphorus exhibited significant differences, with the highest values observed in Basmati Rice-Potato-Wheat-Mixed Fodder. Moderately labile phosphorus reached its maximum values under T2 at both 0–5 cm, and at 5–15 cm depths. The peak values of non-labile organic phosphorus were found in T4 (Basmati Rice-Radish-Green onion-French bean vegetable-Okra) at the 0–5 cm soil depth. On a regional scale, the results suggest that more diversified cropping systems hold promise as sustainable agricultural practices that support nitrogen and phosphorus retention, contributing to overall soil sustainability.
Keywords
Nitrogen
Cropping intensity
Ammonical nitrogen
Phosphorus fractions
Randomized
Labile phosphorus

1 Introduction
The intensification of agriculture and increased cropping intensity are critical for boosting production. Cropping intensity, defined as the number of crops grown annually in a given area (Biradar and Xiao, 2011). It affects nutrient demand, cycling, and distribution in the soil, influencing nutrient needs and dynamics throughout the crop cycle. Intensification alters nutrient availability, including nitrogen and phosphorus that are crucial for growth and development of plants (Grant et al., 2002). Nitrogen is a fundamental component of all proteins and protoplasm and is crucial for soil fertility. Organic nitrogen constitutes 94.2 % of total nitrogen, with the remainder as mineral nitrogen (Nayak et al., 2013). Plants primarily uptake NH4+ and NO3– ions, favouring the latter when the former is abundant. Moreover, the mineralization of the organic nitrogen fraction plays a substantial role in supplying nitrogen to plants. On the other hand, phosphorus in soil primarily exists as the orthophosphate anion, which is less mobile macronutrient. However, it is essential for genetic information and energy transfer in cells. Unfertilized soils have very low phosphorus levels, less than 0.1 parts per million (ppm) phosphorus. Soil phosphorus fractions vary in mobility, bioavailability, and can change under specific conditions (Sharpley and Moyer, 2000). In the current era, our emphasis is on ensuring global food security despite rapidly diminishing cultivated land. The goal is to intensify cropping while maintaining soil health and sustainability. However, excessive intensification may harm soil fertility (Lafond et al., 2011). Incorporating legumes and organic amendments can enhance nutrient availability through plant mediated C input, intensity of cultivation and maintain long-term productivity under a diversified cropping system. Therefore, in present era farmers can move towards intensive cropping but only by practicing diversification of cropping systems. We hypothesized that increasing legume based cropping system diversity would help enhance soil nutrients, biological nitrogen fixation and their impact on long-term agricultural output requirements. To examine this hypothesis, our objective was to identify cropping systems that maximize productivity and resource efficiency while also maintaining high levels of nitrogen pools and organic phosphorus fractions in the soil.
2 Materials and Methods
2.1 Geographical Location
The experiment was conducted in the sub-tropical zone of Jammu and Kashmir at 32°40′ N and 73°64′ E, 293 m above sea level. The region has a hot and dry climate in the summer, shifts to a hot and humid climate during the monsoon season, and transitions to cold weather in the winter. Average annual precipitation is 1115 mm, with 70–75 % falling in June-September and 25–30 % in winter due to Western disturbances (Jan-Mar). The texture of the soil is sandy loam with 71.70 % sand, 16.80 % silt, 11.50 % clay, 7.61pH, 5.54 g kg−1 OC, 290.62 kg ha-1N, 13.45 kg ha-1P, and 133.80 kg ha−1 K. Soil texture was determined by Bouyoucos-hydrometer method.
2.2 Treatment Details
The experiment involved five rice-based sequences of varying cropping intensities (300–600 %) with four replications each. The 20 plots, each 5.40 m by 3.60 m, were arranged in a randomised block design, separated by a 1.0 m strip.
2.3 Crops and their recommended doses (kg/ha) in five different treatments
T1: Control: Rice (Basmati 370)-Wheat (HD-3086)-Cowpea (Lobia Super-60) with N:P:K doses of Rice (30:20:10), Wheat (100:50:25) and Cowpea (17.5:40:0):- Cropping intensity 300 %.
T2: Rice (Basmati- 564)-Potato (KufriPukhraj)-Wheat (Raj-3756)-Mixed Fodder (Maize + Cowpea + Charni) with N:P:K doses of Rice (37.50:25:12.50), Potato (120:60:120 and 50 t ha−1 FYM), Wheat (80:40:25) and Mixed fodder (60:40:20):- Cropping intensity 400 %.
T3: Rice (SJR- 129) – KnolKhol (G-40) – Potato – Green gram with N:P:K doses of rice (60:25:15), Knolkhol (100:50:50 and 30 t ha−1 FYM), Potato (120:60:120 and 50 t ha−1) and Greengram (16:40:0):- Cropping intensity 400 %.
T4: Rice (Pusa- 1121) – Radish (CR-45) – Green onion (Nasik red) – French bean (Anupama) – Okra (Seli special) with N:P:K doses of Rice (50:25:15), Radish (60:30:50 and 30 t ha−1 FYM), Green onion (100:50:50 and 20 t ha−1 FYM), French bean (50:100:50 and 50 t ha−1 FYM) and Okra (100:60:60 and 2.5 t ha−1 FYM):- Cropping intensity 500 % in relay mode from French bean onwards.
T5: Rice (IET- 1410) − Fenugreek (JF-07) − KnolKhol (G-40) − Green onion (Nasik Red) −Dry Onion (Selection-1)-Blackgram (Pant U-19) with N:P:K doses of Rice (50:30:20), Fenugreek (60:20:20 and 15 t ha−1 FYM), Knolkhol (100:50:50 and and 30 t ha−1 FYM), Green onion (50:25:25 and 10 t ha−1 FYM), Dry onion (50:25:25 and 50 t ha−1 FYM) and Blackgram (16:40:0):- 600 % in relay mode from knolkhol onwards.
2.4 Initial properties of the experimental site
Prior to initiating the study, a comprehensive assessment of the site's initial properties was conducted as described in Table 1.
Parameters
Values
Textural Class
Sandy Loam (sand-71.70 %, silt- 16.80 % and clay- 11.50 %)
Electrical Conductivity (ds/m)
0.23
pH
7.61
Mineralizable nitrogen (kg/ha)
281
Available phosphorus (kg/ha)
11.52
Available potassium (kg/ha)
133.80
Total nitrogen (mg/kg)
875.10
Ammonical nitrogen (mg/kg)
36.44
Nitrate nitrogen (mg/kg)
13.91
Soil microbial biomass nitrogen (SMBN) (μg/g)
11.94
Labile organic phosphorus (LOP) (mg/kg)
46.85
Moderately labile organic phosphorus (MLOP) (mg/kg)
147.98
Non-labile organic phosphorus (NLOP) (mg/kg)
29.66
2.5 Collection and analysis of soil samples
Soil samples from varying crop intensities were collected at three depths (0–5, 5–15, 15–30 cm) from central rows of each plot during kharif to study nitrogen pools and organic phosphorus fractions. After removing roots, residues, and stones, samples were air-dried, sieved to 2 mm, and analyzed.
2.6 1. Mineralizable nitrogen
Mineralizable nitrogen was detected/analysed using the alkaline permanganate method (Subbiah and Asija, 1956): The conversion of organic nitrogen into ammonium ions, which can subsequently be quantified, is the basis of the Kjeldahl method. This involves digesting the sample in concentrated sulfuric acid, which releases nitrogen as ammonium sulphate and breaks down organic materials. Sodium hydroxide is then added to make the mixture alkaline, causing the ammonium ions to turn into ammonia gas. The trapped ammonia is added to a flask with boric acid, forming ammonium borate.
2.6.1 Total nitrogen
Total nitrogen was estimated using Kjeldhal's method (Page et al., 1982): The sample is digested with Con. H2SO4 while being exposed to CuSO4 to digest the organic components. Conc. H2SO4 and CuSO4 digest organic components, while K2SO4 and H2O catalyse the digestion. Ammonia content is determined by distilling with NaOH and absorbing the NH3 with HCl. Methyl Red is used to titrate the excess HCl against NaOH. Acid-base titration reduces acid multi-equivalence, which can be used to calculate nitrogen content.
2.6.2 Ammonical nitrogen
Ammonical nitrogen was analyzed in the presence of MgO, soil was shaken with 2 N KCl to obtain extract for ammonia estimation by Kjeldahl steam distillation with an alkaline reagent.
2.6.3 Nitrate nitrogen
The estimation of nitrate was done by distilling the extract following ammonium extraction using a reducing agent (Deverda's alloy).
2.6.4 Soil microbial biomass nitrogen
Soil microbial biomass nitrogen was analysed using the fumigation approach given by Brookes et al., (1985 a): In a 100 ml beaker, two 10 g soil samples were weighed. One was treated with chloroform and vacuumed until it boiled rapidly, then kept in a sealed desiccator for 24 h. The other sample was kept as a non-fumigated control. Both were later extracted with K2SO4.
2.5.6 Available phosphorus: Available phosphorus was analyzed using 0.5 N Sodium bicarbonate (pH 8.5) (Olsen et al., 1954): The method involves utilizing HCO3–, CO33–, and OH– in a pH 8.5, 0.5 M NaHCO3 solution to decrease the levels of soluble Ca2+ through precipitation as CaCO3, and soluble Al3+ and Fe3+ by creating Al and Fe oxyhydroxides, thereby improving solubility of phosphorus.
2.6.5 Organic phosphorus fractions
In general, this fractionation system is based on Bowman and Cole's (1978) procedures, which have been modified by Sharpley and Smith (1985). Organic phosphorus is fractionated into a labile pool, a moderately labile pool, and a non-labile pool in both calcareous and non-calcareous soils.
-
▪
Labile Pool: The labile pool was obtained using 0.5 M NaHCO3 at pH 8.5.
-
▪
Moderately Labile Pool: 1.0 M HCl was used to extract the moderately labile pool, which is then followed by 0.5 M NaOH.
-
▪
Non-Labile Pool: To differentiate the non-labile fraction (humic acid fraction) from the moderately labile fraction (fulvic acid fraction), the NaOH extract was acidified with concentrated HCl. Finally, the extremely resistant, non-labile fraction was obtained by ashing the NaOH extraction residue at 550 °C for 1 h, then dissolving it in 1.0 M H2SO4. The phospho-molybdate method of was used to determine P content in extracts in all cases. When an aliquot is subjected to digestion with 2.5 M H2SO4 and potassium persulfate (K2S2O8), total P in the extracts was determined using Bowman's (1978) technique, as modified by Thien and Myers (1992).
2.7 Statistical analysis: The data was statistically analysed using analysis of variance (ANOVA) based on a randomized block design. The f-test was employed at a probability level of 0.05 to evaluate the significance of the various treatments. For parameters showing significance (P < 0.05), critical differences were calculated to assess the impact of the treatments
3 Results
3.1 Mineralizable nitrogen
The mean value of available nitrogen ranged from 249.26 kg ha−1 to 287.46 kg ha−1 in 0–5 cm depth. The highest values were recorded in T5 while the lowest values were recorded in T1 whereas, T2, T3 and T4 were statistically at par with T5.The available soil nitrogen values declined with increasing depths (Fig. 1a). The mean value of available soil nitrogen was highest (287.46 kg ha−1) in 0–5 cm soil depth and lowest was recorded in 15–30 (195.97 kg ha−1) cm depth. Under high intensity cropping, the available nitrogen content exhibited a significant increase in 0–5 cm depth. Further, no significant difference was observed in other soil depths.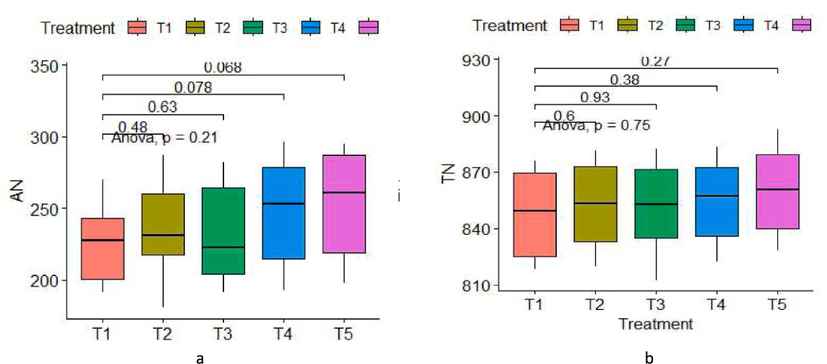
Fig depicting effect of high intensity cropping on (a) Mineralizable Nitrogen and (b) Total Nitrogen (TN) at different depths.
3.2 Total nitrogen
The data shows that the mean value of total nitrogen content ranged from 872.78 mg kg−1 to 884.58 mg kg−1 in 0–5 cm soil depth. The highest values were recorded in T5 while the lowest values were recorded in T1. Also, T4 was statistically at par with T5 at 0–5 cm depth (Fig. 1b). The total soil nitrogen values decreased with increasing depths. The mean value of total soil nitrogen was highest (884.58 mg kg -1) in 0–5 cm depth and lowest values (821.75 mg kg -1) were recorded in 15–30 cm depth (Table 2). Under high intensity cropping, the total nitrogen content exhibited a significant increase in 0–5 cm soil depth. However, no significant difference was observed in 5–15 cm and 15–30 cm soil depth.
Parameters
Initial Values
Final Values
Textural Class
Sandy Loam (sand-71.70 %, silt- 16.80 % and clay- 11.50 %)
Sandy Loam (sand-71.70 %, silt- 16.80 % and clay- 11.50 %)
Electrical Conductivity (ds/m)
0.23
0.43
pH
7.61
8.16
Mineralizable nitrogen (kg/ha)
281
287.46
Available phosphorus (kg/ha)
11.52
15.87
Available potassium (kg/ha)
133.80
136.67
Total nitrogen (mg/kg)
875.10
884.58
Ammonical nitrogen (mg/kg)
36.44
45.58
Nitrate nitrogen (mg/kg)
13.91
29.58
Soil microbial biomass nitrogen (SMBN) (μg/g)
11.94
23.78
Labile organic phosphorus (LOP) (mg/kg)
46.85
54.84
Moderately labile organic phosphorus (MLOP) (mg/kg)
147.98
157.65
Non-labile organic phosphorus (NLOP) (mg/kg)
29.66
37.02
3.3 Nitrate nitrogen
The data presented in Fig. 2a showed that the mean value of nitrate nitrogen ranged between 22.96 mg kg−1 to 29.58 mg kg−1. The highest values were recorded in T5 while the lowest values were recorded in T1 whereas, T2, T3 and T4 remained statistically at par with T5 at 0–5 cm soil depth (Fig. 2a). The similar trend was observed in 5–15 cm and 15–30 cm depths. The nitrate nitrogen values decreased with increasing depths. The mean value of nitrate nitrogen was highest (29.58 mg kg−1) in 0–5 cm depth and lowest values (19.49 mg kg−1) were recorded in 15–30 cm depth. Nitrate nitrogen exhibited a significant increase due to high intensity cropping in 0–5 cm depth.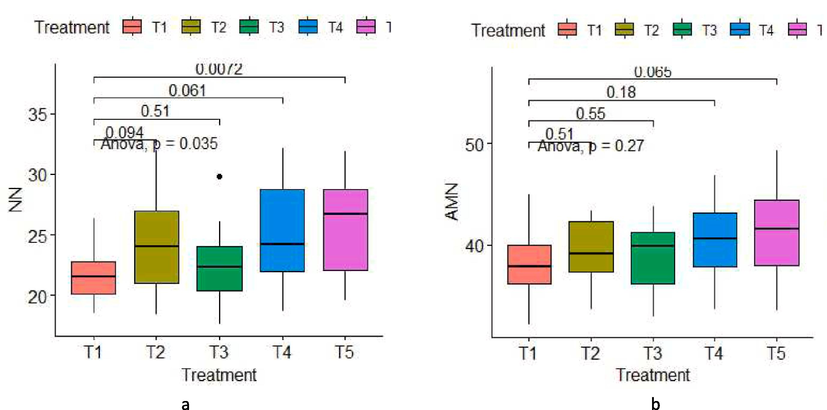
Fig depicting effect of high intensity cropping on (a) Nitrate Nitrogen (NN) and (b) Ammonical Nitrogen (AMN) at different depths.
3.4 Ammonical nitrogen
Ammonical nitrogen content ranged from 41.82 to 45.58 mg kg−1, with the highest values in T5 and the lowest in T1. Ammonical nitrogen declined with depth, with the highest mean value in 0–5 cm depth where T4 was statistically at par with T5 and lowest values were recorded in 15–30 cm depth (Fig. 2b). Ammonical nitrogen increased significantly due to high intensity cropping in 0–5 cm depth, but no significant difference was seen in 5–15 and 15–30 cm soil depths (Table 2).
3.5 Soil microbial biomass nitrogen (SMBN)
A widely recognized biological indicator of alterations in soil management is SMBN, known for its remarkable sensitivity to changes in soil management practices. From the data given in Fig. 3a, it was concluded that the mean value of SMBN ranged between 19.94 μg g−1 to 23.78 μg g−1 in 0–5 cm soil depth. The highest values were recorded in T5 while the lowest values were recorded in T1. T2 and T4 were statistically at par with T5. The similar trend was observed in 5–15 cm and 15–30 cm depth. The results showed that SMBN decreased with increasing depths. The mean value of SMBN was highest (23.78 μg g−1) in 0–5 cm depth and lowest values (16.38 μg g−1) were recorded in 15–30 cm depth. SMBN exhibited a significant increase due to high intensity cropping at 0–5 cm and 5–15 cm soil depth. However, no significant difference was observed in 15–30 cm soil depth.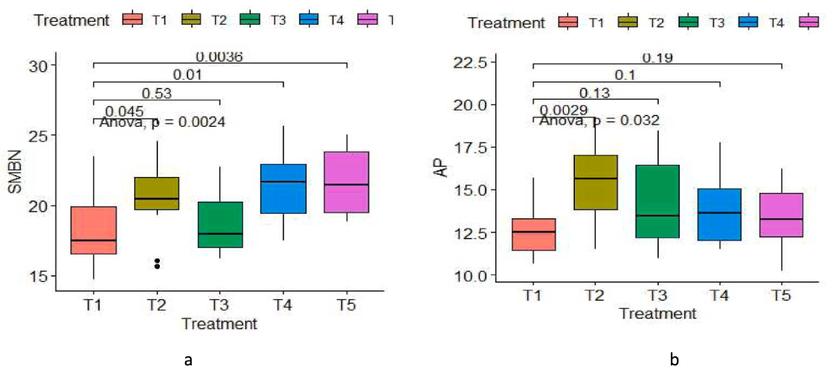
Fig showing effect of high intensity cropping on (a) soil microbial biomass nitrogen (SMBN) and (b) available phosphorus at different depths.
3.6 Available phosphorus
The mean value of available phosphorus ranged between 13.74 kg ha−1 to 15.87 kg ha−1 in 0–5 cm soil depth. The highest values were recorded in T2 (17.31 kg ha−1) while the lowest values (11.50 kg ha−1) were recorded in T1. The results further showed that at 0–5 cm soil depth T3, T4, T5 were statistically at par with T2 (Fig. 3b). The available soil phosphorus values decreased with increasing depths. The mean value of available soil phosphorus was highest (17.31 kg ha−1) in 0–5 cm depth and lowest values were recorded in 15–30 (11.50 kg ha−1) cm depth. The same trend was observed in 5–15 cm and 15–30 cm soil depth i.e T2 has highest values of available phosphorus while T1 exhibited the lowest values. Under high intensity cropping, the available phosphorus content exhibited a significant increase in 0–5 cm soil depth.
3.7 Labile organic phosphorus (LOP)
It was revealed that under 0–5 cm depth the amount of labile organic phosphorus ranged between 50.46 mg kg−1 to 54.84 mg kg−1(Fig. 4a). The highest values were recorded in T2 while the lowest values were recorded in T1. T3, T4 and T5 were statistically at par with T2 at 0–5 cm soil depth. The values of labile organic phosphorus showed a decrease with increasing depths. The mean value of labile organic phosphorus was highest in 0–5 cm depth and lowest values were recorded in 15–30 cm depth. At 5–15 cm and 15–30 cm soil depth, similar trend was noticed i.e T2 had highest values of available phosphorus while T1 exhibited the lowest values. Labile organic phosphorus (LOP) exhibited a significant increase due to high intensity cropping in 0–5 cm depth. However, no significant difference was observed in 5–15 cm and 15–30 cm soil depth.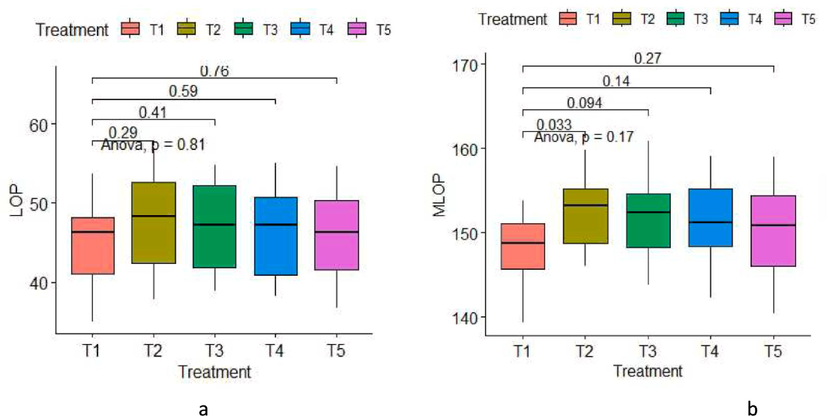
Fig showing effect of high intensity cropping on (a) labile organic phosphorus (LOP) (mg kg−1) and (b) moderately labile organic phosphorus (MLOP) (mg kg−1) fractions of soil at different depths:
3.8 Moderately labile organic phosphorus (MLOP)
The mean values of moderately labile organic phosphorus in soil ranged between 152.11 mg kg−1 to 157.65 mg kg−1 in 0–5 cm soil depth with T2 displaying the highest value followed by T3 (156.86 mg kg -1)and T1 (152.11 mg kg -1)displayed the lowest value as given in Fig. 4b. The treatments, T3, T4 and T5 are statistically at par with T2. The similar trend was observed in 5–15 cm and 15––30 cm soil depths. The highest values were obtained under 0–5 cm soil depth and the lowest values were obtained under 15–30 cm soil depth i.e decreasing trend with increasing depth. The effect of high cropping intensity on moderately labile organic phosphorus was found to be significant at 0–5 cm and 5–15 cm depth. However, the effect was non-significant at 15–30 cm soil depth.
3.9 Non-labile organic phosphorus (NLOP)
The non-labile organic phosphorus content among different treatments, ranged from 32.88 to 37.02 mg kg−1. However, among different treatments, the maximum amount was observed in T4 (37.02 mg kg−1) followed by T5 and lowest value was observed in T1 (32.88 mg kg -1) (Fig. 5). It was also concluded that T3 and T5 were statistically at par with T4. At 5–15 cm and 15–30 cm soil depth, similar trend was observed with T4 exhibiting the highest and T1 exhibiting the least value. The results further revealed that non– labile organic phosphorus in soil decreased with increasing depth. The effect of different treatments on non-labile organic phosphorus were found to be significant in 0–5 cm soil depth and non-significant at 5–15 cm and 15–30 cm soil depth respectively.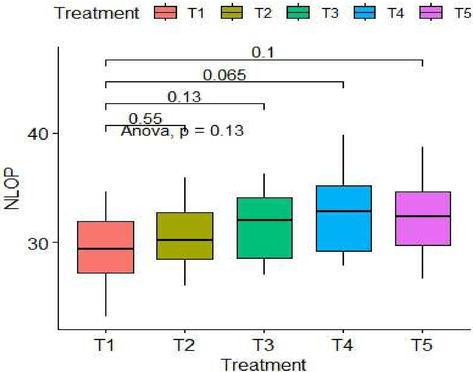
Fig representing the effect of high intensity cropping on non– labile organic phosphorus (NLOP) (mg kg−1) fractions of soil at different depths.
4 Discussions
Cropland ecosystems have a substantial impact on ecosystem functionality, sustainability, and resilience, primarily due to significant alterations in nitrogen pools. The mean values of mineralizable nitrogen were found to be highest in T5 followed by T4 while the lowest values were observed in T1. Due to the consistent addition of organic manure, root biomass C and root exudates than other croplands (Sharma et al.,2009). The introduction of leguminous crops into cropping systems aids in atmospheric nitrogen fixation in the soil, potentially contributing to the elevated levels of mineralizable nitrogen into the soil. Porpavai et al. (2011), also stated that adding legume crops to the cropping system increased the nitrogen content of the soil. Ali et al. (2012) and Naresh et al. (2017) also reported similar results. Furthermore, the findings indicated a decline in mineralizable nitrogen content with increasing depths, possibly attributable to the diminished presence of soil organic carbon at greater depths.
Overall, the rise in total soil nitrogen compared to the initial levels was attributed to the increment in organic matter, root/plant carbon biomass, and enhanced carbon input resulting from high net primary production, predominantly from the root systems (Fu et al., (2019). The same happened in T5 because of incorporation of two legumes which further increased the amount of soil total nitrogen. Continuous fertilizer application, either alone or combined with organic materials, may lead to the elevation of total nitrogen content in the course of time, possibly owing to the escalation of diverse organic and inorganic nitrogen fractions. Santhy et al. (1998), Huang et al. (2021) and Kumar et al. (2022) both documented comparable rises in the amount of total nitrogen levels after the addition of nitrogen from either organic or inorganic sources in various regions of the country.
The mean value of ammonical nitrogen was found to be highest in T5 followed by T4 while the lowest value was obtained in T1 at 0–5 cm soil depth. The comparable pattern was observed at soil depths of 5–15 cm and 15–30 cm. This could be ascribed to the contribution of nitrogen from leguminous plants, residues and N fertilizer which further enhanced NH4+-N concentration through mineralization of soil organic nitrogen. Fu et al. (2019) and Virk et al. (2022) reported that the continuous use of fertilizer and manure over the period of time may be the cause of the rise in NH4+-N in the various treatments. This may be because cultivation accelerates the decomposition of organic matter and the organic-N that has been mineralized and have contributed to ammonical nitrogen pool in the soil. From the data, it was observed that maximum nitrate content was found in T5 while the minimum content was found in T1. This might be due to the increased microbial growth and activity and also due to higher soil organic matter content which further leads to hastening of mineralization and increase NO3 content in T5. The findings are in concurrence with Sainju and Lenssen (2011), Li et al. (2019) and Arunrat et al. (2022).
The maximum content of soil microbial biomass nitrogen was observed in T5 while the minimum values were observed in T1. The minimum values in T1 were attributed because no FYM application and legumes in T1. This may be because crop residues of legumes have been found to promote higher growth and activity of microbes. Chirinda et al. (2008) and Yan et al. (2022) also documented that cropping systems utilizing legumes had greater MBN and nitrification rates than systems that only used inputs from manure and mineral fertilizer. The stronger root development and more plant residues in fertilised plots might have boosted carbon content of the soil, resulting in higher microbial biomass carbon and nitrogen. Muhammad et al. (2021) also discovered higher MBN value in crop rotations with legumes. The values of SMBN decreased with increasing depth. The lowest values were obtained at 15–30 cm soil depth. It was noticed that the effect of cropping intensity was significant at 0–5 cm and 5–15 cm soil depth. The findings are consistent with those of Li et al. (2019), Muhammad et al. (2021) and Potter et al. (2022).
The mean values of available phosphorus ranged from 11.50 to 15.07 kg ha−1 at all the three depths. This might be explained by the fact that crops in cropping systems absorb less phosphorus than the applied amount. The findings suggest that when organic and inorganic fertilizers are applied together, it may not be essential to make large applications of phosphorus fertilizer to enhance the available phosphorus fractions in the soil. To avoid the irreversible adsorption of excess phosphorus, a high organic matter content can mask enough Al and Fe sorption sites, or it can change the surface charge of minerals to reduce the number of adsorption sites and raise the level of phosphorus in the soil solution (Siddique and Robinson, 2003). In order to prevent Fe, Al, Mg, and Ca from reacting with phosphate, hydroxyl acids and organic anions released during the breakdown of organic materials may complex or chelate them (Sharma et al.,2001). Deka and Singh (1984) reported that incorporating potatoes and radish to cropping systems reduced the amount of phosphorus that was easily available because of excessive phosphorus consumption and utilization. Also, the available phosphorus gradually decreased from the surface to the subsurface layer, with higher content observed in the surface layer because mobility of phosphorus was low in soils. Arya et al. (2016), Nunes et al. (2020) and Qaswar et al. (2022) also documented similar findings.
The mean value of labile organic phosphorus was found to be significantly higher in T2 followed by T3 whereas the lowest values were found in T1. The LOP fraction of OM is small but essential to P cycling, sustaining microbial and enzymatic processes (Sharma et al., 2005). NaHCO3-Po levels in T1 might have decreased as a direct consequence of continuous cropping, without external input. Ahmed et al. (2020), Qaswar et al. (2022), Sharma et al. (2022) and Anil et al. (2022) also reported similar results. Moderately labile organic phosphorus was found to be significantly affected by the treatments of different cropping intensities at 0–5 cm and 5–15 cm soil depth. The maximum amount of MLOP was recorded in T2 followed by T3. The moderately labile P pool was thought to consist of the NaOH-Po portions (Halloran et al.,1987). This proportion was greater than the labile P fractions that could be extracted using NaHCO3. Transformation of native soil phosphorus (P) from moderately labile and non-labile fractions to labile forms can occur due to substantial P extraction by plants (Delgado et al., 2002). The results exhibited that the values of non-labile organic phosphorus were found to be significantly influenced by different treatments. The highest values were found in T4 followed by T5. As chemical fertilizers were used more often, the amount of NLOP in the soil rose, suggesting that over prolonged periods of cropping, specific active soil phosphorus fractions were immobilized and more phosphorus underwent chemical fixation in the soil. T4 had the highest fertilizer application and NLOP values. The substantial release of carbon dioxide (CO2) at the time of organic matter decomposition may contribute to the elevation of phosphorus levels, leading to phosphorus fixation in alkaline soils, particularly in calcareous soils. These findings are corroborated by the research of Mao et al. (2015), Ahmed et al. (2020), Hussain et al. (2022) and Sharma et al. (2022).
5 Conclusion
The findings of the current study inferred that the high intensity cropping has significant effect on soil nitrogen pools and phosphorus fractions. Further, the study indicated that intensification of all the cropping systems through leguminous crops is responsible for higher nitrogen fixation and it enhanced the availability of various nitrogen pools with average increase of 2.02 % for mineralizable nitrogen, 1.72 % for total nitrogen, 14.76 % for ammonical nitrogen, 30.07 % for nitrate nitrogen and 41.84 % for soil microbial biomass nitrogen at 0–5 cm soil depth. The combined use of organic manures and fertilizers and their decomposition released organic acids and boost various phosphorus fractions. The continuous use of a variety of inorganic and organic soil amendments along with increased cropping intensity not only enhances the status of nitrogen pools and phosphorus accumulation but also hastens the process of mineralization in soils. In addressing the challenges of population growth and rising food demand in the developing world, a strategic revaluation of agricultural practices is imperative. With a projected surge of 9.8 billion individuals by 2050 and limited agricultural land per capita (0.29 ha), conventional methods fall short. To meet this demand sustainably, we must intensify cropping systems while preserving environmental integrity. Incorporating legumes into crop rotations and balancing organic and inorganic amendments enhances productivity while maintaining soil and ecosystem health. This synergistic approach not only enhance productivity but also fosters the overall health and resilience of soil and ecosystems. Therefore, farmers are advised to apply optimum P-fertilization adhering to the requirements of the crop to enhance the availability of organic phosphorus fractions under the high cropping intensities of the Chenab-Ravi basin.
CRediT authorship contribution statement
Tamanna Sharma: Data curation, Formal analysis, Methodology, Writing – original draft. Vivak M. Arya: . Vikas Sharma: Conceptualization, Project administration, Supervision, Visualization, Writing – review & editing. Sandeep Sharma: Data curation, Methodology, Software, Writing – review & editing. Simona M. Popescu: Formal analysis, Investigation, Validation, Visualization, Writing – review & editing. Nikhil Thakur: Data curation, Methodology, Visualization, Writing – review & editing. Jeelani M. Iqbal: Formal analysis, Software, Validation, Visualization. Mohamed A. El-Sheikh: Formal analysis, Validation, Visualization, Writing – review & editing. Gurjinder S. Baath: Formal analysis, Investigation, Software, Validation, Visualization.
Acknowledgments
We are grateful to the authorities of Sher e Kashmir University of Agricultural Sciences and Technology, Jammu, India for all support in the execution of this experiment. We acknowledge the technical support from the Division of soil science (SKUAST-Jammu), PAU Ludhiana and Texas Agri Life (Texas A&M University), USA. The authors would like to extend their sincere appreciation to the Researchers Supporting Project Number (RSP2024R182) King Saud University, Riyadh, Saudi Arabia.
Declaration of competing interest
The authors declare that they have no known competing financial interests or personal relationships that could have appeared to influence the work reported in this paper.
References
- Tillage practices improve rice yield and soil phosphorus fractions in two typical paddy soils. J. Soil. Sediment.. 2020;20:850-861.
- [CrossRef] [Google Scholar]
- Diversification of rice-based cropping systems to improve soil fertility, sustainable productivity and economics. Journal of Animal and Plant Sciences.. 2012;22:108-112.
- [Google Scholar]
- Impact of Long-Term Conservation Agriculture Practices on Phosphorus Dynamics under Maize-Based Cropping Systems in a Sub-Tropical Soil. Land.. 2022;11:1488.
- [CrossRef] [Google Scholar]
- Effects of fire on soil organic carbon, soil total nitrogen, and soil properties under rotational shifting cultivation in northern Thailand. J. Environ. Manage.. 2022;302:113978
- [CrossRef] [Google Scholar]
- Phosphorus adsorption and desorption in agro-climatically disparate soils representing foothills of northwest Himalayas. Indian Journal of Ecology.. 2016;43:697-705.
- [Google Scholar]
- Quantifying the area and spatial distribution of double-and triple-cropping croplands in India with multi-temporal MODIS imagery in 2005. Int. J. Remote Sens.. 2011;32:367-386.
- [Google Scholar]
- An exploratory method for fractionation of organic phosphorus from grassland soils. Soil Sci.. 1978;125:95-101.
- [Google Scholar]
- Chloroform fumigation and release of soil N: The effects of fumigation time and temperature. Soil Biology Biochemistry.. 1985;17:831-835.
- [Google Scholar]
- Chirinda, N., J.E. Olesen, J.R. Porter., 2008. Effect of organic matter input on soil microbial properties and crop yields in conventional and organic cropping systems. In: Proceedings of 16th IFOAM Organic World Congress, Modena, Italy, 2008; pp.56-59.
- Studies of rice based multiple crop sequences. II. Effect of crop rotations on fertility status of soil. Indian J. Agron.. 1984;29:441-447.
- [CrossRef] [Google Scholar]
- Phosphorus fertilizer recovery from calcareous soils amended with humic and fulvic acids. Plant and Soil. 2002;245:277-286.
- [CrossRef] [Google Scholar]
- Soil nitrogen fractions under long-term crop rotations in the Loess Plateau of China. Soil Tillage Res.. 2019;186:42-51.
- [CrossRef] [Google Scholar]
- Nutrient considerations for diversified cropping systems in the northern Great Plains. Agron. J.. 2002;94:186-198.
- [CrossRef] [Google Scholar]
- O Halloran, I.P.; Stewart, J.W.B. and Kachanoski, R.G. Influence of texture and management practices on the forms and distribution of soil phosphorus. Canadian Journal of Soil Science. 1987, 67, 147-163. Doi: 10.4141/cjss87-013.
- Soil organic carbon, total nitrogen, available nutrients, and yield under different straw returning methods. Soil Tillage Res.. 2021;214:105171
- [CrossRef] [Google Scholar]
- Changes in Soil-Phosphorus Fractions by Nitrogen and Phosphorus Fertilization in Korean Pine Plantation and Its Natural Forest. Forests. 2022;13:527.
- [CrossRef] [Google Scholar]
- Nitrogen dynamics in soil, nutrient uptake and nitrogen use efficiency of maize under different nitrification inhibitors and varying nitrogen doses. The Pharma Innovation Journal.. 2022;11:1784-1787.
- [Google Scholar]
- Long term impact of no-till on soil properties and crop productivity on the Canadian prairies. Soil Tillage Res.. 2011;117:110-123.
- [CrossRef] [Google Scholar]
- Short-term response of soil microbial community to field conversion from dryland to paddy under the land consolidation process in North China. Agriculture. 2019;9:216.
- [CrossRef] [Google Scholar]
- Effect of 17 years of organic and inorganic fertilizer applications on soil phosphorus dynamics in a rice–wheat rotation cropping system in eastern China. J. Soil. Sediment.. 2015;15:1889-1899.
- [CrossRef] [Google Scholar]
- Impact of the mixture verses solo residue management and climatic conditions on soil microbial biomass carbon to nitrogen ratio: a systematic review. Environ. Sci. Pollut. Res.. 2021;28:64241-64252.
- [CrossRef] [Google Scholar]
- Bed planting system promotes crop diversification for improving livelihoods in western Uttar Pradesh, India. International Journal of Current Microbiology and Applied SciEnce.. 2017;6:1580-1590.
- [Google Scholar]
- Different N fractions and their relationship with available Nitrogen, yield and nutrient uptake in safflower, (Carthanmustinctoroius) in vertisol. Current Advances in Agriculture Science.. 2013;5:135-137.
- [Google Scholar]
- Distribution of soil phosphorus fractions as a function of long-term soil tillage and phosphate fertilization management. Front. Earth Sci.. 2020;8:350.
- [CrossRef] [Google Scholar]
- Method of soil analysis, part 2, chemical and microbiological properties. Agronomy monograph No.9.American Society Agronomy Lnc, Madison, Wisconsin USA physical Nature of erosion losses. Journal of American Society of Agronomy.. 1982;28:337-351.
- [Google Scholar]
- Impact of various rice based cropping systems on soil fertility. Journal of Cereals and Oilseeds.. 2011;2:43-46.
- [Google Scholar]
- Long-term management drives divergence in soil microbial biomass, richness, and composition among upper Midwest, USA cropping systems. Agr Ecosyst Environ. 2022;325:107718
- [CrossRef] [Google Scholar]
- Qaswar, M.; Ahmed, W.; Huang, J.; Liu, K.L.; Zhang, L.; Han, T.F.; DU, J.X.; Sehrish, A.L.I.; Hafeez, U.R.; Huang, Q.H. and Zhang, H.M. Interaction of soil microbial communities and phosphorus fractions under long-term fertilization in paddy soil. Journal of Integrative Agriculture. 2022, 21, 2134-2144. Doi: 10.1016/S2095-3119(21)63733-4.
- Soil nitrogen dynamics under dryland alfalfa and durum–forage cropping sequences. Soil Sci. Soc. Am. J.. 2011;75:669-677.
- [CrossRef] [Google Scholar]
- Long-term fertilizer experiments. Status of N, P and K fractions in soil. J. Indian Soc. Soil Sci. 1998;46:395-398.
- [Google Scholar]
- Soil fertility and productivity of rice (Oryzasativa)-wheat (Triticumaestivum) cropping system in an Inceptisol as influenced by integrated nutrient management. The Indian Journal of Agricultural Sciences.. 2001;71:376-385.
- [Google Scholar]
- Sharma SP, Singh MV, Subehia SK, Jain PK, Kaushal V and Verma TS. Long term effect of fertilizer, manure and lime application on the changes in soil quality, crop productivity and sustainability of maize-wheat system in alfisol of North Himalaya. Research Bulletin No.2. AICRP on Long-term Fertilizer Experiments, IISS, Bhopal (M.P) and Department of Soils, CSK HPKV, Palampur, H.P.2005, pp 1-88.
- Tillage, green manure and residue retention improves aggregate-associated phosphorus fractions under rice–wheat cropping. Sci. Rep.. 2022;12:7167.
- [CrossRef] [Google Scholar]
- Assessment of fertility status of erosion prone soils of Jammu Shiwaliks. J. Soil Water Conserv.. 2009;8:37-41.
- [Google Scholar]
- Phosphorus forms in manure and compost and their release during simulated rainfall. J. Environ. Qual.. 2000;29:1462-1469.
- [CrossRef] [Google Scholar]
- Fractionation of inorganic and organic phosphorus in virgin and cultivated soils. Soil Sci. Soc. Am. J.. 1985;49:127-130.
- [CrossRef] [Google Scholar]
- Phosphorus sorption and availability in soils amended with animal manures and sewage sludge. J. Environ. Qual.. 2003;32:1114-1121.
- [CrossRef] [Google Scholar]
- Determination of bioavailable phosphorus in soil. Soil Sci. Soc. Am. J.. 1992;56:814-818.
- [CrossRef] [Google Scholar]
- Simultaneous effects of legume cultivation on carbon and nitrogen accumulation in soil. Adv. Agron.. 2022;171:75-110.
- [CrossRef] [Google Scholar]
- Diversified cropping systems benefit soil carbon and nitrogen stocks by increasing aggregate stability: Results of three fractionation methods. Sci. Total Environ.. 2022;824:153878
- [CrossRef] [Google Scholar]
Appendix A
Supplementary material
Supplementary data to this article can be found online at https://doi.org/10.1016/j.jksus.2024.103244.
Appendix A
Supplementary material
The following are the Supplementary data to this article:


