

Translate this page into:
Impact of caffeic acid phenylester on nitric oxide synthase and arginase in rats intoxicated with nitrites
⁎Corresponding author at: Biochemistry Department, Faculty of Science, King Abdulaziz University, Jeddah, Saudi Arabia. emali@kau.edu.sa (Ehab Mostafa Mohamed Ali), ehab.ali@science.tanta.edu.eg (Ehab Mostafa Mohamed Ali),
-
Received: ,
Accepted: ,
This article was originally published by Elsevier and was migrated to Scientific Scholar after the change of Publisher.
Peer review under responsibility of King Saud University.
Abstract
This study investigated the impact of the caffeic acid phenyl ester (CAPE) on the enzymes detoxifying nitrites induced liver injury in rats. Male albino rats were given CAPE 3 mg CAPE/kg b.wt (i.p.) for last 4 weeks during 2 g/L NaNO2 drinking nitrites for 8 weeks to evaluate the protective effect of CAPE. Another group was treated with the same dose of CAPE i.p for 4 weeks after administration NaNO2 for 4 weeks. Data obtained showed that rats administrated nitrite showed a significant elevation of serum and liver NO and as compared with control. Serum and liver NO levels alleviated to the normal level in rats treated with CAPE. CAPE administration as protected or treated caused a reduction in liver MDA while liver GSH, catalase, and GST were significantly increased as compared with rats drinking nitrites Rats treated with CAPE showed an enhancement in arginase activity as a mechanism to overcome the nitrite toxicity in the liver. In addition, histological observation revealed normal hepatocytes with reduced infiltration of neutrophil in rats treated with CAPE. Conclusion: The CAPE treated rats ameliorated the toxicity of nitrites by inhibiting oxidative stress and modulation of enzymes detoxifying nitrites.
Keywords
Toxicity
Nitrites
CAPE
NOS
Arginase
Antioxidant

1 Introduction
Nitrates are a vasodilator, bronchial dilator, and an intestinal relaxant, it improves the blood flow, and it is used as the therapeutic agent for angina and coronary heart disease. Sodium nitrite is used in industrial applications such as the manufacture of dyes and rubbers (Carnovale et al., 2000). Nitrites are used as preservatives of meat products and human industrial food. Sodium nitrites inhibit the growth of pathogenic microorganism that changes the color and taste of food. It inhibits lipid peroxidation that forms rancidity (Sindelar and Milkowski, 2012). Carcinogenic nitrosamines are formed when the functional amino group in protein reacts with nitrites found in preservative food (Najm and Trussell, 2001).
Nitrites are toxic for vital organs that causing nephrotoxicity hepatotoxicity and carcinogenesis. It impairs of the reproductive system, retards growth, and disturb of the endocrine glands and form methemoglobinemia cells (Wilson, 2003). In rats receive the high dose of nitrites, it may form the damage of liver cells which may be due to the effect of nitric oxide (NO) that formed from nitrites. The nitrite found in animal tissue is due to the metabolism of nitric oxide. Nitric oxide can be synthesized from arginine catalyzed by nitric oxide synthase (NOS) (Southan and Srinivasan, 1998).
Caffeic acid phenyl ester (CAPE) is synthesized by esterification of caffeic acid (CA) and extracted from honeybee propolis. Its structure is similar to flavonoids. It has antioxidant, antitumor activities anti-inflammatory, and immunomodulatory properties (Chung et al., 2004, Iraz et al., 2005). CAPE inhibits glutathione S-transferase (GST), xanthine oxidase, lipoxygenases, and cyclooxygenase activities (Chung et al., 2004; Koksel et al., 2006).
Caffeic acid phenyl ester may ameliorate the abnormalities of liver resulted from sodium nitrite due to the antioxidant properties of CAPE. The goal of the current study was to evaluate the effect of CAPE on NOS; arginase and GST as detoxified enzymes and oxidative stress in rats intoxicated with sodium nitrite.
2 Materials and methods
2.1 Experimental rats
Fifty male albino rats; weighing 130–150 g, were used in this study. Rats were maintained on a normal diet ad libitum and under standard animal house conditions under 20–22 °C. Handling of animals was consistent with the guidelines of the Ethical committee of King Fahd Medical Central Research, King Abdulaziz University, Jeddah. CAPE was purchased from Sigma Chemical Co. (St Louis, MO, USA) and dissolved in 20% dimethyl sulfoxide.
Rats were categorized equally into 5 groups (Table 1). Group I (Control group): Rats were untreated. Group II (CAPE group): Rats were injected with 3 mg CAPE/kg b.wt), intraperitoneally (i.p.) thrice a week for last 4 weeks (Yilmaz et al., 2004). Group III (NaNO2 group): Rats was administrated nitrites in the drinking-water at concentration 2 g/L for 8 weeks (Til et al., 1988). Group IV (NaNO2 and CAPE protected group): Rats was received nitrites in the drinking-water at concentrations 2 g/L for 8 weeks and injected with CAPE (i.p.) for 3 days/week for last 4 weeks. Group V (NaNO2 and treated CAPE): Rats was drunk 2 g/L nitrites for 4 weeks and then nitrites were replaced with drinking-water. After that; rats was treated with CAPE (i.p) thrice a week for last 4 weeks of the experiment.
Group Number
Time (weeks)
2
4
6
8
Group I


Group II


Group III


Group IV


Group V


After 8 weeks; the rats were sacrificed under anesthesia after being fasted for 12 h. Blood samples were collected; divided into two parts. One part was collected into EDTA tube to measure hemoglobin level by using kits (Diamond Diagnostics Egypt). The second part of blood was centrifuged and the serum was used for determination of ALT, AST activities; and urea level by using kits (Randox Labs, UK). The liver was removed, washed with cold normal saline and weighed. Part of the liver samples was grinding in a homogenization (10%) containing PBS, pH, 7.5 and inhibitor for proteases and centrifuged at 10,000g for 10 min at 4 °C. The supernatant was stored at −20 °C until used for biochemical assays. The second portion of liver tissues was fixed in 10% formalin and stained with hematoxylin and eosin for histopathological examinations (Alturkistani et al., 2015).
2.2 Biochemical analysis
The protein concentration in the liver was measured by using the Lowry method (Lowry et al., 1951). Liver malondialdehyde (MDA) level was determined by reacting with thiobarbituric acid (TBA) and absorbance read at 532 nm. The concentration of MDA was calculated by molar absorptivity of MDA-TBA complex (1.56x10⁵ M−1 cm−1) and is expressed as nmol/g tissue (Draper and Hadley, 1990).
Liver glutathione level was measured by the Ellman method (Ellman, 1959). 5, 5′-dithiobis-2-nitrobenzoic acid (DTNP) was reacted with GSH. The absorbance is measured at 412 nm. The GSH standard curve (0.25–5 mM) was plotted. GSH level was expressed as nmol/g tissue.
Glutathione peroxidase (Gpx) in liver was determined after reacting with GSH and H2O2; the amount of GSH in the reaction mixture was decreased. 100 µL liver homogenate, 100 µL 8 mM GSH, 100 µL 9 mM EDTA, 100 µL 30 mM sodium azide, 0.2 ml 18 mM H2O2 and 0.6 ml H2O were incubated at 37 °C for 10 min. After adding precipitated reagent, the decreasing GSH was determined by the Ellman method. The unite of Gpx was nmole/min/mg protein (Gross et al., 1967).
Liver glutathione-S transferase (GST) activity was determined according to Habig et al. (1974). 100 µL of 10 mM 1-chloro-2,4-dinitrobenzene (CDNB) and 0.5 ml of 2 mM of glutathione were used as the substrate and the reaction was completed to 1 ml by 0.5 M of sodium phosphate buffer pH 7.2. 50 µL of diluted enzyme extract was finally added and incubated at 37 °C with shaking and initial velocity of product formed was determined at 340 nm. One unit of the enzyme was defined as 1 nmol/CDNB-GSH formed per minute/mg protein.
Liver catalase was determined by the rate for H2O2 decomposition at 240 nm. One unit of catalase enzyme was expressed by mmol/min/mg (Bergmeyer 1974).
Nitric oxide level as nitrites and nitrates was determined in serum and the supernatant of liver homogenate as described previously (Vodovotz 1996). Briefly; 200 μL serum or 10% of liver homogenate was deproteinized with 10 μL of 30% zinc sulfate. 0.5 g granulated cadmium shavings were added to 0.1 ml of the non-protein containing supernatant to reduce NO3– to NO2–. Then 0.4 ml distilled water was added. After rotating overnight and centrifugation, 0.25 ml of the final supernatant was completed to 0.5 ml distilled water then assayed by 0.5 ml of Griess reagent reacted with NO2 producing pink color that measured at 540 nm. The standard curve ranging (5–100 μM of nitrites) was constructed.
Nitric oxide synthase activity was assayed by modified methods (Abdelkawy and Salem, 2015; Ghigo et al., 2006). A reaction mixture contains 50 μL of 3.4 mM of arginine, 0.6 ml of 0.1 M Tris-HCl buffer, 50 μL of 20 mM CaCl2, pH 7.5, 50 μL of 40 mM of dithiothreitol, 50 μL of 2 mM of tetrahydrobiopterin, 50 μL of 12 mM of NADPH+, 50 μL of 0.5 mM of FAD and 50 μL of enzyme sample. The total volume of reaction 1 ml incubated at 37 °C for 3 h. Total nitrites were measured as described above (Vodovotz, 1996). One unit of NOS was defined as 1 nmol NO formed per h/mg protein.
Arginase activity was assayed according to Campbell (1961). Briefly, the assay reaction mixture contained 0.7 ml of 100 mM of sodium bicarbonate buffer, pH 9.5, 100 µL of 200 mM arginine, 100 µL of 0.5 mM MnCl2 and 100 µL of diluted sample. The 1 ml of this reaction was incubated at 37 °C for 1 hr. The reaction was stopped with 1 ml of 0.5 M perchloric acid. After centrifugation, urea was determined of the deproteinized reaction mixture using diacetyl monoxime method (Marsh et al., 1965). One unit of the arginase was defined as μg urea formed per min/mg protein.
2.3 Statistical analysis
Statistical analysis of results obtained was done by using the SPSS program, version 15. The values are expressed as mean ± SD. The t-test was used to comparing the significant values between two groups and p values <0.05 was considered statistically significant.
3 Results
The current study was carried out on five groups of rats, control; CAPE, NaNO2, NaNO2 & CAPE protected and NaNO2 and CAPE treated groups.
Data obtained in Table 2 showed that the hemoglobin level was reduced significantly in rats drinking NaNO2 compared with control. However, in rats drinking NaNO2 treated or protected with CAPE; hemoglobin level showed non-significant changes compared with control. Serum AST activity was significantly increased in in rats drinking NaNO2 (53%), NaNO2 & CAPE (protected) group (19.7%) and NaNO2 and treated CAPE group (23.5%) compared with control. Serum urea level was elevated in the NaNO2 group (53.9%) respectively compared with control. In rats given NaNO2 and protected or treated with CAPE, urea level was reduced as compared with the NaNO2 group. NaNO2 (2%, orally); CAPE (3 mg/kg i.p.). p value versus control. p* versus NaNO2 group. N.S. = Non significant.
Groups
Parameters
Hb (g %)
ALT (U/L)
AST (U/L)
Urea (mg %)
Control
Range
13.8–17.7
22.2–46.5
52–81.7
22.5–41.3
Mean ± SD
15.68 ± 1.32
32.39 ± 8.19
67.15 ± 10.25
32.66 ± 6.82
CAPE
Range
13.5–17.5
25.8–45.3
54.5–82.4
25.2–48.6
Mean ± SD
15.2 ± 1.37
32.89 ± 7.38
68.57 ± 9.78
34.87 ± 7.44
% changes
−3.2%
1.50%
2.10%
6.70%
p value
N.S.
N.S.
N.S.
N.S.
NaNO2
Range
11.2–15.7
28.9–52.8
73.9–137.6
41.1–63.3
Mean ± SD
13.23 ± 1.4
39.52 ± 7.68
102.9 ± 22.98
50.26 ± 7.51
% changes
−15.6%
22%
53.20%
53.90%
p value
<0.001
0.059
<0.001
<0.001
NaNO2&CAPE (protected)
Range
Mean ± SD
11.8–16.9
23.8–47.8
59.6–109.2
24.3–51.2
% changes
14.58 ± 1.8
36.57 ± 8.17
80.4 ± 14.62
38.82 ± 7.54
p value
−7%
12.90%
19.70%
18.90%
p* value
N.S.
N.S.
0.03
N.S.
N.S.
N.S.
0.01
0.003
NaNO2 and treated CAPE
Range
Mean ± SD
13.8–16.5
25.7–48.2
50.05–112.4
31.6–51.8
% changes
15.14 ± 1.04
38.68 ± 7.5
82.9 ± 17.39
40.17 ± 7.12
p value
−3.4%
19.40%
23.50%
23%
p* value
N.S.
N.S.
0.023
0.027
0
N.S.
0.042
0.0064
Liver MDA level as biomarker of lipid peroxidation was increased by 26.3%, whereas liver GSH level was decreased by 45.7% in rats drinking NaNO2 compared with control. However, in rats drinking NaNO2 treated or protected with CAPE; liver MDA level was reduced and GSH level was increased compared with rats drinking NaNO2 (Fig. 1).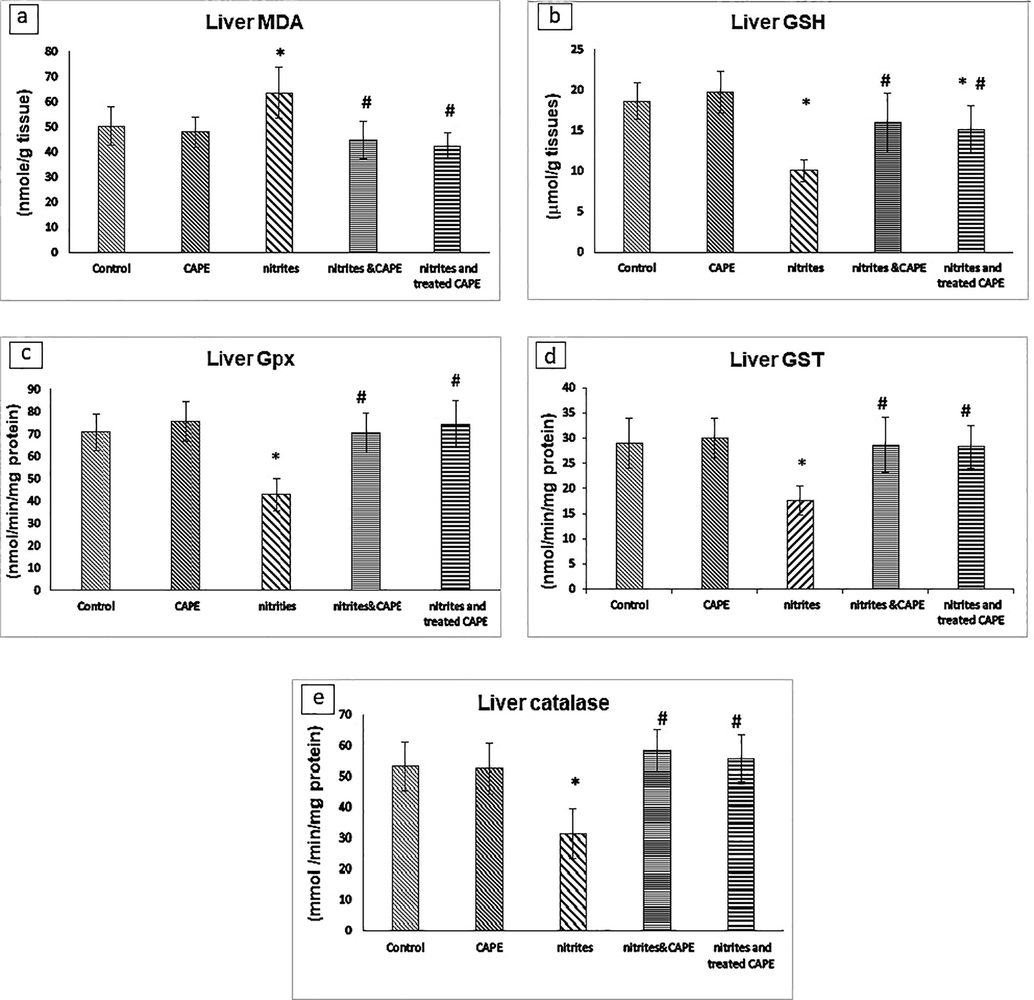
MDA (A) and GSH levels (B) and; Gpx (C); GST (D) and catalase (E) activities in rats administrated NaNO2 and protected or treated with CAPE *Significant p value versus control. # Significant p value versus NaNO2 group.
Liver Gpx, GST and catalase activities were decreased by 39.4, 39.3% and 40.8% respectively in rats drinking NaNO2 compared with control. However, liver Gpx, GST and catalase activities were elevated in rats drinking NaNO2 protected or treated with CAPE compared with rats drinking NaNO2 (Fig. 1).
Serum NO level was elevated 430% and 409% in rats drinking NaNO2 and in rats drinking NaNO2 & protected with CAPE respectively. In rats drinking NaNO2 and treated with C-APE, serum NO level showed non-significantly changed as compared with the control and showed reduced as compared with rats drinking NaNO2. Liver NO level was increased in rats drinking NaNO2 (113%), in rats drinking NaNO2 protected or treated with CAPE (102% and 33.5%) respectively compared with control. Liver NO level was reduced in NaNO2 & CAPE treated group as compared with rats drinking NaNO2 (Fig. 2).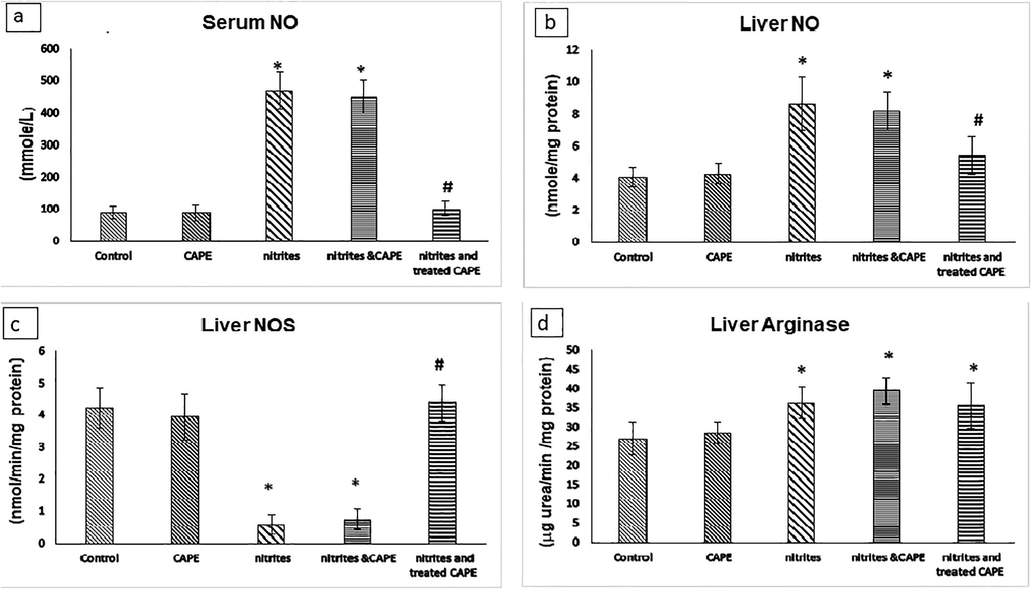
Serum (A) and liver (B) NO levels and liver NOS (C) and arginase (D) activates in rats administrated NaNO2 and protected or treated with CAPE *Significant p value versus control. # Significant p value versus NaNO2 group.
Liver NOS activity was significantly reduced in rats drinking NaNO2 and NaNO2 & protected group with CAPE (86.3% & 82.3%) compared with control. Non-significant changes of NOS activity was observed between NaNO2 treated with CAPE group and control and also between and control. Liver NOS activity was elevated in rats drinking NaNO2 treated with CAPE compared with the NaNO2 group (Fig. 2).
Liver arginase activities were elevated in rats drinking NaNO2 (34.2%), NaNO2 & CAPE protected group (46%) and NaNO2 & CAPE treated group (32.2%) as compared with the control group ((Fig. 2).
Histopathological examination of liver tissue revealed that control rats untreated or treated with CAPE showed a normal structure of hepatocytes arranged in single-cell cords with average intervening blood sinusoids (Fig. 3 a, b). No alteration of liver histopathology was observed in rats treated or protected with CAPE.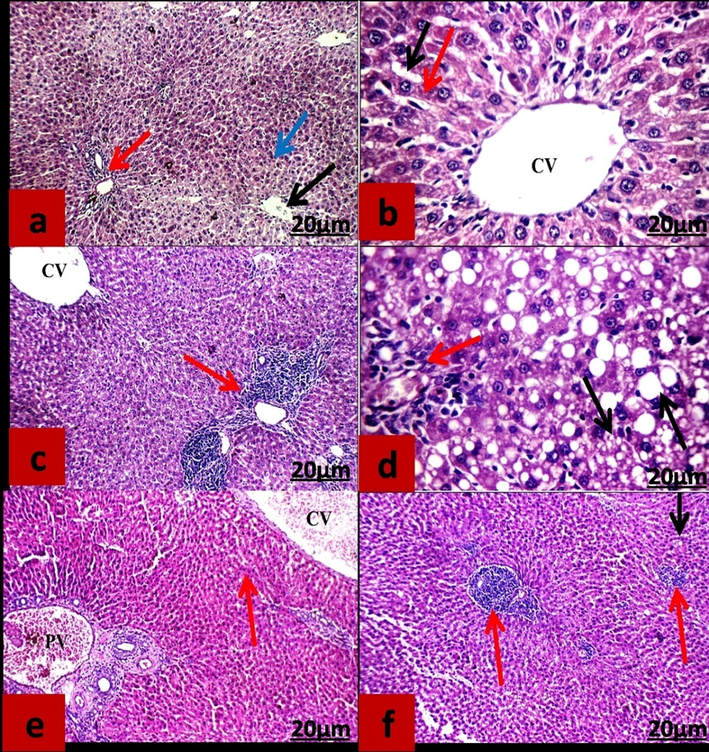
Sections of liver tissue stained with hematoxylin and eosin. (a &b) control and CAPE groups respectively. (c&d) rats received 2% sodium nitrite for 2 months. (e&f) rats received 2%sodium nitrite and protected &treated with CAPE respectively. (a): Normal liver tissue with average portal tract (red arrow), average central vein (black arrow) surrounded by average hepatocytes (blue arrow). (b): Liver showed average central vein (CV)), surrounded by average hepatocytes arranged in single-cell cords (red arrow) with average intervening blood sinusoids (black arrow) (c&d): Liver showed dilated central vein (CV) and expanded portal tract by inflammatory infiltrate (red arrow).Average portal tract (red arrow) with hepatocytes showing moderate to marked macro- and micro-vesicular steatosis (black arrows). (e & f) Liver showed dilated of central vein (CV), dilated portal vein (PV) and average hepatocytes (red arrow) (e); liver showing expanded portal tracts with inflammatory infiltrate (red arrows) and hepatocytes showing very few steatosis (black arrow) (f).
In rats drinking NaNO2 liver showed inflammatory cells infiltration, more marked micro- and macro-vesicular steatosis in periportal areas than peri-venular areas with expanded portal tract by inflammatory infiltrate (Fig. 3 c, d).
In rats drinking sodium nitrites and protected or treated with CAPE the histology of liver was lower infiltration in inflammatory cells and average hepatocytes with very few steatoses than that control rats (Fig. 3 e, f). No differences were observed between protected or treated groups.
4 Discussion
Arginine is metabolized by arginase to get ornithine and urea and by NOS to produce citrulline and NO (Rath et al., 2014). Nitric oxide exerts a biological function as a regulation of blood flow, neurotransmitter, mediate the cytotoxicity of macrophages. On the other hand, overproduction of NO reacts with superoxide anion to form peroxynitrite and hydroxyl radicals that caused oxidative damage of liver, renal, heart and endothelial tissues and inhibiting the pro-inflammatory NF-κB that mediated iNOS activity (Carnovale et al., 2000). Increased drinking or feeding of nitrites in extensive cause oxidative stress in different organs especially liver (Özen et al., 2014). CAPE has protective effects by scavenging free radicals and metals that generate reactive oxygen species, inhibits lipid peroxidation and reduces cellular damage (Iraz et al., 2005, Silva et al., 2013).
In the current study, hemoglobin level was decreased in rats given sodium nitrite and restore nearly the normal level in rats received nitrites and protected or treated with CAPE. The toxic effect of nitrites causes the increase of methemoglobin level. Nitrites convert the ferrous ion of Hb to ferric ion (Gluhchevaa et al., 2012). Lipid peroxidation products and nitrites react with sulfhydryl of phospholipids and proteins components of erythrocyte membrane and alter its structure. Nitrites promote phospholipase and that hydrolyze phospholipid that increases the rigidity of membrane structure (Gluhchevaa et al., 2012).
It was stated that CAPE had alleviated the hemoglobin, hematocrit, and counts of RBCs to normal in rats intoxicated with cadmium. CAPE inhibits the synthesis of inflammatory in red blood cells and leukocytes and whole blood (Ashour, 2014).
Results obtained showed that serum AST activity was elevated in rats treated with sodium nitrite. Elevation of serum ALT and AST activities has been considered as an indicator of tissue damage of liver or heart tissues. Nitrites react with the gastric HCl and amines and amides of amino acids to form nitrosamines and nitrosamides. Nitroso compounds induce free radicals production in rat liver tissue. Also, methemoglobinemia caused by nitrites induced hypoxic injury to centrilobular hepatocytes that consequently cause enzyme leakage (Hassan and Yousef, 2010, Khalil, 2016).
CAPE has protective effects in rats induce hepatotoxicity with isoniazid & rifampicin, it was found that ALT and AST activities and index of oxidative stress were reduced, whereas total antioxidant capacity was increased in rats induced hepatotoxicity and protected with CAPE compared with rats induced hepatotoxicity with isoniazid & rifampicin (Aliosmanoglu et al., 2018).
Serum urea level was increased in rats treated with sodium nitrite. These effects due to decreased in glomerular filtration rate and decreasing of tubular re-absorption (Hassan and Yousef, 2010). In rats received nitrites and treated or protected with CAPE, serum AST and urea level were lowered than that in rats received nitrites. This is in agreement with previous results that CAPE has antioxidant activity that relief tissue damage of liver and kidney in rats intoxicated with cadmium (Ashour, 2014).
In the present study; liver MDA as the biomarker of lipid peroxidation, serum and liver NO levels were elevated and liver NOS was depleted in rats treated with sodium nitrite as compared with the controls. These results were in agreement with the previous study that serum NO level was increased in rats (El-Sheikh and Khalil, 2011) and serum and liver MDA levels were also elevated in both rats and mice administrated nitrite (El-Sheikh and Khalil, 2011; Özen et al., 2014). Decreased liver NO levels was observed in NaNO2-treated mice in the other study contradict with our results (Özen et al., 2014). Sodium nitrites given to rats is the main cause of elevated NO in serum and liver. Serum NO increased due to drinking rats nitrites as metabolic products of NO.
NO production elevated in corresponding to hepatic iNOS expression. CAPE treatment in rats’ induced focal cerebral ischemia diminishes the inflammatory response that includes, reduction of the expression and activity of NOS, TNF-α and the activation of NF-kB cyclooxygenase, and NF-kB as an anti-inflammatory (Khan et al., 2007). Liver NOS activity was depleted in rats drinking NaNO2 and NaNO2& protected group with CAPE. Liver NOS activity was elevated in rats given NaNO2 treated with CAPE compared with the NaNO2 group.
The increased lipid peroxidation is due to high NO production from the liver. Lipid peroxidation enhances the early stages of liver proliferation (Iraz et al., 2005, Xu et al., 2012). Rats drinking nitrites and protected or treated with CAPE has ameliorative effect by decreasing lipid peroxidation and increasing GSH level. These results were agreement with another study, stated that the effect of CAPE on renal and kidney intoxicated with cadmium reduced MDA level and enhanced GSH level (Ashour, 2014). Also, it was reported that the MDA level was reduced in diabetic rats injected with CAPE (Yilmaz et al., 2004). The reduced MDA and NO levels were observed in applied CAPE to rats induced cardiac impairment (Mollaoglu et al., 2006).
Glutathione (GSH) may protect cells against oxidative damage and toxic compounds that scavenging the oxidants in presence glutathione peroxidase and glutathione reductase. The glutathione system is used as biomarkers of oxidative stress and toxic agents. GSH-Px eliminates hydrogen peroxide and hydroperoxide by oxidation of GSH to the oxidized form. The reduced form of glutathione is restored by GR that converts NADPH H+ to the oxidized form. GST is detoxified enzyme; hydrophilic toxic substance interacts with GSH as scavenge of xenobiotics to detoxify them (El-Sheikh and Khalil, 2011).
In the current study, liver glutathione level, the activities of Gpx, GST and catalase were reduced; whereas arginase activity was elevated in rats drinking nitrites. This is in agreements with the previous study reported that GSH level and catalase activity were decreased (El-Sheikh and Khalil, 2011; Hassan and Yousef, 2010). It was reported that GST and arginase activities were increased in rats given NaNO2 (Hassan and Yousef, 2010). Catalase prevents increasing of hydrogen peroxide that is the mediator of tissue damage.
In our study, rats received nitrites and CAPE as protected or treated, GSH level; and Gpx, GST and catalase activities were elevated as compared with rats received only nitrites. Catalase was also elevated in rats induced nephrotoxicity and protected with CAPE (Gökçe et al., 2009). CAPE leads to increase in the liver total antioxidant status level and a decrease in total oxidative status in rats intoxicated with insecticide paraquat (Silfeler et al., 2015).
Arginase can limit arginine availability for NO synthesis. Ornithine enters the pathways of polyamines productions that essential for cellular growth; tissue repair and wound healing. NOS produces finally nitrosative stress act as tumor killing whereas arginase produces ornithine that correlated with tumor growth. Nitrosylation of ornithine decarboxylase is effective by nitric oxide to reduce polyamine synthesis. Polyamine suppresses NOS (Rath et al., 2014). The protective effects of CAPE induce antioxidant enzymes and also detoxifying enzymes by activated NAD(P)H: quinone oxidoreductase and heme oxygenase-1(Wang et al., 2009).
In our study, infiltrating inflammatory cells, expanded portal veins and vesicular steatosis in periportal areas were observed in liver rats drinking NaNO2 liver. The CAPE administered protected or treated ameliorated that infiltrated in inflammatory cells and very few steatoses were observed. It was stated that hepatocyte was degraded and vasculature of the cytoplasm was observed that increasing the portal vein and blood sinusoids that caused by ROS. Fibroblasts stimulate fibrosis in liver (Khalil, 2016). It was revealed that administration of CAPE to rats intoxicated with chlorpyrifos (insecticides) attenuates severe hemorrhage, neutrophil infiltration, and necrosis by decreasing oxidative stress index and increasing total antioxidant capacity and inhibiting caspase-3 activation (Dokuyucu et al., 2016).
It was reported that CAPE may improve the progression of vascular dysfunction and diabetic complication in diabetic rats by increasing NO and reduce the tissue oxidative stress. CAPE has the vasorelaxant activity and not blocking by nitric oxide inhibitors (Ho et al., 2013).
5 Conclusion
It was concluded that CAP exerts hepatoprotection against nitrite induced damage by reducing lipid peroxidation and increase the antioxidant and detoxified enzymes activities. Therefore, propolis that riches in CAPE could be used as the protective or treated liver intoxicated with nitrites. Further studies need to study the mechanism of action of CAPE.
Acknowledgments
This project was funded by the Deanship of Scientific Research (DSR) at King Abdulaziz University, Jeddah, Saudi Arabia under grant IDs G-273-130-1439. The authors, therefore, acknowledge with thanks DSR for technical and financial support.
Conflict of interest
All the authors have read and agreed to submit the manuscript in this Journal of King Saud University-Science. All authors have given consent and hence no conflict of interest is recorded.
Declaration of Competing Interest
The authors declare that they have no known competing financial interests or personal relationships that could have appeared to influence the work reported in this paper.
References
- Simple method for measuring endothelial nitric oxide synthase activity in clinical researches. J. Appl. Pharm. Sci.. 2015;5:084-90.
- [Google Scholar]
- Protective effect of caffeic acid phenethyl ester on antituberculosis drug-induced hepatotoxicity in rats. Int. Surg.. 2018;102:473-478.
- [Google Scholar]
- Histological stains: a literature review and case study. Global J. Health Sci.. 2015;8:72-79.
- [Google Scholar]
- Preventative effects of caffeic Acid phenyl ester on cadmium intoxication induced hematological and blood coagulation disturbances and hepatorenal damage in rats. ISRN Hematol.. 2014;2014:764754
- [Google Scholar]
- Methods of Enzymatic Analysis. New York: Verlag Chemie: Academic Press; 1974.
- Studies on tissue arginase and ureogenesis in the elasmobranch, Mustelus canis. Arch. Biochem. Biophys.. 1961;93:448-455.
- [Google Scholar]
- Nitric oxide release and enhancement of lipid peroxidation in regenerating rat liver. J. Hepatol.. 2000;32:798-804.
- [Google Scholar]
- Novel and therapeutic effect of caffeic acid and caffeic acid phenyl ester on hepatocarcinoma cells: complete regression of hepatoma growth and metastasis by dual mechanism. FASEB J.. 2004;18:1670-1681.
- [Google Scholar]
- Attenuating effects of caffeic acid phenethyl ester with intralipid on hepatotoxicity of chlorpyrifos in the case of rats. Med. Pr.. 2016;67:743-749.
- [Google Scholar]
- Malondialdehyde determination as index of lipid peroxidation. Methods Enzymol.. 1990;186:421-431.
- [Google Scholar]
- L-Arginine and L-glutamine as immunonutrients and modulating agents for oxidative stress and toxicity induced by sodium nitrite in rats. Food Chem. Toxicol.. 2011;49:758-762.
- [Google Scholar]
- Cycling of NADPH by glucose 6-phosphate dehydrogenase optimizes the spectrophotometric assay of nitric oxide synthase activity in cell lysates. Nitric Oxide. 2006;15:148-153.
- [Google Scholar]
- Sodium nitrite-induced hematological and hemorheological changes in rats. Series Biomech.. 2012;27:53-58.
- [Google Scholar]
- Protective effect of caffeic acid phenethyl ester on cyclosporine A-induced nephrotoxicity in rats. Ren. Fail.. 2009;31:843-847.
- [Google Scholar]
- Hydrogen peroxide toxicity and detoxification in the erythrocytes of newborn infants. Blood. 1967;29:481-493.
- [Google Scholar]
- Glutathione S-transferases. the first enzymatic step in mercapturic acid formation. J. Biol. Chem.. 1974;249:7130-7139.
- [Google Scholar]
- Ameliorating effect of chicory (Cichorium intybus L.)-supplemented diet against nitrosamine precursors-induced liver injury and oxidative stress in male rats. Food Chem. Toxicol.. 2010;48:2163-2169.
- [Google Scholar]
- Caffeic acid phenethyl amide improves glucose homeostasis and attenuates the progression of vascular dysfunction in Streptozotocin-induced diabetic rats. Cardiovasc. Diabetol.. 2013;12:99.
- [Google Scholar]
- Dose dependent effects of caffeic acid phenethyl ester on heart rate and blood pressure in rats. Eur. J. Gen. Med.. 2005;2:69-75.
- [Google Scholar]
- Ameliorative Effects of Ascorbic Acid (Vit. C) Against Sodium Nitrite Toxicity in Albino Rats: Hematological, Biochemical and. Histopathol. Studies 2016
- [Google Scholar]
- Caffeic acid phenethyl ester reduces neurovascular inflammation and protects rat brain following transient focal cerebral ischemia. J. Neurochem.. 2007;102:365-377.
- [Google Scholar]
- Effects of caffeic acid phenethyl ester on lipopolysaccharide-induced lung injury in rats. Pulm. Pharmacol. Ther.. 2006;19:90-95.
- [Google Scholar]
- Protein measurement with the Folin phenol reagent. J. Biol. Chem.. 1951;193:265-275.
- [Google Scholar]
- Automated and manual direct methods for the determination of blood urea. Clin. Chem.. 1965;11:624-627.
- [Google Scholar]
- Caffeic acid phenethyl ester prevents cadmium-induced cardiac impairment in rat. Toxicology. 2006;227:15-20.
- [Google Scholar]
- Histopathologic, biochemical and genotoxic investigations on chronic sodium nitrite toxicity in mice. Exp. Toxicol. Pathol.. 2014;66:367-375.
- [Google Scholar]
- Metabolism via arginase or nitric oxide synthase: two competing arginine pathways in macrophages. Front. Immunol.. 2014;5:532.
- [Google Scholar]
- Protective effects of caffeic acid phenethyl ester on dose-dependent intoxication of rats with paraquat. Toxicol. Ind. Health. 2015;31:1000-1007.
- [Google Scholar]
- Caffeic acid phenethyl ester protects against the dopaminergic neuronal loss induced by 6-hydroxydopamine in rats. Neuroscience. 2013;233:86-94.
- [Google Scholar]
- Human safety controversies surrounding nitrate and nitrite in the diet. Nitric Oxide. 2012;26:259-266.
- [Google Scholar]
- Nitrogen oxides and hydroxyguanidines: formation of donors of nitric and nitrous oxides and possible relevance to nitrous oxide formation by nitric oxide synthase. Nitric Oxide. 1998;2:270-286.
- [Google Scholar]
- Til, H.P., Falke, H.E., Kuper, C., Willems, M.I. Evaluation of the oral toxicity of potassium nitrite in a 13-week drinking-water study in rats, 1988;26, pp. 851–9.
- Modified microassay for serum nitrite and nitrate. Biotechniques. 1996;20(390–2):94.
- [Google Scholar]
- Pharmacokinetics of caffeic acid phenethyl ester and its catechol-ring fluorinated derivative following intravenous administration to rats. Biopharm. Drug Dispos.. 2009;30:221-228.
- [Google Scholar]
- Nitrates and Nitrites. Encyclopedia of Food Sciences and Nutrition. USA: Academic Press. Elsevier; 2003.
- Pu-erh tea reduces nitric oxide levels in rats by inhibiting inducible nitric oxide synthase expression through toll-like receptor 4. Int. J. Mol. Sci.. 2012;13:7174-7185.
- [Google Scholar]
- Protective effect of caffeic acid phenethyl ester (CAPE) on lipid peroxidation and antioxidant enzymes in diabetic rat liver. J. Biochem. Mol. Toxicol.. 2004;18:234-238.
- [Google Scholar]


