

Translate this page into:
Impact of Bacillus subtilis supplemented feed on growth and biochemical constituents in Labeo rohita fingerlings
⁎Corresponding authors. asma.ch@ue.edu.pk (Asma Chaudhary), tkz@upm.edu.my (Ali Tan Kee Zuan), saminabee@gmail.com (Samina Qamer)
-
Received: ,
Accepted: ,
This article was originally published by Elsevier and was migrated to Scientific Scholar after the change of Publisher.
Peer review under responsibility of King Saud University.
Abstract
The study investigated the potential of probiotic isolate Bacillus subtilis AsCh-A4 (Accession No. MF543124) fermented feed to improve growth profile of Labeo rohita fingerlings. Morphometric measurements and nutritional indices of control and experimental groups were compared fortnightly in 90 days experiment. The formulated fish feed was fermented by Bacillus subtilis AsCh-A4 up to seven days and administered at 3% (b/w) with live (G1) and dead (G2) bacterium. G1 group showed significant higher values of DG (Daily gain) and RGR% (percent relative growth rate) in wet body weight than control and G2 while Specific Growth Rate (0.08 – 0.11%) in G1 within phase IV – VI followed by G2 (0.07%) at phase IV over control group. In all groups, the computed condition factor was 1.13, 0.91, 1.09 indicating isometric fish growth. Significantly increased body contents i.e., total protein (phase IV – VI), total carbohydrate (phase V) in G1 and DNA (phase IV) in G1 as well as G2 (phase II – III). Moreover, no significant change was assessed in total lipids, cholesterol, RNA contents, Alkaline phosphatase, Alanine aminotransferase, protease and somatic indices in all groups. Aspartate aminotransferase and acid phosphatase were significantly decreased in G1 (phase II – III) and G2 (phase III) while amylase increased in G1 (phase II). These results clearly demonstrated the growth promoting effect of the probiotics for rohu fish.
Keywords
Probiotics
Labeo rohita
Fish growth profile
Fish growth promoters
Body composition

1 Introduction
In developing and under developed countries, massive increase in human population will lead to acute food shortage. While the aquatic resources possess great potential to help meeting the increasing demands for high biologic value protein. Aquaculture contributes as animal protein source to overcome the food shortage. Now a day advanced rearing techniques and nutrition improvement practices will promote aquaculture at large scale in Pakistan (Javaid, 1990; Sandhu, 2005). Among these practices, the major restraint is the cost of feed that is going to raise expenses of fish rearing. There is a dire need to adopt supplementary feeding as substitute technique which is considered promising to enhance production and carrying capacity of fish culturing (Razvi, 2006).
Now a days, Probiotics have been employed as dietary supplement to enhance fish growth and improve resistance against disease at every stage (Gatesoupe, 2008; Bagheri et al., 2008; Suzer et al., 2008; Essa et al., 2010; Faramarzi et al., 2011; Allameh et al., 2017). Probiotics are considered as microbes to be administered deliberately to improve gut flora, health of host and to withstand acidity of stomach, bile salts and anti-microbial compounds (Siuta-Cruce and Goulet 2001; Nikoskelainen et al., 2001; Yanbo and Zirong 2006). Besides this, animal feed can also be improved by enhancing nutritional values by addition of probiotics (Ibrahim et al., 2004).
Probiotics have direct influence to promote fish growth by improving nutrient uptake and digestibility, or being source of vitamins and nutrients (Ringo and Gatesoupe, 1998; Chaudhary and Qazi, 2007). The experimental endorsement of probiotics proved to be a fish growth promoter either as feed supplement or administered directly or in water (Bogut et al., 1998). The principal bacterial groups tested as probiotic are Lactobacilli, Bacillus, Pseudomonas, Bifidobacteria and Vibrio (Kolndadacha et al., 2011). The present study, therefore, observed the use of probiotic as dietary supplement as growth promoter in Labeo rohita fingerlings.
2 Materials and methods
2.1 Composition of fish feed (25% protein)
Fish feed comprised the following ingredients (%);fish meal 5.0, ground nut oil cake 53.7, rice polishing 34.3, molasses 4.0, table salt 1.0, di calcium phosphate 1.0, and vitamin premix 1.0.
2.2 Probiotic isolate
Probiotic Bacillus subtilis AsCh-A4 was selected as test isolate that was capable to cause 100% increase in different contents of the fermented formulated (Chaudhary and Qazi, 2006). Formulate fish feed was subjected to solid state fermentation in an apparatus designed by following Hofrichter et al. (1999). Solid state fermentation of sterilized fish feed was performed in apparatus consisting of screwed capped glass container. The substrate should be up to 2 cm in height in container. Fish feed was inoculated with 288 × 105 CFU/mL (10% inoculum), aerated, incubated at 37 – 40 °C for 7 days and moisture contents (70% v/w) was maintained by addition of autoclaved water on daily basis. The isolate Bacillus subtilis AsCh-A4 caused 93.79, 130.59 and 131.78 % increment in different contents such as total protein, lipids and total carbohydrates correspondingly on 7th day of fermentation (Chaudhary and Qazi, 2006).
2.3 Identification of the bacterial isolate
The probiotic isolate AsCh-A4 was examined for colonial as well cell morphological characteristics and different tests to identify biochemically (Pelczar et al., 1986; Benson, 1994; Collins et al., 1995; Weyant et al., 1996; Merk, 1996 – 1997). However, selected strain AsCh-A4 was identified taxonomically and characterized molecularly using 16S rRNA gene sequencing.
2.4 Molecular characterization of probiotic isolate
Total DNA of AsCh-A4 isolate was extracted by heating a loopful fresh culture in 50 mM NaOH (45 µL) in water bath (95 °C). Bacterial lysate was mixed with Tris HCl (5 µL, 1 M, pH 8) and centrifuge to get supernatant for 10 min (5000 rpm). The gene 16 S rRNA was amplified with DNA polymerase (KOD FX) using PCR. The reaction mixture included 2 mM dNTP, 2 µL of AsCh-A4 isolate’s DNA, 50 µM of each primer i.e., 27F (5ʹ-AGAGTTTGATCCTGGCTCAG-3ʹ) as well as 1492R (5ʹ- AGGCTACCTTGTTACGACTT-3ʹ). Polymerase chain reaction (Applied Biosystems' (ABI) GeneAmp™ PCR System 2700) was carried out up to 35 cycles and each cycle involved following steps; denaturation (98 °C, 10 sec), annealing (53 °C, 30 sec) and extension (72 °C, 1 min). The amplified product was sequenced using automated sequencer after purification.
The BLAST-querying the GenBank database http://www.ncbi.nlm.nih.gov/blast was used to check the homology of sequences and was applied to procure the accession number.
2.5 Experimental set up
Labeo rohita fingerlings with average total length 5 – 7.5 cm were acclimatized for 10 days in laboratory conditions according to experimental parameters between their arrival and the start of the inoculation. The fish were reared in glass aquaria (2′ × 1′ × 1′) in University animal house following animal standards (The Pakistan Prevention of Cruelty to Animals Act, 1890). During acclimatization period, the fish were observed to check health status. Control feed was supplied to fingerling according to 3% of fish body weight once a day throughout experiment. Temperature of water was maintained at 24 to 27 °C. Two third water was changed daily to clean glass aquaria partially.
The experiment was designed with three experimental groups running in triplicates and each replicate consist of 30 fingerlings. Experimental work had been performed by following General principles for the care and use of animals for scientific purposes mentioned in “Guidelines on the Care and Use of Animals for Scientific Purposes, 2004 by National Advisory Committee for Laboratory Animal Research. Sterilized formulated fish was administered to control fish group. Labeo rohita fingerlings were provided with fermented feed containing live bacteria in the Experimental group G1, whereas the animals in Experimental group G2 were fed sterilized fermented feed. The fermentation of fish feed was carried out by selected probiotic isolate Bacillus subtilis AsCh-A4 in both experimental groups except control. Morphometric measurement was recorded as zero readings while stocking. Experimental duration was 90 days.
2.6 Feeding regime
Fishes were provided with their specific feed by following 3% of wet body weight daily in the morning to control and experimental groups. Calculation for administered feed was done per aquarium after 15 days based on total wet body weight. And the feeding was continued for 90 days.
2.7 Fish growth parameters
At every 15th day of the sampling period, all fingerlings of one aquarium were measured morphometrically for, total, standard and fork length, width and wet body weight by using scale on graph paper and weighing balance (Shimadzu, ELB300). For morphometric measurement, fishes were sampled in separate container having water. Fish was taken outside water to weigh and released back to respective aquaria. Utmost care was taken to avoid handling stress to the fish. Fingerlings were shifted back to their respective aquaria after collecting data. Average weight, total length (TL), standard Length (SL), fork length (FL), width, WG (wet body weight gain), K (Condition factor) DG (Daily weight gain), %RGR (Percent relative gain rate), SGR (Specific growth rate), and FCR (Feed conversion ratio) were assessed by the following expressions (Halver, 1972; Austreng, 1978; Busacker, 1990; Ahmad et al., 2002; Abdel Tawwab et al., 2008; USAID, 2011).
Average body weight = W2 (g)/total number of fishes (n)
Average TL = Final TL (cm)/total number of fishes (n)
Average SL = Final SL (cm)/total number of fishes (n)
Average FL = Final FL (cm)/total number of fishes (n)
Average width = Final width (cm)/total number of fishes (n)
K = K = 100 × W/L3
DG (g) = [W2 (g) – W1 (g)]/Days
WG (g) = [W2 (g) – W1 (g)]/W1 (g)
%RGR = [W2 (g) – W1 (g)/Days] × 100
SGR = [(log W2–log W1)/Experimental periods in days] × 100
FCR = Total feed consumption (g)/WG (g)
Where;
W2 = Final body weight
W1 = Initial body weight
Percent increment in weight than control = [(wt of experimental fishes–wt of control fishes) × 100]/wt of control fishes
In the same way, percent increment was calculated for total length, total protein, lipid and cholesterol contents.
2.8 Sampling of fish
After every 15 days, five fingerlings per aquarium were sampled randomly in the morning. The sampled fish per aquarium were netted gently and rapidly anesthetized using clove oil (50 μL/L) to collect muscle tissue (Shamna et al., 2017). After Anesthesia, fingerlings were handled carefully by wearing gloves to place in clean zipped polyethylene bags and labelled well by assigning sampling numbers. Their weight, total, fork, standard length, and width were recorded accordingly.
2.9 Organ/body weight indices
After anesthesia, five fishes per replicate were sampled and dissected within 3 h of sampling. Three organs i.e., liver, kidneys and heart of the sampled fish (n = 5) were separated after dissection and weighed to be nearest 0.001 g. Organ body indices were computed accordingly to following expression;
Relative organ weight = [Weight of organ (g) × 100]/wet body weight (g)
2.10 Biochemical analysis of muscle tissue
After anesthesia, five fishes per replicate were dissected to sample muscle tissue within 3 h of sampling. White muscle between dorsal and caudal fin above lateral line was sampled after removing skin. Muscle of sampled fishes was homogenized to extract protein, carbohydrate and enzymes (Anwar et al., 2004), lipids, RNA and DNA (Shakoori and Ahmad, 1973). The extraction was carried out for spectrophotometric estimation of total protein (Lowry et al., 1951), total lipids (Zollner and Kirsch, 1962) and total carbohydrates (Dubois et al., 1956). Nucleic acid i.e, DNA, RNA were estimated by the methods of Schneider (1957). Muscle tissues of all groups were heated in muffle furnace (550 °C for 3 – 4 h) to determine ash contents whereas tissue samples dried in convection oven up to 105 °C till constant weight to calculate moisture contents (AOAC, 2012).
AkP, Alkaline phosphate (Orthophosphoric monoester phosphohydrolase, alkaline optimum), AcP (Orthophosphoric monoester phosphohydrolase, acid optimum) activities were assessed by following protocol of Kind and King (1954). While activity of Asparatate aminotransferase (AST) alanine aminotrasferase (ALT), Amylase (1, 4 a-D glucanhydrolase) and protease were measured according to Reitman and Frankel (1957), Stegbauer (1974) and Anson (1938), respectively.
2.11 Statistical analysis
Experimental data was recorded as mean ± S.E.M for five fish per replicate. One way ANOVA using Duncan’s multiple range test was applied to analyze the fish morphometric and nutritional data (SPSS ver.16.0, Chicago, IL, USA).
3 Results
3.1 Identification and characterization of bacterial AsCh-A4 isolate
According to colonial characteristics on nutrient agar, AsCh-A4 was white in appearance and 5 mm in diameter. The colony was round, flattened, with filiform margins, butyreus (consistency) and opaque. The isolate was stained as G-positive. The cellular characteristics include slender rods with rounded ends (3 × 1 µm). Probiotic isolate was motile having polar flagella (1–2), facultative anaerobe, required 25, 37 and 45 °C temperature for growth and have 6% salt tolerance. The bacterium grew at nitrate by reducing to produce no gas and MacConkey agar but not at Simmon’s citrate and cetrimide agar. AsCh-A4 showed negative result for methyl red and urease tests while showed positive oxidase, catalase, and Voges Proskauer tests.
Based on colonial, cellular and biochemical as well as molecular characteristics, the strain AsCh-A4 was similar up to 98% to 16 S rRNA gene sequence of Bacillus subtilis. The accession numbers MF543124 was assigned to the isolate Bacillus subtilis AsCh-A4 by GenBank database ( http://www.ncbi.nlm.nih.gov/blast).
3.2 Effect of B. Subtilis AsCh-A4 supplemented feed on growth parameters of Labeo rohita fingerlings
Average body weights of the G1 fishes showed significant increase at the last three phases (IV – VI) of experiment over the respective control. The percent increment in weight was observed as 32.83 and 19.02 for G1 as well as G2 fishes than control group. Similarly regarding average total, standard, fork lengths and width, same group at the same phases showed significant elevations over the respective control. Experimental group G2 showed non-significant differences from control and G1 (Table 1). At termination of experiment, fishes of G1 and G2 showed percent increase in total length as 18.40 and 7.34 than control group. All values represent means of three replicates ± S.E.M. Values within respective column not sharing a common alphabet differ significantly from each other at p ≤ 0.05 at single factor analysis of variance.
Aspects
Parameters
Groups
Phases (Days)
Zero
I(15)
II(30)
III(45)
IV(60)
V(75)
VI(90)
Morphometry
Average weights (g)
Cont
5.29 ± 0.06
5.92 ± 0.12
6.36 ± 0.16
6.78 ± 0.28
7.17 ± 0.27 a
7.78 ± 0.20 a
8.62 ± 0.16 a
G1
5.26 ± 0.13
5.99 ± 0.16
6.51 ± 0.13
7.30 ± 0.15
8.31 ± 0.22b
9.65 ± 0.31b
11.45 ± 0.38b
G2
5.30 ± 0.18
6.09 ± 0.12
6.54 ± 0.20
7.09 ± 0.22
7.86 ± 0.11 ab
8.93 ± 0.17 ab
10.26 ± 0.04 ab
Average total length (cm)
Cont
8.02 ± 0.05
8.22 ± 0.05
8.42 ± 0.07
8.60 ± 0.12
8.64 ± 0.05 a
8.89 ± 0.10 a
9.13 ± 0.09 a
G1
8.00 ± 0.06
8.24 ± 0.07
8.53 ± 0.006
8.86 ± 0.07
9.26 ± 0.03b
9.70 ± 0.01b
10.81 ± 0.07b
G2
8.11 ± 0.09
8.30 ± 0.08
8.54 ± 0.08
8.74 ± 0.10
9.07 ± 0.06 ab
9.38 ± 0.03 ab
9.80 ± 0.00 ab
Condition Factor (K)
Cont
1.03
1.07
1.07
1.07
1.11
1.11
1.13
G1
1.03
1.07
1.05
1.05
1.05
1.06
0.91
G2
0.99
1.07
1.05
1.06
1.50
1.08
1.09
Average standard length (cm)
Cont
6.24 ± 0.05
6.44 ± 0.05
6.64 ± 0.07
6.81 ± 0.11
6.96 ± 0.12 a
7.11 ± 0.10 a
7.35 ± 0.09 a
G1
6.22 ± 0.06
6.46 ± 0.07
6.75 ± 0.06
7.15 ± 0.01
7.48 ± 0.03b
7.92 ± 0.01b
8.38 ± 0.08b
G2
6.14 ± 0.03
6.51 ± 0.08
6.76 ± 0.08
7.96 ± 0.01
7.28 ± 0.04 ab
7.60 ± 0.03 ab
7.97 ± 0.05 ab
Average fork length (cm)
Cont
6.74 ± 0.05
6.94 ± 0.05
7.14 ± 0.07
7.32 ± 0.12
7.46 ± 0.12 a
7.61 ± 0.1 a
7.85 ± 0.09 a
G1
6.72 ± 0.06
6.96 ± 0.07
7.25 ± 0.06
7.58 ± 0.07
7.98 ± 0.03b
8.42 ± 0.01b
8.90 ± 0.07b
G2
6.83 ± 0.09
7.02 ± 0.08
7.26 ± 0.08
7.46 ± 0.10
7.79 ± 0.06 ab
8.10 ± 0.03 ab
8.42 ± 0.10 ab
Average width(cm)
Cont
1.71 ± 0.02
1.82 ± 0.01
1.86 ± 0.01
1.96 ± 0.02
2.02 ± 0.03 a
2.11 ± 0.01 a
2.19 ± 0.01 a
G1
1.72 ± 0.03
1.85 ± 0.02
1.96 ± 0.03
2.06 ± 0.02
2.22 ± 0.03b
2.37 ± 0.04b
2.50 ± 0.02b
G2
1.71 ± 0.01
1.83 ± 0.02
1.93 ± 0.02
2.01 ± 0.02
2.14 ± 0.03 ab
2.25 ± 0.03 ab
2.35 ± 0.02 ab
Nutritional Indices
Wet body weight gain fortnightly (WG)
Cont
–
18.96 ± 2.24
10.30 ± 1.03
10.49 ± 0.88 a
7.06 ± 1.34 a
6.28 ± 0.43 a
4.34 ± 0.06 a
G1
–
22.11 ± 3.15
10.97 ± 0.26
13.96 ± 0.91b
12.85 ± 0.35b
11.91 ± 0.55b
9.26 ± 0.68b
G2
–
23.48 ± 1.68
11.41 ± 1.34
10.57 ± 0.38 a
9.16 ± 0.30 a
8.31 ± 0.33 a
6.03 ± 0.56 a
Daily weight gain (DG)
Cont
–
1.26 ± 0.15
0.68 ± 0.07
0.70 ± 0.06 a
0.47 ± 0.09 a
0.41 ± 0.03 a
0.28 ± 0.00 a
G1
–
1.47 ± 0.21
0.73 ± 0.02
0.93 ± 0.06b
0.86 ± 0.03b
0.79 ± 0.04b
0.62 ± 0.04b
G2
–
1.57 ± 0.11
0.76 ± 0.09
0.70 ± 0.003 a
0.61 ± 0.02 a
0.55 ± 0.02 a
0.41 ± 0.03 a
% Relative weight gain rate (%RGR)
Cont
–
11.94 ± 1.34
8.0 ± 1.28
6.07 ± 2.06 ab
5.64 ± 1.28 a
8.62 ± 1.57 a
10.62 ± 1.44 a
G1
–
14.03 ± 1.99
8.69 ± 1.07
12.03 ± 0.53 a
13.78 ± 0.92b
16.09 ± 0.65b
19.36 ± 0.45b
G2
–
14.83 ± 1.51
8.18 ± 1.65
7.70 ± 0.50b
10.62 ± 2.49 ab
13.35 ± 1.16c
13.13 ± 2.32c
Specific growth rate (SGR)
Cont
–
0.33 ± 0.04
0.11 ± 0.02
0.06 ± 0.02
0.04 ± 0.01 a
0.05 ± 0.08 a
0.05 ± 0.006 a
G1
–
0.38 ± 0.05
0.12 ± 0.01
0.11 ± 0.005
0.09 ± 0.006b
0.08 ± 0.005b
0.08 ± 0.003b
G2
–
0.4 ± 0.04
0.11 ± 0.02
0.07 ± 0.005
0.07 ± 0.016b
0.07 ± 0.007 ab
0.06 ± 0.01 ab
FCR
Cont
–
2.86 ± 0.36
5.03 ± 0.54
3.95 ± 0.21
4.67 ± 0.96
3.23 ± 0.19 a
2.20 ± 0.03
G1
–
2.54 ± 0.37
4.70 ± 0.28
3.29 ± 0.23
2.96 ± 0.15
2.39 ± 0.03b
1.68 ± 0.08
G2
–
2.32 ± 0.24
4.64 ± 0.45
4.13 ± 0.30
3.81 ± 0.24
3.12 ± 0.05c
2.28 ± 0.23
PER%
Cont
–
4.21 ± 0.68 a
0.81 ± 3.56
−9.88 ± 3.86 a
−3.75 ± 1.55 a
−0.124 ± 1.053
−2.67 ± 1.20 a
G1
–
1.69 ± 0.23b
0.48 ± 0.01
0.831 ± 0.12b
0.64 ± 0.06b
0.54 ± 0.05
0.43 ± 0.04b
G2
–
1.39 ± 0.12b
0.70 ± 0.17
1.40 ± 0.04b
0.63 ± 0.00b
0.30 ± 0.01
0.26 ± 0.01b
Condition factor for all phases was calculated. The K factor varies from 1.03 to 1.13 (control), 0.91–1.07 (G1) and 0.99–1.50 (G2) from the start to end of experiment. When wet body weight gain (WG) and daily weight gain (DG) of control and experimental fishes were compared, it appeared that G1 group at the last four phases (III – VI) had significantly higher values of the parameter as compared to both the control and G2 groups. Percent Relative weight gain rate (%RGR) also indicated significant increase in G1 at the last four phases (III – VI) and in G2 at last two phases (V – VI) of the experiment as compared to control level. Regarding percent specific growth rate (SGR), significant increase was observed in G1 group in last three phases (IV – VI) while same increasing trend was only observed in G2 at phase IV (60 days) than control values as described in Table 1.
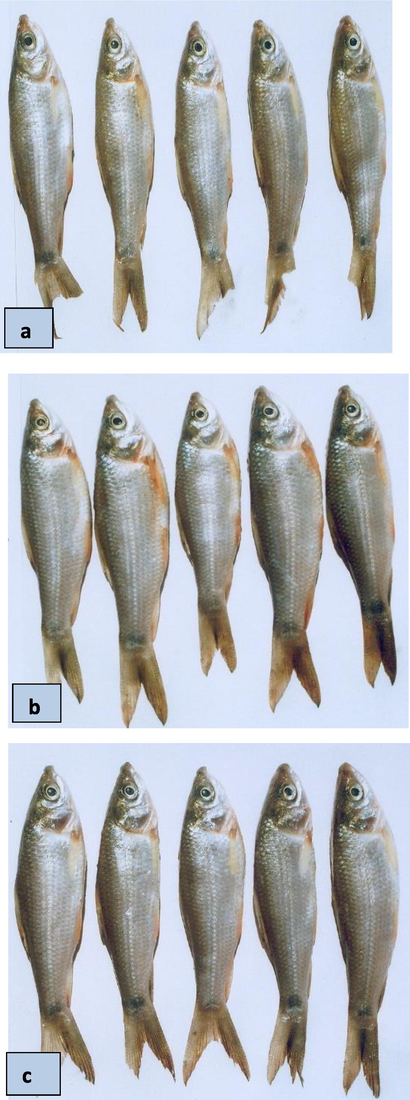
Feed conversion rate (FCR) values of both experimental groups were lower than control but significant at phase V than control and G2 groups (Table 1). Growth of control and experimental groups were showed in Figs. 1–6.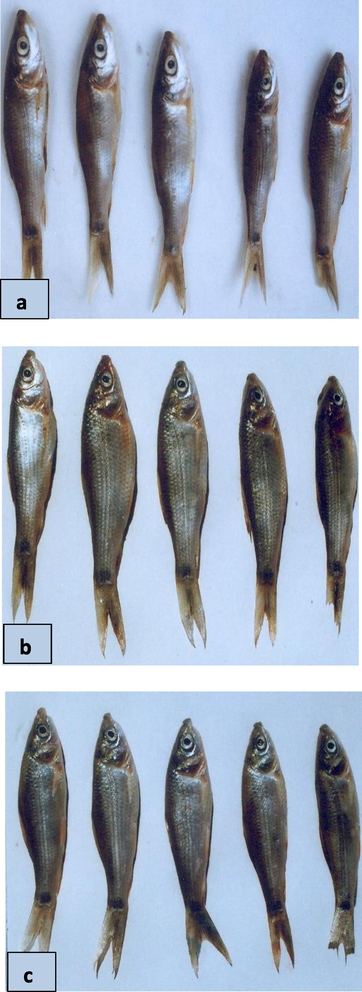
Photographs of control (a), G1 (b) and G2 (c) fish groups at start of experiment i.e. phase 0 (zero days).
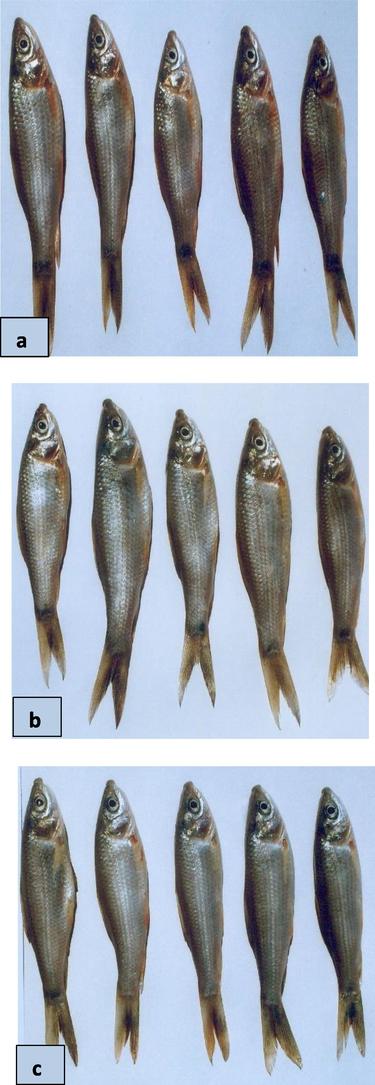
Photographs of control (a), G1 (b) and G2 (c) fish groups at phase II (30 days).
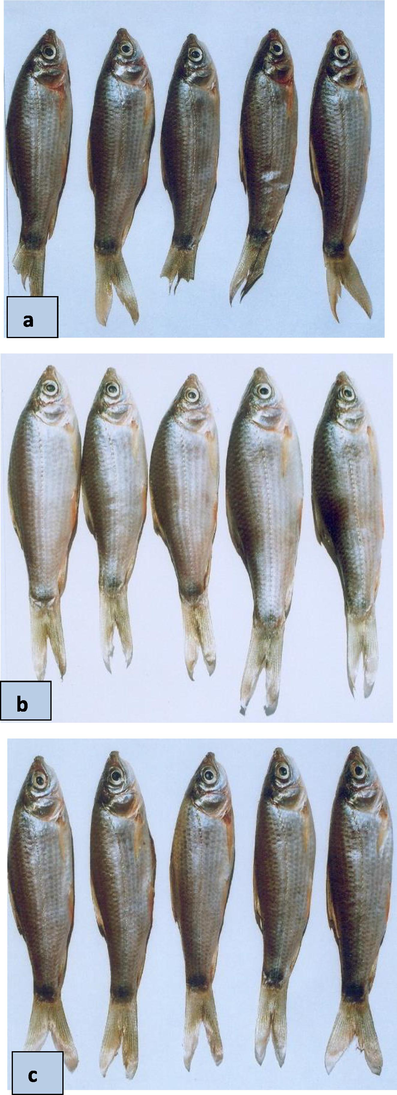
Photographs of control (a), G1 (b) and G2 (c) fish groups at phase III (45 days).
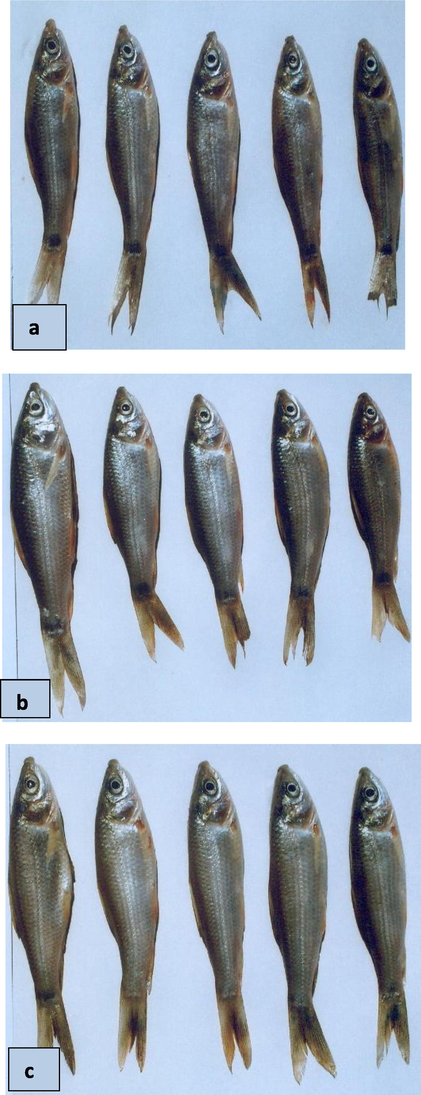
Photographs of control (a), G1 (b) and G2 (c) fish groups at phase IV (60 days).
Photographs of control (a) and experimental groups G1 (b), G2 (c) fishes representing phase V (75 days).
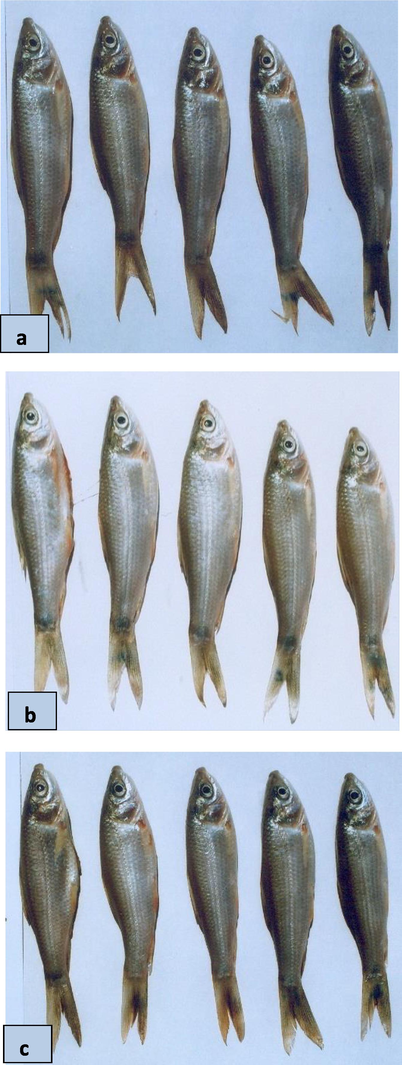
Photographs of control (a) and experimental groups G1 (b), G2 (c) fishes representing phase VI (90 days).
3.3 Somatic indices
Somatic indices of kidney, heart, and liver from the control and two experimental groups at different phases were recorded in Table 2. Non-significant difference in somatic indices were evaluated in control as well as experimental groups at all phases of the experiment. All values represent means of three replicates ± S.E.M. Values within respective column not sharing a common alphabet differ significantly from each other at p ≤ 0.05 at single factor analysis of variance.
Parameters
Groups
Phases (Days)
Zero
I(15)
II(30)
III(45)
IV(60)
V(75)
VI(90)
Kidney index
Cont
11.72 ± 0.54
11.80 ± 0.48
12.21 ± 0.41
17.60 ± 0.28
17.92 ± 0.34
19.53 ± 0.34 a
22.53 ± 0.26 a
G1
11.27 ± 0.61
12.73 ± 0.53
13.10 ± 0.57
18.02 ± 0.33
18.19 ± 0.35
20.86 ± 0.24b
24.35 ± 0.23b
G2
11.78 ± 0.33
12.76 ± 0.45
13.01 ± 0.61
18.03 ± 0.33
18.08 ± 0.27
19.61 ± 0.27 a
23.07 ± 0.21 a
Heart index
Cont
74.63 ± 2.29
77.92 ± 0.81 a
87.28 ± 1.12 a
92.82 ± 1.43
92.76 ± 1.46 a
97.44 ± 1.15 a
101.39 ± 1.73 a
G1
74.88 ± 1.45
84.83 ± 1.41b
88.97 ± 1.43 ab
95.26 ± 2.19
96.47 ± 1.45 ab
99.68 ± 1.46b
107.33 ± 1.86 a
G2
74.00 ± 1.45
86.52 ± 1.24b
92.89 ± 1.44b
94.91 ± 1.87
92.09 ± 1.49b
78.46 ± 1.74 a
81.15 ± 2.00b
Liver index
Cont
276.69 ± 28.77
350.75 ± 23.04
369.83 ± 17.66
380.58 ± 35.13
395.42 ± 27.69
423.29 ± 26.73
454.94 ± 30.33
G1
275.44 ± 13.08
386.18 ± 20.89
383.76 ± 18.58
422.83 ± 13.08
387.39 ± 28.33
436.46 ± 16.12
475.08 ± 26.53
G2
275.79 ± 16.12
385.27 ± 25.42
360.89 ± 10.63
398.30 ± 23.87
381.79 ± 23.29
427.53 ± 24.49
463.72 ± 21.13
3.4 Biochemical constituents of muscle tissues of control and experimental fishes
Biochemical components such as total protein, total lipids, total carbohydrates, RNA, DNA, moisture and ash contents were analyzed in control as well as experimental fishes at different phases of experiment (Table 3). No-significant difference was observed in total lipids, RNA and moisture contents in control and experimental groups. Regarding total protein, experimental group G1 showed significant increase at phase V and VI (75 – 90 days). Percent elevation in protein contents were 30.27 (G1) and 6.85 (G2) than respective control. In Lipids and cholesterol contents, percent increase in experimental groups than control was calculated as 4.42 and 2.09 (G1), 1.93 and 1.09 (G2) respectively at end of experiment. Significant increase in total carbohydrates was recorded in experimental group G2 at phase I, II while significant decrease was evaluated at phases IV – VI. Significant difference in total carbohydrates was noted in G1 at Phase I and V. Group G2 showed increase in DNA contents to more/less decrease in phase I and V. No difference was seen at phase V and VI in both G1 and G2. Significant difference in ash contents was evaluated in both experimental groups than control values at phases I, IV – VI while both experimental groups differed significantly at last two phases. Non-significant difference was observed in fat, RNA and moisture contents. All values represent means of three replicates ± S.E.M. Values within respective column not sharing a common alphabet differ significantly from each other at p ≤ 0.05 at single factor analysis of variance. n = 15 for each control and experimental groups.
Parameters
Groups
Phases (Days)
Zero
I(15)
II(30)
III(45)
IV(60)
V(75)
VI(90)
Biochemical Constituents
Total protein (mg/g)
Cont
11.72 ± 0.54
11.80 ± 0.48
12.21 ± 0.41
17.60 ± 0.28
17.92 ± 0.34
19.53 ± 0.34 a
22.53 ± 0.26 a
G1
11.42 ± 0.33
12.73 ± 0.53
13.10 ± 0.57
18.02 ± 0.33
18.19 ± 0.35
24.86 ± 0.24b
29.35 ± 0.23b
G2
11.77 ± 0.43
12.76 ± 0.45
13.01 ± 0.61
18.03 ± 0.33
18.08 ± 0.27
19.61 ± 0.27 a
24.07 ± 0.21 a
Total carbohydrates (mg/g)
Cont
74.63 ± 2.29
77.92 ± 0.81 a
87.28 ± 1.12 a
92.82 ± 1.43
92.76 ± 1.46 a
97.44 ± 1.15 a
101.39 ± 1.73 a
G1
75.66 ± 2.10
84.83 ± 1.41b
88.97 ± 1.43 ab
95.26 ± 2.19
96.47 ± 1.45 ab
99.68 ± 1.46b
107.33 ± 1.86 a
G2
75.00 ± 1.80
86.52 ± 1.24b
92.89 ± 1.44b
94.91 ± 1.87
92.09 ± 1.49b
78.46 ± 1.74 a
81.15 ± 2.00b
Total lipids (mg/g)
Cont
276.69 ± 28.77
350.75 ± 23.04
369.83 ± 17.66
380.58 ± 35.13
395.42 ± 27.69
423.29 ± 26.73
454.94 ± 30.33
G1
276.11 ± 11.85
386.18 ± 20.89
383.76 ± 18.58
422.83 ± 13.08
387.39 ± 28.33
436.46 ± 16.12
475.08 ± 26.53
G2
276.00 ± 15.07
385.27 ± 25.42
360.89 ± 10.63
398.30 ± 23.87
381.79 ± 23.29
427.53 ± 24.49
463.72 ± 21.13
Cholestrol (mg/g)
Cont
69.05 ± 14.17
75.57 ± 7.05
79.27 ± 5.67
78.03 ± 6.33
98.32 ± 2.56
113.99 ± 13.87
150.61 ± 8.96
G1
69.89 ± 3.55
80.13 ± 4.77
90.83 ± 4.45
84.25 ± 5.66
100.54 ± 4.61
143.57 ± 6.70
153.76 ± 11.77
G2
70.44 ± 11.87
77.61 ± 5.96
79.69 ± 4.67
84.40 ± 4.09
99.68 ± 3.99
147.88 ± 12.08
152.26 ± 8.78
DNA (µg/g)
Cont
0.45 ± 0.02
0.83 ± 0.42
0.34 ± 0.03 a
0.49 ± 0.05a
0.53 ± 0.02 a
0.71 ± 0.04
0.59 ± 0.08
G1
0.44 ± 0.08
0.47 ± 0.04
0.44 ± 0.03 ab
0.50 ± 0.007 a
0.51 ± 0.04b
0.51 ± 0.04
0.70 ± 0.04
G2
0.45 ± 0.02
0.80 ± 0.06
0.49 ± 0.06b
0.69 ± 0.04b
0.59 ± 0.05 ab
0.63 ± 0.06
0.70 ± 0.05
RNA (µg/g)
Cont
2.93 ± 0.05
2.99 ± 0.31
2.59 ± 0.13
3.10 ± 0.13
3.31 ± 0.08
3.62 ± 0.06
4.01 ± 0.04
G1
3.15 ± 0.07
2.88 ± 0.05
2.26 ± 0.11
3.08 ± 0.13
3.27 ± 0.08
3.70 ± 0.05
3.99 ± 0.05
G2
3.22 ± 0.18
3.01 ± 0.13
2.59 ± 0.15
3.06 ± 0.12
3.21 ± 0.06
3.58 ± 0.04
3.97 ± 0.05
Ash contents (%)
Cont
4.68 ± 0.27
5.73 ± 0.25 a
6.32 ± 0.19 a
8.96 ± 0.21 a
9.20 ± 0.26 a
10.14 ± 0.32 a
11.03 ± 0.20 a
G1
4.44 ± 0.10
6.90 ± 0.19b
7.68 ± 0.23 a
9.80 ± 0.24b
10.65 ± 0.20b
12.15 ± 0.30b
14.84 ± 0.18b
G2
4.03 ± 0.38
7.05 ± 0.20b
8.53 ± 0.28b
9.11 ± 0.18 ab
8.24 ± 0.25c
10.38 ± 0.44 a
11.54 ± 0.21 a
Moisture contents (%)
Cont
69.05 ± 14.17
75.57 ± 7.05 a
79.27 ± 5.67
78.03 ± 6.33 a
78.32 ± 2.56
73.99 ± 13.87 a
70.61 ± 8.96
G1
68.77 ± 2.87
80.13 ± 4.77b
80.83 ± 4.45
74.25 ± 5.66b
80.54 ± 4.61
73.57 ± 6.70 a
71.76 ± 11.77
G2
69.23 ± 3.09
77.61 ± 5.96 ab
79.69 ± 4.67
74.40 ± 4.09b
79.68 ± 3.99
77.88 ± 12.08b
71.26 ± 8.78
Enzyme Profiling
Acid phosphatase IU/g
Cont
0.04 ± 0.01
0.07 ± 0.007
0.12 ± 0.02a
0.12 ± 0.02 a
0.24 ± 0.03 a
0.14 ± 0.03
0.15 ± 0.02
G1
0.04 ± 0.03
0.05 ± 0.006
0.06 ± 0.01b
0.07 ± 0.01b
0.18 ± 0.03 ab
0.11 ± 0.01
0.14 ± 0.02
G2
0.04 ± 0.02
0.05 ± 0.004
0.08 ± 0.01 ab
0.09 ± 0.01 ab
0.11 ± 0.02b
0.13 ± 0.01
0.13 ± 0.02
Alkaline phosphatase IU/g
Cont
0.11 ± 0.03
0.09 ± 0.02
0.15 ± 0.03 ab
0.06 ± 0.01
0.16 ± 0.05
0.21 ± 0.01
0.24 ± 0.05
G1
0.10 ± 0.01
0.19 ± 0.03
0.23 ± 0.05 a
0.06 ± 0.01
0.17 ± 0.03
0.18 ± 0.04
0.22 ± 0.03
G2
0.11 ± 0.01
0.19 ± 0.03
0.08 ± 0.01b
0.07 ± 0.01
0.23 ± 0.10
0.20 ± 0.11
0.23 ± 0.05
AST IU/g
Cont
5.48 ± 0.48
5.81 ± 2.26
5.22 ± 0.28 a
7.46 ± 0.46 a
6.99 ± 0.81
5.98 ± 0.70
6.22 ± 0.46
G1
5.23 ± 0.51
5.78 ± 0.79
3.69 ± 0.34b
5.22 ± 0.28b
6.68 ± 0.57
5.65 ± 0.29
5.98 ± 0.24
G2
4.21 ± 0.12
4.96 ± 0.33
4.37 ± 0.20 ab
4.99 ± 0.35b
6.79 ± 0.77
5.53 ± 0.38
6.15 ± 0.22
ALT IU/g
Cont
1.63 ± 0.48
2.66 ± 1.06
2.42 ± 0.30 a
3.78 ± 1.09
5.29 ± 1.13
6.47 ± 1.41
7.0 ± 0.78
G1
1.22 ± 0.11
1.95 ± 0.26
5.12 ± 0.79b
3.30 ± 0.42
5.10 ± 1.09
6.91 ± 0.45
7.45 ± 0.81
G2
1.59 ± 0.22
2.41 ± 0.15
4.71 ± 0.76 ab
1.87 ± 0.24
3.21 ± 0.66
5.26 ± 1.42
9.06 ± 0.74
Protease µM/g
Cont
0.09 ± 0.01
0.11 ± 0.06
0.24 ± 0.02 ab
0.19 ± 0.09
0.12 ± 0.03
0.17 ± 0.02
0.24 ± 0.04
G1
0.10 ± 0.04
0.19 ± 0.02
0.31 ± 0.06 a
0.11 ± 0.02
0.11 ± 0.01
0.13 ± 0.01
0.20 ± 0.03
G2
0.08 ± 0.01
0.15 ± 0.02
0.13 ± 0.03b
0.09 ± 0.02
0.10 ± 0.02
0.13 ± 0.01
0.23 ± 0.03
Amylase mM/g
Cont
2.46 ± 0.52
1.88 ± 0.45
1.93 ± 0.21 a
1.57 ± 0.18
0.90 ± 0.20
1.69 ± 0.26
2.36 ± 0.16
G1
2.16 ± 0.21
2.50 ± 0.24
3.52 ± 0.53b
1.50 ± 0.58
1.22 ± 0.28
1.65 ± 0.21
2.33 ± 0.16
G2
2.44 ± 0.01
1.78 ± 0.22
1.61 ± 0.28 a
1.45 ± 0.51
0.91 ± 0.12
1.34 ± 0.17
1.95 ± 0.27
The activities of different enzyme i.e., AkP (Alkaline phosphatase), AcP (Acid phosphatase), AST, ALT, protease and amylase in muscle tissue were also investigated and results were tabulated in Table 3. Significant decrease was recorded in group G1 in acid phosphatase and ALT at phase II, III while in AST at phase II. Significant increase in G1 at phase II was investigated. Group G2 showed significant difference in alkaline phosphatase and protease (phase II), AST (phase III), acid phosphatase (phase IV) than control and experimental groups. In Later phases, enzymes stabilizes and no significant differences were noted.
4 Discussion
In the present study, the results revealed the beneficial effect of Bacillus subtilis AsCh-A4 supplementation in fish feed on growth efficiency in L. rohita fingerlings. The beneficial incorporation of microbes in fish feed or water to improve the health status of the animal can be termed as probiotics (Moriarty, 1998). The variety of probiotics can be incorporated to fish culture such as yeast, bacteria (gram positive as well gram negative), unicellular algae, and bacteriophages (Irianto and Austin, 2002a).
The study dealt with the effect of fermented fish feed by Bacillus subtilis AsCh-A4 that was administered to Labeo rohita fingerlings in two forms i.e., live and dead bacterium. The useful application of administration of live probiotics has been commented by many investigators (Lara-Flores et al., 2010; Essa et al., 2010; Boonthai et al., 2011; Seenivasan et al., 2011, 2012; Reda and Selim, 2015). According to Siuta Cruce and Goulet (2001), viability of probiotic stains should be maintained in order to get better results regarding host’ health and should be incorporated in high enough numbers. Similar trend were also observed by Noh et al. (1994) in carps, Gildberg et al. (1995, 1997) in Atlantic cod and Metaillier and Hollocou (1993) in Atlantic salmon. The percent increment in weight was observed as 32.83 and 19.02 for G1 as well as G2 fishes than control group. At termination of experiment, fishes of G1 and G2 showed percent increase in total length as 18.40 and 7.34 than control group. The present investigation also corroborated the results of Ringpipat et al. (1998), Maeda and Liao. (1992) and Garriques and Arevalo (1995) which revealed a significant increase in growth parameters of Penaeus when provided with probiotic supplemented diets. According to Ding et al. (2004), probiotic augmented diets enhanced fish growth that may be related to better digestive activity by improved vitamin synthesis and digestive enzyme activity.
Condition factor is considered a standard practice representing good experimental conditions and isometric growth indicator (Ayode, 2011). Computation of factor is based on length weight data analysis. The study reflected the isometric growth in control (1.03–1.13) as well as experimental groups (G1, 0.91–1.07, G2, 0.99–1.50) because condition factor was observed near 1. Same results (1.64–1.79) were reported in Oreochromis niloticus (Ighwela et al., 2011).
Supplementation of probiotics in basal and formulated feed of fish influenced different morphometric parameters such as body weight, body length, weight gain and SGR. Such potential was reported in Nile tilapia, Oreochromis niloticus using Bacillus subtilis (Soltan and El-Laithy, 2008) and with Enterococcus faecium (Wang et al., 2008). Lactobacillus acidophilus improved growth profile than control group of African catfish Clarias gariepinus (Al-Dohail et al., 2009). Probiotics boosted the nutritional value of fish diet by vitamin production such as vitamin B12 and biotin and detoxification of detrimental compounds. It promote immunity by inhibiting pathogen colonization in host gut, triggering for nutrient competition and adjusting metabolism of microbes (Gibson et al., 1997; Gatesoupe, 1999).
The usage of biochemical constituent measurement of fish muscle is considered as a reliable index to assess growth nutritional indices and growth profile of fish fingerlings (Ghosh et al., 2003; Cnaani et al., 2004; Krishnaveni et al., 2013). Bacillus subtilis AsCh-A4 improved the factors to assess growth profile such as average weight, length, width of fish, Daily gain, Relative gain rate, Specific growth rate, and reduced FCR etc. Feed with live bacterium (G1) reduced the FCR in all phases and to less than 2 at end of experiment than control and G2. While PER% were accelerated in G1 and G2. The reduction of FCR is supported by PER which is evident attribute of tested probiotic (USAID 2011). Inclusion of live probiotic in fish may lead to improve GIT microflora and greater GIT activity as well as FCE and PER (Munir et al., 2016). The artificial and probiotic incorporated fish feed can be considered as good source to fulfill the nutritional requirements. The rate of growth, FCR, and chemical composition of fish may be exaggerated by feed qualitatively and quantitatively (Jena et al., 1998; Erfanullah and Jafri, 1998).
Dietary probiotics and prebiotics when administered to fish will lead to increase in muscle protein and crude lipids. Fish with high protein contents and low lipids is considered beneficial to compensate feed shortage (Wee, 1982; Annasari et al., 2012). In last phases, probiotics improved body composition from control i.e., higher deposition of protein with more or less difference in ash contents. The result coincides with findings of Lara-Flores et al. (2003) as well as Alizade et al. (2011). Higher body protein contents implies the fact that probiotic incorporated feed was converted to structural protein more effectively and leads to more body muscle production. Non-significant difference was observed in fat, RNA and moisture contents. Similar results i.e., no difference in body moisture and fat were reported by Eid and Mohmad (2008) and Hassaan et al. (2014) in Oreochromis niloticus fingerlings. Highest DNA in two phases were recorded which is corroborated with Krishnaveni et al. (2013) and Khan and Jafri (1991). DNA and RNA are considered a good indicator for fish growth assessment (Smith and Buckley, 2003; Mukherjee and Jana, 2007).
The fluctuation in protein, fat and carbohydrates in fish muscle tissue can be associated to the deposition and synthesis rate in fish (Abdel-Tawwab et al., 2006). In present study, the role of Bacillus subtilis AsCh-A4 in fish feed cannot be ignored in enhancement of feed intake, growth and body composition. This genus has ability of producing enzymes, antibiotics and amino acids and is not associated with fish pathologies (Moriarty, 1998; Sanders et al., 2003; Gullian et al., 2004). Ray et al. (2012) reported the Bacillus sp. as immunostimulant and posing adhesion and bacteriocin producing abilities. Growth, survival and carcass composition improvement by dietary provision of Bacillus has been recorded in rainbow trout fry and fresh water prawn Macrobrachoum rosenbergii post larvae (Alizadeh et al., 2011; Seenivasan et al., 2013).
In later phases of experiment, enzymes stabilizes and no significant differences were noted. Decreased ALT and AST levels were observed in Nile tilapia when administered with probiotic enriched diet (Soltan and El-Laithy 2008) and diet supplemented pseudomonas as well as Micrococcus luteus and Pseudomonas sp. consortium (Wache¢ et al., 2006. Similarly, fish fed with probiotics i.e., dead S. cerevisae as well as live B. subtilis and S. cerevisae mixture reflected decrease in ALT and AST than control (Marzouk et al., 2008).
Aminotransferases indicated the damage at cellular level and tissue amelioration due to stress. It is considered to identify dysfunction in fish tissue or organ as an enzymatic biomarker. Aspartate aminotransferases are considered to be involved in transamination process that are helpful in protein and carbohydrate metabolism by converting alanine and α-ketoglutarate to glutamic and pyruvic acid (Salah El-Deen and Rogers, 1993; Philip and Rajarsee, 1996; Palanivelu et al. 2005; Gabriel and George, 2005). Alanine aminotransferases are indicator for ameliorative changes in tissues by assessing physiological and biochemical dysfunction and enzyme leakage from liver to cytosol than blood (Kumar et al., 2012). Phosphatases are considered multifunctional enzyme biomarkers to probe the response of cells against stresses in form of toxic pollutants. Alkaline phosphatase mediated mineralization in aquatic animal’s skeleton (Lan et al. 1995; Lohner et al., 2001; Zikic et al. 2001). Probiotics and prebiotics supplemented feeds mediate intestinal micro flora to secrete major enzymes such as amylase to stimulate digestion (Xu et al., 2003; Yanbo and Zirong 2006; Essa et al., 2010; Askarian et al., 2011; Sang et al., 2011; Wu et al., 2014).
5 Conclusion
The tested probiotic established the effectiveness in L. rohita fingerlings growth, high PER, increased protein contents, low FCR and fat when incorporated in feed with 10% (288 × 105 CFU/mL) inoculum. The feed with live Bacillus subtilis AsCh-A4 may be proved economically viable. However, this study will provide base to explore more about nutrient digestibility, gut microflora, blood parameters, and immunity etc. for L. rohita fingerlings.
Ethical Statement
It is to certify that during experimental research entitled “Impact of Bacillus subtilis supplemented feed on growth and biochemical constituents in Labeo rohita Fingerlings”, none of the Labeo rohita fingerlings was subjected to killing unless international guidelines for rearing and care of fish were strictly followed.
Acknowledgements
This experimental work is a part of first author’s Ph. D thesis supervised by Dr. J.I. Qazi. University of the Punjab is the main financial body. This work was funded by Taif University Researches Supporting Project number (TURSP-2020/57), Taif University, Taif, Saudi Arabia. This work is also funded by RMC-UTM with industrial grant NO. RJ130000.7609.4C187 and RJ130000.7609.4C136.
Declaration of Competing Interest
The authors declare that they have no known competing financial interests or personal relationships that could have appeared to influence the work reported in this paper.
References
- Compensatory growth, feed utilization, whole body composition and hematological changes in starved juvenile Nile tilapia, Oreochromis niloticus L. J. Appl. Aquacult.. 2006;18(3):17-36.
- [Google Scholar]
- Evaluation of commercial live baker's yeast, Saccharomyces cerevisiae as a growth and immunity promoter for Fry Nile tilapia Oreochromis niloticus challenge in situ with Aeromonas hydrophila. Aquacult.. 2008;280(1–4):185-189.
- [Google Scholar]
- Effects of 17 alpha-methyltestosterone on growth performance and some physiological changes of Nile Tilapia fingerlings (Oreochromis niloticus L) EJABF.. 2002;6(2):1-23.
- [Google Scholar]
- Effects of the probiotics, Lactobacillus acidophilus, on the growth performance, haematology parameters and immunoglobulin concentration in African Catfish (Clarias gariepinus, Burchell 1822) fingerling. Aquacult. Res.. 2009;40(14):1542-1652.
- [CrossRef] [Google Scholar]
- The effect of probiotic Bioplus 2B on growth performance and carcass composition of rainbow trout, Oncorhynchus mykiss (Walbaum, 1792) larvae. Indian J. Fish.. 2011;58(4):55-59.
- [Google Scholar]
- Effects of Probiotic Bacteria on Fish Performance. Adv. Tech. Clin. Microbiol.. 2017;1:2.
- [Google Scholar]
- Albumin and zinc content of snakehead fish (Channa striata) extract and its role in health. IEESE Int. J. Sci. Tech.. 2012;1(2):1-8.
- [Google Scholar]
- Effect of a single dose of permethrin on the biochemical components of developing muscle in chick embryo. Pakistan J. Zool.. 2004;36:7-12.
- [Google Scholar]
- Official methods of analysis, Association of official analytical chemists (19th edition). Washington, DC, USA: Association of Official Analytical Chemists; 2012.
- Digestibility determination in fish using chromic oxide marking and analysis of contents from different segments of the gastrointestinal tract. Aquacult.. 1978;13(3):265-272.
- [Google Scholar]
- The effect of lactic acid bacteria administration on growth, digestive enzyme activity and gut microbiota in Persian sturgeon (Acipenser persicus) and beluga (Huso huso) fry. Aquacult. Nutr.. 2011;17:488-497.
- [CrossRef] [Google Scholar]
- Length - Weight Relationship and Diet of African Carp Labeo ogunensis (Boulenger, 1910) in Asejire Lake Southwestern Nigeria. J. Fish. Aquat. Sci.. 2011;6(4):472-478.
- [Google Scholar]
- Growth, Survival and Gut Microbial Load of Rainbow Trout (Onchorhynchus mykiss) Fry given Diet Supplemented with Probiotic during the Two Months of First Feeding. Turk. J. Fish. Aquat. Sci.. 2008;8:43-48.
- [Google Scholar]
- Microbiological applications. Wm. C: Brown Publishers, Dubuque, USA; 1994.
- Influence of probiotic (Streptococcus faecium M74) on growth and content of intestinal microflora in carp (Cyprinus carpio) J. Anim. Sci.. 1998;43:231-235.
- [Google Scholar]
- Probiotic bacteria effects on growth and bacterial composition of black tiger shrimp (Penaus monodon) Aquacult. Nutr.. 2011;17(6):634-644.
- [Google Scholar]
- Growth. In: Schreck C.A., ed. Methods for fish biology. Bethesda, M.D., USA: American Fisheries Society; 1990. p. :363-387.
- [Google Scholar]
- Microbiological upgradation of formulated fish feed. Proc. Pakistan Cong. Zool.. 2006;26:43-73.
- [Google Scholar]
- Influence of a probiotic Pseudomonas pseudoalcaligenes fermented feed on growth performance of rohu (Labeo rohita) fingerlings. Punjab Univ. J. Zool.. 2007;22(1–2):41-56.
- [Google Scholar]
- Comparative study of biochemical parameters in response to stress in Oreochromis aureus, O. mossambicus and two strains of O. niloticus. Aquacult. Res.. 2004;35(15):1434-1440.
- [Google Scholar]
- Colllins and Lyne’s microbiological methods. Oxford, UK: Butterworth-Heinemann Ltd.; 1995.
- Colorimetirc method for determination of sugars and related substances. Anal. Chem.. 1956;28(3):250-356.
- [Google Scholar]
- Eid, A., Mohamed, K.A., 2008. Effect of using probiotic as growth promoter in commercial diets for monosex Nile tilapia (Oreochromis niloticus) fingerlings, 8th International Symposium on Tilapia in Aquaculture, Cairo, Egypt, pp. 241 – 253. (ISBN: 978–1–888807–18–9).
- Growth rate, feed conversion ratio and body composition of Catla catla, Labeo rohita and Cirrhinus mrigala fry fed diets of various sources. J. World Aquacult. Soc.. 1998;28(1):84-91.
- [Google Scholar]
- Effect of different dietary probiotics on growth, feed utilization and digestive enzymes activities of Nile Tilapia. Oreochromis niloticus. J. Arab. Aquacult. Soc.. 2010;5(2):143-162.
- [Google Scholar]
- The Investigation of Lactobacillus Acidophilus as Probiotic on Growth Performance and Disease Resistance of Rainbow Trout (Oncorhyncus mykiss) Am. Eurasian J. Sci. Res.. 2011;6(1):32-38.
- [Google Scholar]
- Plasma enzymes in C. gariepinus exposed to chronic levels of roundup (glyphosate) Environ. Ecol.. 2005;23:271-276.
- [Google Scholar]
- Garriques, D., Arevalo, G., 1995. An evaluation of the production and use of a live bacterial isolate to manipulate the microbial flora in the commercial production of Penaeus vannamei postlarvae in Educator, In: Browdy, C.L., Hopkins, J.S. (Eds.), Swimming through troubled water, Proceedings of the Special Season on Shrimp Farming, Aquaculture 1995, World Aquaculture Society, Baton Rouge, La, pp. 53 – 59.
- Gatesoupe, F.J., 2008. Updating the Importance of Lactic Acid Bacteria in Fish Farming: Natural Occurrence and Probiotic Treatments. JMMB. 14(1-3), 107 –14.
- Supplementation of an isolated fish gut bacterium, Bacillus circulans, in formulated diets for rohu, Labeo rohita, fingerlings. Isr. J. Aquacult-Bamidgeh.. 2003;55(1):13-21.
- [Google Scholar]
- Probiotic effect of lactic acid bacteria in the feed on growth and survival of fry of Atlantic cod (Gadus morhua) Hydrobiologia.. 1997;352:279-285.
- [Google Scholar]
- Selection of probiotic bacteria and study of their immunostimulatory effect in Panaeus vannamei. Aquacult.. 2004;223:1-14.
- [Google Scholar]
- Fish Nutrition. New York: Academic Press Inc; 1972.
- Effect of synbiotics between Bacillus licheniformis and yeast extract on growth, hematological and biochemical indices of the Nile tilapia (Oreochromis niloticus) Egypt. J. Aquat. Res.. 2014;40(2):199-208.
- [Google Scholar]
- Production of Manganese peroxidase and organic acids and mineralization of C14-labelled lignin (C14-DHP) during solid state fermentation of wheat straw with the white rot fungus Nematoloma frowardii. Appl. Environ. Microbiol.. 1999;65:1864-1870.
- [Google Scholar]
- Effect of temperature on in vitro adhesion of potential fish probiotics. Microb. Ecol. Health Dis.. 2004;16(4):222-227.
- [Google Scholar]
- Condition factor as an indicator of growth and feeding intensity of Nile Tilapia fingerlings (Oreochromis niloticus) feed on different levels of maltose. Am. Eurasian J. Agric. Environ. Sci.. 2011;11(4):559-563.
- [Google Scholar]
- Aquaculture Development in Pakistan. In: Joseph M.M., ed. Aquaculture in Asia. India: Asian Fish Society; 1990. p. :291-301.
- [Google Scholar]
- Comparative evaluation of growth and survival of Indian major carps and exotic carps in raising fingerlings. J. Aquacult. Trop.. 1998;13(2):143-149.
- [Google Scholar]
- Protein and nucleic acid concentration in the muscle of the catfish, Clarias batrachus fed at different protein levels. Asian Fish. Sci.. 1991;4:75-84.
- [Google Scholar]
- Estimation of plasma phosphatase by determination of hydrolyzed phenol with amino antipyrene. J. clin. Pathol.. 1954;7:322-326.
- [Google Scholar]
- The role of probiotics in aquaculture in Nigeria– a review. Can. J. Fish. Aquat. Sci.. 2011;5(1):8-15.
- [Google Scholar]
- Spiritualizing effect of probiotic and spirulina on growth and biochemical performance in common carp (Catla catla) Int. J. Zool. Res.. 2013;3(3):27-31.
- [Google Scholar]
- Genotoxic and mutagenic assessment of hexavalent chromium in fish following in vivo chronic exposure. Hum. Ecol. Risk Assess.. 2012;18(4):855-870.
- [Google Scholar]
- Effect of combined copper, zinc, chromium, and selenium by orthogonal array design on alkaline phosphatase activity in liver of the red sea bream, Chrysophrys major. Aquacult.. 1995;131(3-4):219-230.
- [Google Scholar]
- Effect of the inclusion of a bacterial mix (Streptococcus faecium and Lactobacillus acidophilus), and the yeast (Saccharomyces cerevisiae) on growth, feed utilization and intestinal enzymatic activity of Nile tilapia (Oreochromis niloticus) Int. J. Fish. Aquacult.. 2010;2(4):93-101.
- [Google Scholar]
- Use of the bacteria Streptococcus faecium and Lactobacillus acidophilus, and the yeast Saccharomyces cerevisiae as growth promoters in Nile tilapia (Oreochromis niloticus) Aquacult.. 2003;216(1-4):193-201.
- [Google Scholar]
- Assessment of tolerant sunfish populations (Lepomis spp.) inhabiting selenium-laden coal ash effluent. 2. Tissue biochemistry evaluation. Ecotoxicol. Environ. Safety.. 2001;50:217-224.
- [Google Scholar]
- Effect of bacterial population on the growth of a prawn larva, Penaeus monodon. Bull. Natl. Res. Inst. Aquacult.. 1992;21:25-29.
- [Google Scholar]
- Marzouk, M.S. Moustafa, M.M., Mohamed, N.M., 2008. The influence of some probiotics on the growth performance and intestinal microbial flora of Oreochromis niloticus, In: Proceedings of 8th International Symposium on Tilapia in Aquaculture. Cairo, Egypt, pp. 1059–1071.
- Merk, 1996 – 1997. Microbiology manual, Merk Kgat., Darmstadt, Germany.
- Feeding of European seabass (Dicentrarchus labrax) juveniles on diets containing probiotics. In: Kanshik S.T., Linguct P., eds. Fish nutrition in practice. Paris: France; 1993. p. :429-432.
- [Google Scholar]
- Control of luminous Vibrio species in penaeid aquaculture ponds. Aquacult.. 1998;164(1-4):351-358.
- [Google Scholar]
- Water quality affects SDH activity, protein content and RNA: DNA ratios in fish (Catla catla, Labeo rohita and Oreochromis mossambicus) raised in ponds of a sewage–fed fish farm. Aquacult.. 2007;262(1):105-119.
- [Google Scholar]
- Dietary prebiotics and probiotics influence the growth performance, feed utilization, and body indices of Snakehead (Channa striata) fingerlings. Trop. Life Sci. Res. (TLSR). 2016;27(2):111-125.
- [Google Scholar]
- Characterization of the properties of human- and dairy-derived probiotics for prevention of infectious diseases in fish. Appl. Environ. Microbiol.. 2001;67(6):2430-2435.
- [Google Scholar]
- Influence of insecticidal derivative (Cartap Hydrochloride) from the marine polychaete on certain enzyme systems of the freshwater fish Oreochromis mossambicus. J. Environ. Biol.. 2005;26:191-196.
- [Google Scholar]
- Microbiology; concepts and applications. New York, USA: McGraw-Hill Inc; 1986.
- Action of cypermetrhin on tissue transamination during nitrogen metabolism in Cyprinus carpio. Ecotoxicol. Environ. Safety.. 1996;34(2):174-179.
- [Google Scholar]
- Ray, A.K., Ghosh, K., Ringo, E., 2012. Enzyme-producing bacteria isolated from fish gut: A review. Aquacult. Nutr. 18, 465 – 492.
- Lahore-Absolutely Fishy: Nutritional Value, the Review. Lahore, Pakistan: Dawn; 2006. p. :12-13.
- Evaluation of Bacillus amyloliquefaciens on the growth performance, intestinal morphology, hematology and body composition of Nile tilapia, Oreochromis niloticus. Aquacult. Int.. 2015;23(1):203-217.
- [Google Scholar]
- A colorimetric method for the determination of serum glutamate oxaloacetate and glutamate pyruvate transaminase. Am. J. Clin. Pathol.. 1957;28:56-63.
- [Google Scholar]
- Effect of probiotic bacterium on black tiger shrimp, Penaeus monodon, survival and growth. Aquacult.. 1998;167:301-313.
- [Google Scholar]
- Changes in total protein and transaminase activities of grass carp exposed to diquat. J. Aquat. Anim. Res.. 1993;5(4):280-286.
- [CrossRef] [Google Scholar]
- Spore formers as human probiotics: Bacillus, Sporolactobacillus and Brevibacillus. Compr. Rev. Food Sci. F.. 2003;2(3):101-110.
- [Google Scholar]
- A Textbook of Fish and Fisheries. New Delhi, India: Dominant Publishers and Distributors; 2005. p. :39-40.
- Effects of dietary mannan oligosaccharide on the survival, growth, immunity and digestive enzyme activity of freshwater crayfish, Cherax destructor Clark (1936) Aquacult. Nutr.. 2011;17(2):629-635.
- [CrossRef] [Google Scholar]
- Determination of nucleic acids in tissues by pentose analysis. In: Colowick S.P., Kaplan N.O., eds. Methods in enzymology 3. New York, USA: Academic Press; 1957. p. :680-684.
- [Google Scholar]
- Enrichment of Artemia nauplii with Lactobacillus sporogenes for enhancing the survival, growth and levels of biochemical constituents in the post-larvae of the freshwater prawn Macrobrachium rosenbergii. Turk. J. Fish. Sci.. 2012;12:23-31.
- [Google Scholar]
- Effect of Saccharomyces cerevisiae on survival, growth, biochemical constituents and energy utilization in the prawn Macrobrachium rosenbergii. Int. J. Appl. Biol. Pharm.. 2013;4:39-47.
- [Google Scholar]
- Effect of probiotics (Binifit TM) on survival, growth, biochemical constituents and energy budget of the freshwater prawn Macrobrachium rosenbergii post larvae. Aquacult. Elixir Int. J.. 2011;41:5919-5927.
- [Google Scholar]
- Studies on the liver of chicken Gallus domesticus I, liver growth and nucleic acid contents. Pak. J. Zool.. 1973;5:111-117.
- [Google Scholar]
- Haemato-biochemical and hepatic changes in Labeo rohita fingerlings exposed to multiple stressors of crowding and feed deprivation. Int. J. Pure Appl. Biosci. (IJPAB). 2017;5(5):617-628.
- [CrossRef] [Google Scholar]
- RNA–DNA ratio in scales from juvenile cod provides a nonlethal measure of feeding condition. Trans. Am. Fish. Soc.. 2003;132(1):9-17.
- [Google Scholar]
- Effect of probiotics and some spices as feed additives on the performance and behavior of Nile tilapia, Oreochromis niloticus. Egypt. J. Aquat. Biol. Fish.. 2008;12(2):63-80.
- [Google Scholar]
- α amylase measurement of reducing groups. In: Bergmeyer H.V., ed. Methods of Enzymatic Aalysis (2nd Ed). USA: Academic Press, New York; 1974.
- [Google Scholar]
- Lactobacillus sp. bacteria as probiotics in Gilthead Sea Bream (Sparus aurata, l.) Larvae: Effects on growth performance and digestive enzyme activities. Aquacult.. 2008;280(1–4):140-145.
- [Google Scholar]
- United States Agency for International Development (USAID), 2011. Feed conversion ratio. Technical Bulletin 07, Phnom Penh, USAID, Cambodia.
- Bacillus velezensis is a later heterotypic synonym of Bacillus amyloliquefaciens. Int. J. Syst. Evol. Microbiol.. 2008;58(3):671-675.
- [Google Scholar]
- Cross effects of the strain of dietary Saccharomyces cerevisiae and rearing conditions on the onset of intestinal microbiota and digestive enzymes in rainbow trout, Onchorhynchus mykiss, fry. Aquacult.. 2006;258(1-4):470-478.
- [Google Scholar]
- Snakeheads – their biology and culture. In: Muir J.F., Roberts R.J., eds. Recent advances in aquaculture. London: Croom Helm; 1982. p. :181-213.
- [Google Scholar]
- Identification of unusual pathogenic gram-negative aerobic and facultative anaerobic bacteria (2nd Edition). London, UK: Williams and Wilkins; 1996.
- Effect of prebiotic konjac mannan oligosaccharide on growth performances, intestinal microflora, and digestive enzyme activities in yellow catfish. Pelteobagrus fulvidraco. Fish Physiol. Biochem.. 2014;40(3):763-771.
- [CrossRef] [Google Scholar]
- Effects of dietary fructooligosaccharide on digestive enzyme activities, intestinal microflora and morphology of male broilers. Poult. Sci.. 2003;82(6):1030-1036.
- [CrossRef] [Google Scholar]
- Effect of probiotics for common carp (Cyprinus carpio) based on growth performance and digestive enzyme activities. Anim. Feed Sci. Tech.. 2006;127(3–4):283-292.
- [CrossRef] [Google Scholar]
- Activities of superoxide dismutase and catalase in erythrocyte and plasma transaminases of goldfish (Carassius auratus gibelio Bloch.) exposed to cadmium. Physiol. Res.. 2001;50:105-111.
- [Google Scholar]
- Micro determination of lipids by the sulphophosphovanillin reaction. Z. Ges. Exp. Med.. 1962;135:545-561.
- [Google Scholar]


