

Translate this page into:
Impact of acidified carbon on maize growth, yield and grains nutrients concentration under normal irrigation and osmotic stress
⁎Corresponding authors. rahisenior2005@gmail.com (Ashfaq Ahmad Rahi), sd96850@gmail.com (Subhan Danish)
-
Received: ,
Accepted: ,
This article was originally published by Elsevier and was migrated to Scientific Scholar after the change of Publisher.
Peer review under responsibility of King Saud University.
Abstract
Osmotic stress is a major hurdle to the optimization of maize productivity. Limited availability of what the decrease the maize productivity due to alteration in metabolic activities. It also decreases the uptake of essential nutrients in the plants which resulted in limited photosynthetic activities. Such conditions resulted in poor plant growth and productivity. To overcome this critical issue, most scientists suggest incorporating organic amendments in the soil. These days incorporation of acidified carbon (AC) is becoming popular for the alleviation of abiotic stresses in crops. It can not only improve soil physicochemical properties but also increases the bioavailability of nutrients to plants. That's why the current study was conducted to explore the best application rate of AC for maize under osmotic stress. There were application rates of AC i.e., 0, 0.75, and 1.50% applied under 70, 50, and 30% field capacity (FC). Results showed that shoot (47.14 and 82.60%) and root length (32.19 and 69.76%), shoot fresh (102.40 and 135.22%) and dry weight (77.19 and 121.51%), root fresh (82.82 and 104.42%) and dry weight (59.17 and 80.30%) were significantly enhanced in maize by application of 0.75 and 1.50% AC under 30% FC. A significant decrease in the electrolyte leakage also validated the effectiveness of 0.75 and 1.50% AC for alleviation of osmotic stress in maize. In conclusion, 0.75 and 1.50% AC are effective in the improvement of maize growth and yield attributes in maize. More investigations are suggested at the field level to declare 1.50% AC as the best treatment for alleviation of osmotic stress.
Keywords
Organic amendment
Water stress
Cereal
Growth attributes
Yield attributes

1 Introduction
Maize (Zea mays L.) is an important food, feed, and fuel crop around the world. Its grain production has expanded more than eightfold in the last century, reaching one billion tonnes per year globally. It is the most widely cultivated tropical crop throughout the world. Its origin has long been a source of contention. In terms of area and productivity, maize (Zea mays L.) is the world's third most significant cereal crop after wheat and rice. It also has value in poultry and cattle production (Shafiq-ur-Rehman et al., 2008). Furthermore, maize provides a variety of health advantages i.e., B-complex vitamins, which are beneficial to the skin, hair, heart, brain, and digestion. Because the population will grow to 9 billion people by 2050, 70% more food will be required than is consumed today. Maize is expected to account for more than half of the rise in cereal demand in the future (FAO, 2009).
Tropical maize production accounts for around 30% of global maize production, with tropically adapted germplasm accounting for 49% of global maize planted area. Maize is cultivated on 1.11 million hectares in Pakistan, with 3.62 tons/ha average grain yield. However, the maize crop faces several problems during its growth period, unbalanced nutrition and less availability of irrigation are two of the most important factors contributing to low maize yield (Othmani et al., 2021).
Nitrogen, as an essential ingredient, is critical to crop development and final grain output (Rafiq et al., 2010). This element's deficit has been identified as one of the most significant yield-limiting variables in cereal production. Low-rate nitrogen application lowered grain production by 43–74% and plant number by 33–65% (D’Andrea et al., 2006). With an increase in nitrogen rate, yield and protein concentration in maize seed rose. Higher plant densities boosted the efficiency of applied nitrogen to maize crops. Grain production in maize is also increased when plant density increased with the N rate (Toler et al., 1999).
Furthermore, limited water uptake in the plants also played a major role in decreasing the yield of crops. Climatic models have already predicted that the severity and intensity of osmotic stress will be enhanced over time (IPCC, 2007). In arid areas, low rainfall and the high evaporation of water due to high temperature are major causes of the development of drought situation. Plants usually lose turgor under limited water uptake which resulted in the impairment of enzymes and disturbance in phenology (Zeiger and Taiz, 2010). It also affects the uptake of macronutrients i.e., N, P, and K, which usually become deficient in osmotic stress in the plants. A significant disturbance in the biochemical attributes of plants under osmotic stress also acts as an allied factor for the reduction in crop production (Anjum et al., 2008).
Organic supplements (Brtnicky et al., 2021; Hashmi et al., 2019), such as acidified carbon (AC) have recently been proposed as a means of enhancing crop productivity in a variety of soils, including heavy metals toxic soils. Biochar is a natural and eco-friendly soil amendment since it is resistant to microbial breakdown and performs these functions for a longer period of time (Hardy et al., 2019). Biochar can aid with soil acidity remediation in a variety of ways. The carboxylic and phenolic functional groups on the surface of biochar can aid to buffer soil pH, while the biochar's intrinsic basic cations can also help to reduce soil pH (Ahmed et al., 2022). The second effect may be transient, whereas the former effect will grow stronger over time (Mia et al., 2017).
Acidified carbon can also promote soil microbial processes, which aids in the acquisition of nutrients under acidic conditions (Xu et al., 2014). In one field investigation, applying paddy straw-derived biochar to sandy soil raised the soil pH by 4.5 units compared to the control (El-Naggar et al., 2018). The maize crop has a high yield potential and responds well to various management approaches, such as adding AC to the soil and soil conditioning (Iqbal et al., 2021).
With these issues in mind, the current experiment was designed to consider maize as a test crop for providing potential benefits to the growers. The study is covering the knowledge gap with novelty regarding the use of AC in maize crops under osmotic stress. The study aimed to examine the impact of acidified different application rates on maize growth and yield under osmotic stress. It is hypothesized that the addition of acidified carbon might have the potential to improve the growth, yield, and nutrient concentration of maize when cultivated under osmotic stress.
2 Material and methods
2.1 Experimental site and design
A pot study was done in the research area of Pesticide Quality Control Laboratory Multan. The design of the study was a completely randomized design (CRD). Treatments were applied in 2 factorial arrangements of treatment were made i.e., drought levels and AC.
2.2 Acidified carbon
For the manufacturing of AC modified methods of Sultan et al. (2020) was adopted. For pH and EC characterization of AC, deionized water and AC were mixed in a 20:1 ratio (Shi et al., 2017). Digestion of AC was done by di-acid mixture HNO3:HClO4 (2:1 ratio) at 280 °C on the hot plate. Phosphorus was assessed in AC via the yellow colour method on a spectrophotometer (Chapman and Pratt, 1961). Potassium, calcium and sodium were determined in digested material by a PFP-7 flamephotometer (Donald and Hanson, 1998). For examining total N in AC, Kjeldhal’s distillation was carried out for (Bremner, 1996). Ash content (AC) and volatile matter (VM) in AC were analyzed by heating at 550 °C and 450 °C respectively in a muffle furnace (Danish et al., 2019). For fixed carbon Noor et al. (2012) equation was used
The characteristic of AC is provided in Table 1. VM (volatile matter); AC (ash contents); FC (Fixed carbon); TN (total nitrogen); TP (total phosphorus); TK (total potassium); TNa (total sodium); TCa (total calcium); EC (electrical conductivity);
Acidified Carbon
Soil
Parameters
Units
Values
Parameters
Units
Normal
pH
–
6.65
Sand
%
30
EC
dS/m
3.05
Clay
%
40
VM
%
13
Silt
%
30
AC
%
30
Texture
–
Clay Loam
FC
%
57
pHs
–
8.29
TN
%
0.47
ECe
dS/m
3.15
TP
%
0.11
OM
%
0.54
TK
%
1.21
TN
%
0.025
TNa
%
0.10
Extractable P
mg kg−1
4.21
TCa
%
0.13
Extractable K
mg kg−1
101
2.3 Drought stress and soil characterization
The drought stress was maintained based on soil field capacity (FC). For control, normal irrigation was provided at the rate of 70%FC (70FC). Mild drought stress was applied by minimizing the irrigation water to maintain the FC of 50% (50FC). For severe drought stress, 30%FC was maintained by irrigation water (Danish and Zafar-ul-Hye, 2019).
Assessment of soil separates sand, silt and clay was made using hydrometer. Finally, USDA textural triangle was followed for computation of soil texture (Gee and Bauder, 1986). Soil EC and pH were determined by making 1:10 and 1:1 w/v ratio mixture of soil and deionized water. Soil organic matter was assessed via ferrous ammonium sulfate and potassium dichromate (Sparks et al., 1996). Soil available P was examined on spectrophotometer at 880 nm using Olsen extracting solution (Kuo, 1996). However, soil available K was analyzed on flame photometer by using ammonium acetate as extracting reagent (Donald and Hanson, 1998).
2.4 Treatment plan and NBC application
A total of nine treatments was applied with 3 replications. The treatments include control (No AC) + normal soil irrigation (70FC), 70FC + 0.75%AC, 70FC + 1.50%AC, mild drought stress (50FC), 50FC + 0.75AC, 50FC + 1.50AC, severe drought stress (30FC), 30FC + 0.75AC and 30FC + 1.50AC. On a w/w basis, AC was applied in the soil as per the treatment plan manually.
2.5 Irrigation water characteristics
The characteristics of tap water were pH (7.12), EC (0.54 dS/m), carbonates (0.00 meq./L), bicarbonates (5.17 meq./L), chlorides (0.10 meq./L) and Ca + Mg (1.21 meq./L) (Estefan et al., 2013).
2.6 Seeds collection and sowing
Healthy maize seeds YH 1898 were selected on visual and manual basis. Initially five seeds were sown in each pot. Later after germination, thinning was done and 2 seedlings were maintained per pot.
2.7 Fertilizer application
Nitrogen was added at the rate of 227.24 kg ha−1 in three separates. At the time of sowing, phosphorus and potassium were added at the rate of 143.26 kg ha−1 and 91.93 kg ha−1 (Saboor et al., 2021).
2.8 Data collection
At vegetative maturity plants were harvested. Shoot and root length, shoot fresh and dry weight, root fresh and dry weight were examined soon after harvesting. For dry weight analysis, samples were oven-dried at 65 °C for 48 h.
2.9 Gas exchange attributes
An IRGA (infrared gas analyzer) was utilized for the determination of photosynthetic rate (Pn), stomatal conductance (gs) and transpiration rate (E) (Danish and Zafar-ul-Hye, 2019; Saboor et al., 2021).
2.10 Chlorophyll contents
For analyses of chlorophyll contents, 80% acetone was used. Final calculations were made using following equations (Arnon, 1949).
2.11 Electrolyte leakage
Electrolyte leakage (EL) was measured using the method by Lutts et al. (1996).
2.12 Statistical analysis
All the data was sorted out using standard statistical procedures (Steel et al., 1997). Two factorial ANOVA and Fisher's LSD were applied for the comparison of treatments. Origin2022Pro software was used for making paired comparison graphs (OriginLab Corporation, 2021).
3 Results
3.1 Shoot length and root length
Results showed that the effects of AC application rates and variable levels of irrigation water were significant on the shoot length of maize. A significant increase in shoot length was noted where 1.50AC and 0.75AC were applied under normal irrigation (70FC), mild drought (50FC) and severe drought (30FC) compared to control (0AC). Treatment 1.50AC performance significantly better for improvement in shoot length than 0.75AC under 70FC, 50FC and 30FC (Fig. 1A). A maximum increase of 20.65, 26.71, and 47.14% in shoot length was noted in 0.75AC over 0AC under 70, 50, and 30FC respectively. Similarly, the addition of 1.50AC caused a maximum significant increase (96.13, 69.22, and 82.60%) in shoot length than 0AC under 70, 50, and 30FC respectively. Fig. 1B is elaborating on the interaction of variables under AC application rates and variable levels of irrigation water for shoot length.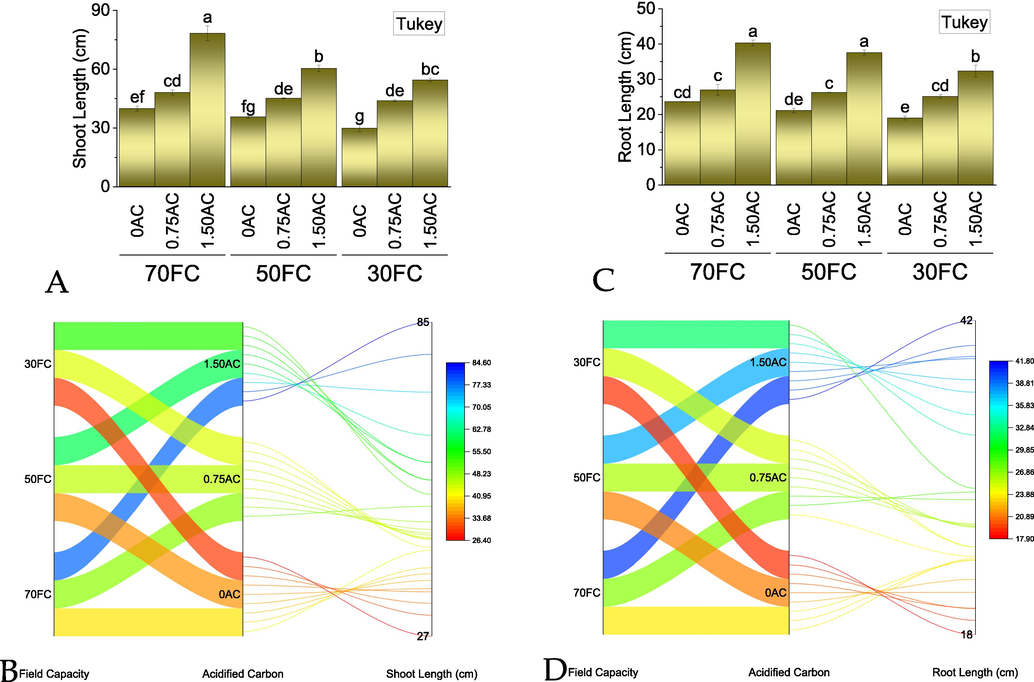
Effect of AC application rates on shoot (A) and root length (C) of maize grown under normal, mild, and severe drought stress. Bars are means of 3 replicates ± SE. Variable letters on bars are showing significant changes (Tukey test; p ≤ 0.05). A parallel plot is showing the interaction of variables for shoot and root length of maize grown under normal, mild, and severe drought stress. The color scheme is showing the data range for shoot (B) and root length (D) affected by treatments. AC = acidified carbon; FC = Field capacity; AC = acidified carbon; FC = Field capacity.
It was noted that the impacts of AC application rates and variable levels of irrigation water were significant on the root length of maize. A significant enhancement in root length was observed where 1.50AC and 0.75AC were added under mild drought (50FC) and severe drought (30FC) over control (0AC). Treatment 1.50AC differed significantly better for increase in root length than 0.75AC under 70FC, 50FC and 30FC (Fig. 1C). The maximum increase of 13.95, 24.39, and 32.19% in root length was noted in 0.75AC over 0AC under 70, 50, and 30FC respectively. Similarly, the addition of 1.50AC caused a maximum significant increase (70.09, 77.58, and 69.76%) in root length than 0AC under 70, 50, and 30FC respectively. Fig. 1D is elaborating on the interaction of variables under AC application rates and variable levels of irrigation water for root length.
3.2 Shoot fresh and dry weight
The influence of AC application rates and variable levels of irrigation water was significant on the shoot fresh weight of maize. A significant increase in shoot fresh weight was observed where 1.50AC and 0.75AC were incorporated under 70FC, 50FC, and 30FC than control (0AC). Application of 1.50AC remained significantly better for improvement in shoot fresh weight than 0.75AC under 70FC, 50FC, and 30FC (Fig. 2A). A maximum increase of 23.79, 46.13, and 102.40% in shoot fresh weight was noted in 0.75AC over 0AC under 70, 50, and 30FC respectively. Similarly, the addition of 1.50AC caused a maximum significant increase (78.46, 70.67, and 135.22%) in shoot fresh weight than 0AC under 70, 50, and 30FC respectively. Fig. 2B is elaborating on the interaction of variables under AC application rates and variable levels of irrigation water for shoot fresh weight.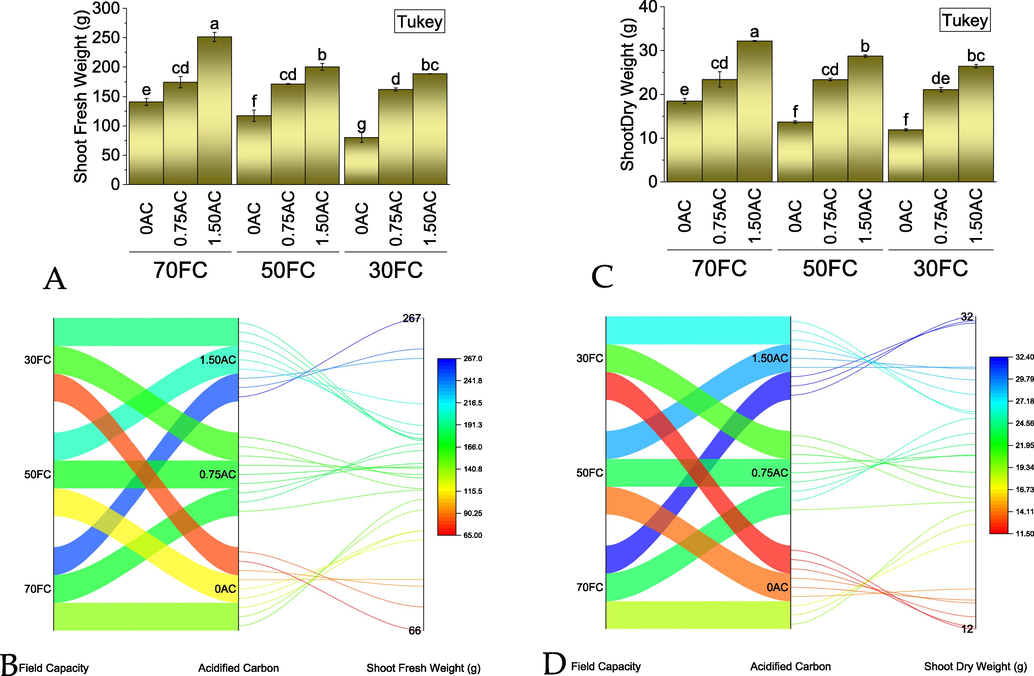
Effect of AC application rates on shoot fresh (A) and dry (C) weight of maize grown under normal, mild, and severe drought stress. Bars are means of 3 replicates ± SE. Variable letters on bars are showing significant changes (Tukey test; p ≤ 0.05). A parallel plot is showing the interaction of variables for shoot fresh (C) and dry (D) weight of maize grown under normal, mild, and severe drought stress. The color scheme is showing the data range for shoot fresh weight affected by treatments. AC = acidified carbon; FC = Field capacity.
A significant enhancement in shoot dry weight was noted in 1.50AC and 0.75AC under 70FC, 50FC and 30FC over control (0AC). Application of 1.50AC was significantly better for an increase in shoot dry weight compared to 0.75AC under 70FC, 50FC, and 30FC (Fig. 2C). A maximum increase of 26.62, 70.83, and 77.19% in shoot dry weight was noted in 0.75AC over 0AC under 70, 50, and 30FC respectively. Similarly, the addition of 1.50AC caused a maximum significant increase (73.92, 109.60, and 121.51%) in shoot dry weight than 0AC under 70, 50, and 30FC respectively. Fig. 2D is elaborating on the interaction of variables under AC application rates and variable levels of irrigation water for shoot dry weight.
3.3 Root fresh and dry weight
Significant changes in root fresh weight were noted under the application of AC application rates and variable levels of irrigation water. Treatments 1.50AC and 0.75AC caused significant improvement in root fresh weight under 70FC, 50FC and 30FC compared to control (0AC). Application of 1.50AC caused a significant increase in root fresh weight compared to 0.75AC under 70FC and 50FC (Fig. 3A). The maximum increase of 14.42, 29.29, and 82.82% in root fresh weight was noted in 0.75AC over 0AC under 70, 50, and 30FC respectively. Similarly, the addition of 1.50AC caused a maximum significant increase (53.34, 49.51, and 104.42%) in root fresh weight than 0AC under 70, 50, and 30FC respectively. Fig. 3B is elaborating on the interaction of variables under application rates and variable levels of irrigation water for root fresh weight.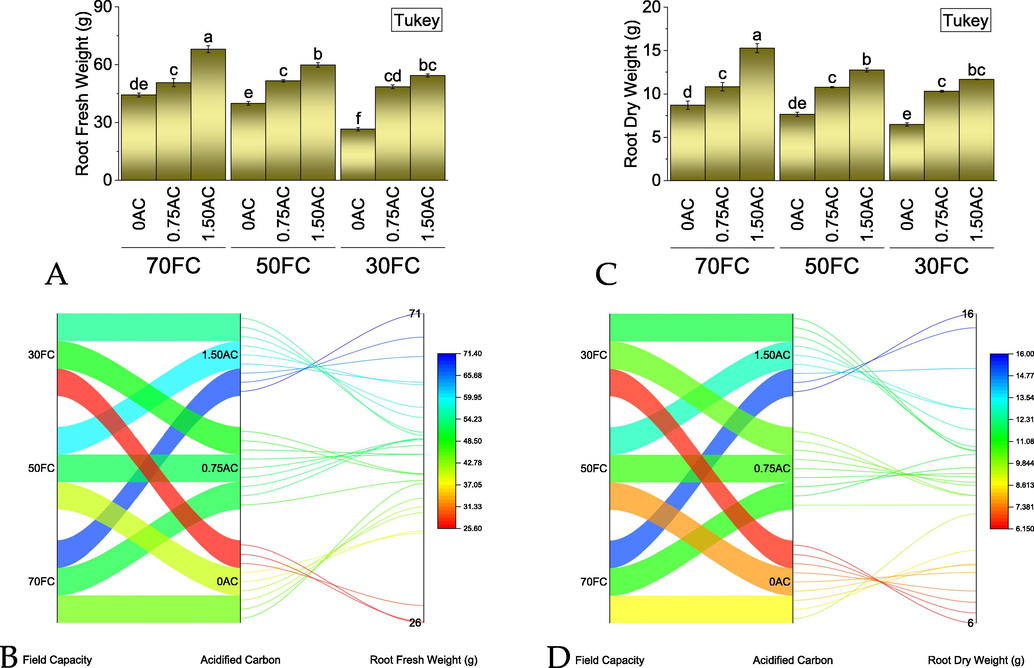
Effect of AC application rates on root fresh (A) and dry (C) weight of maize grown under normal, mild, and severe drought stress. Bars are means of 3 replicates ± SE. Variable letters on bars are showing significant changes (Tukey test; p ≤ 0.05). A parallel plot is showing the interaction of variables for root fresh weight of maize grown under normal, mild, and severe drought stress. The color scheme is showing the data range for root fresh (C) and dry (D) weight affected by treatments. AC = acidified carbon; FC = Field capacity.
Significant changes in root dry weight were observed under the application of AC application rates and variable levels of irrigation water. Treatments 1.50AC and 0.75AC induced significant enhancement in root dry weight under 70FC, 50FC and 30FC than control (0AC). Application of 1.50AC caused significant enhancement in root dry weight over 0.75AC under 70FC and 50FC (Fig. 3C). The maximum increase of 24.53, 40.93, and 59.17% in root dry weight was noted in 0.75AC over 0AC under 70, 50, and 30FC respectively. Similarly, the addition of 1.50AC caused a maximum significant increase (75.27, 66.42, and 80.30%) in root dry weight than 0AC under 70, 50, and 30FC respectively. Fig. 3D is elaborating on the interaction of variables under AC application rates and variable levels of irrigation water for root dry weight.
3.4 Grains yield
The use of AC at various application rates as amendment significantly influenced grain yield under the variable level of irrigation water. A significant enhancement in grains yield under 70FC, 50FC and 30FC confirmed the usefulness of 1.50AC and 0.75AC than control (0AC). It was observed that 1.50AC differed significantly best than 0.75AC and 0AC under 30FC, 50FC, and 70FC for an increase in grain yield. Furthermore, 0.75AC also caused significant improvement in grains yield compared to 0AC under 70FC, 50FC and 30FC (Fig. 4A). Maximum enhancement of 10.65, 17.33, and 9.72% in grains yield was noted in 0.75AC over 0AC under 70, 50, and 30FC respectively. Similarly, the addition of 1.50AC caused maximum significant enhancement (18.21, 25.56, and 22.87%) in grains yield compared to 0AC under 70, 50, and 30FC respectively. Fig. 4B is elaborating on the interaction of variables under AC application rates and variable levels of irrigation water for grain yield.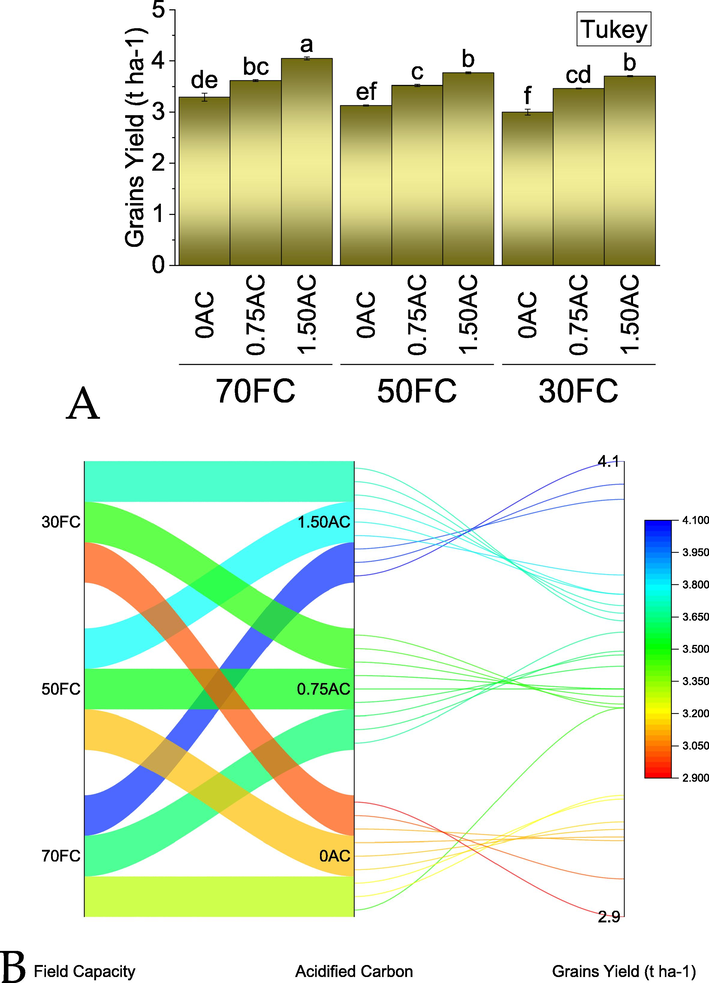
Effect of AC application rates on grains yield of maize leaves grown under normal, mild, and severe drought stress. Bars are means of 3 replicates ± SE. Variable letters on bars are showing significant changes (Tukey test; p ≤ 0.05). A parallel plot is showing the interaction of variables for grain yield of maize grown under normal, mild, and severe drought stress. The color scheme is showing the data range for grain yield affected by treatments (B). AC = acidified carbon; FC = Field capacity.
3.5 Grains nitrogen
Application of AC at different rates significantly influenced grain's nitrogen concentration under different levels of irrigation water. A significant enhancement in grains nitrogen concentration under 70FC, 50FC and 30FC confirmed the usefulness of 1.50AC compared to control (0AC). It was also noted that 1.50AC differed significantly best than 0.75AC and 0AC under 50FC and 70FC for improvement in grains nitrogen concentration. Furthermore, 0.75AC also did not cause significant improvement in grains nitrogen concentration compared to 0AC under 70FC, 50FC and 30FC (Fig. 5A). Maximum enhancement of 6.30, 6.15 and 3.58% in grains nitrogen concentration was noted in 0.75AC over 0AC under 70, 50 and 30FC respectively. Similarly, addition of 1.50AC caused maximum significant enhancement (14.59, 16.31 and 21.44%) in grains nitrogen concentration compared to 0AC under 70, 50 and 30FC respectively. Fig. 5B is elaborating on the interaction of variables under AC application rates and variable levels of irrigation water for grain nitrogen concentration.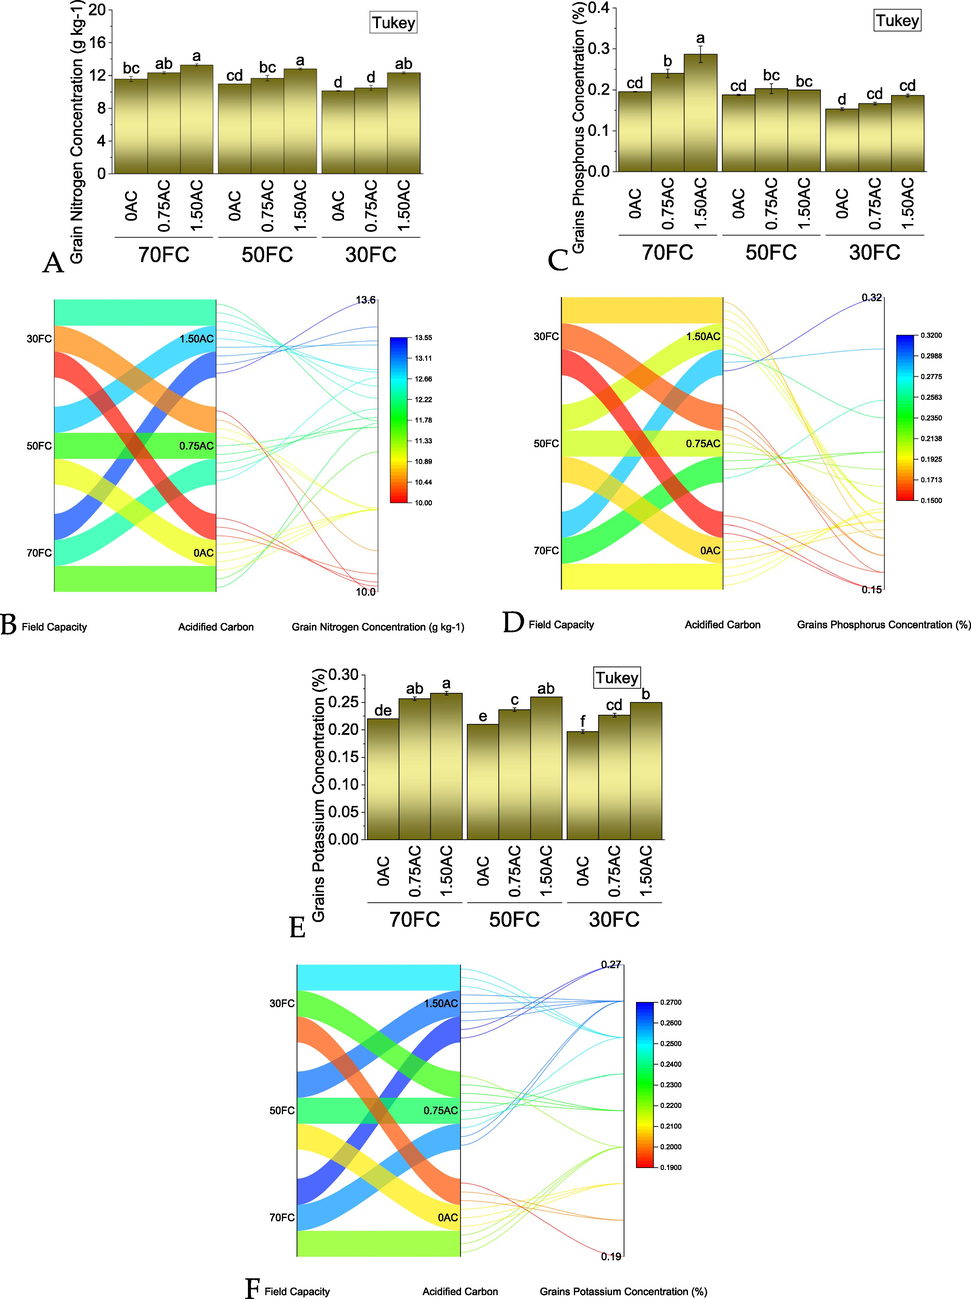
Effect of AC application rates on grains nitrogen (A), phosphorus (C) and potassium (E) concentration of maize grown under normal, mild, and severe drought stress. Bars are means of 3 replicates ± SE. Variable letters on bars are showing significant changes (Tukey test; p ≤ 0.05). A parallel plot is showing the interaction of variables for grains nitrogen (B), phosphorus (D) and potassium (F) concentration of maize grown under normal, mild, and severe drought stress. The color scheme is showing the data range for grain's nitrogen concentration affected by treatments (B). AC = acidified carbon; FC = Field capacity.
A significant increase in grains phosphorus concentration under 70FC verified the efficacy of 1.50AC compared to control (0AC). Treatment 1.50AC differed significantly best than 0.75AC and 0AC under 70FC for enhancement in grains phosphorus concentration. Furthermore, 0.75AC also did not cause significant improvement in grains phosphorus concentration over 0AC under 50FC and 30FC (Fig. 5C). Maximum enhancement of 22.66, 8.15, and 8.70% in grains phosphorus concentration were noted in 0.75AC over 0AC under 70, 50, and 30FC respectively. Similarly, addition of 1.50AC caused maximum significant enhancement (46.51, 6.38 and 21.74 %) in grains phosphorus concentration compared to 0AC under 70, 50 and 30FC respectively. Fig. 5D is elaborating on the interaction of variables under AC application rates and variable levels of irrigation water for grain's phosphorus concentration.
Grain's potassium concentration was significantly higher under 30FC, 50FC, and 70FC where 1.50AC was applied compared to control (0AC). Treatment 1.50AC was significantly better from 0.75AC and 0AC under 30FC and 50FC for increase in grains potassium concentration. Likewise, 0.75AC was significant for improvement in grains potassium concentration over 0AC under 30FC, 50FC and 30FC (Fig. 5E). Maximum enhancement of 16.67, 12.70 and 15.25% in grains potassium concentration was noted in 0.75AC over 0AC under 70, 50 and 30FC respectively. Similarly, addition of 1.50AC caused maximum significant enhancement (21.21, 23.81 and 27.12%) in grains potassium concentration compared to 0AC under 70, 50 and 30FC respectively. Fig. 5F is elaborating on the interaction of variables under AC application rates and variable levels of irrigation water for grain potassium concentration.
3.6 Chlorophyll and carotenoids contents
Significant changes in chlorophyll a were observed under the addition of AC application rates and different levels of irrigation water. Treatments 1.50AC and 0.75AC differed significantly for enhancement in chlorophyll a under 70FC, 50FC and 30FC over control (0AC). The addition of 1.50AC induced significant improvement in chlorophyll a than 0.75AC under 70FC. However, both 1.50AC and 0.75AC remained statistically similar to each other for chlorophyll a under 50FC and 30FC (Table 2). The maximum increase of 15.78, 57.60, and 55.78% in chlorophyll a were noted in 0.75AC over 0AC under 70, 50, and 30FC respectively. Similarly, the addition of 1.50AC caused a maximum significant increase (77.78, 92.85, and 84.95%) in chlorophyll a than 0AC under 70, 50, and 30FC respectively. AC = acidified carbon; FC = Field capacity.
Field Capacity
Acidified Carbon
Chlorophyll a
(mg/g)Chlorophyll b
(mg/g)Total Chlorophyll
(mg/g)Carotenoids
(mg/g)
Mean
Label
Mean
Label
Mean
Label
Mean
Label
70FC
0AC
0.58
d
0.43
d
1.02
d
0.29
ef
70FC
0.75AC
0.68
bcd
0.52
cd
1.21
cd
0.33
cd
70FC
1.50AC
1.04
a
0.79
a
1.82
a
0.43
a
50FC
0AC
0.43
e
0.32
e
0.74
e
0.26
fg
50FC
0.75AC
0.67
bcd
0.52
cd
1.17
cd
0.34
cd
50FC
1.50AC
0.82
b
0.64
b
1.47
b
0.40
ab
30FC
0AC
0.41
e
0.26
e
0.68
e
0.22
g
30FC
0.75AC
0.64
cd
0.48
cd
1.13
cd
0.32
de
30FC
1.50AC
0.75
bc
0.57
bc
1.31
bc
0.37
bc
Treatments 1.50AC and 0.75AC were significantly different for increase in chlorophyll b under 70FC, 50FC and 30FC over control (0AC). Treatment 1.50AC induced significant enhancement in chlorophyll b over 0.75AC under 50FC and 70FC. However, both 1.50AC and 0.75AC remained statistically alike each other for chlorophyll b under 30FC (Table 2). Maximum increase of 20.70, 62.44 and 83.15% in chlorophyll b was noted in 0.75AC over 0AC under 70, 50 and 30FC respectively. Similarly, addition of 1.50AC caused maximum significant increase (83.97, 102.75, 117.36%) in chlorophyll b than 0AC under 70, 50 and 30FC respectively.
Addition of 1.50AC and 0.75AC differed significantly for enhancement in total chlorophyll under 70FC, 50FC and 30FC over control (0AC). Application of 1.50AC caused a significant increase in total chlorophyll than 0.75AC under 50FC and 70FC. However, both 1.50AC and 0.75AC did not differ significantly from each other for total chlorophyll under 30FC (Table 2). The maximum increase of 18.85, 58.84, and 66.76% in total chlorophyll was noted in 0.75AC over 0AC under 70, 50, and 30FC respectively. Similarly, the addition of 1.50AC caused a maximum significant increase (78.81, 98.34, and 93.99%) in total chlorophyll over 0AC under 70, 50, and 30FC respectively.
A significant enhancement in carotenoids under 70FC, 50FC and 30FC validated the effectiveness of 1.50AC and 0.75AC over control (0AC). It was observed that 1.50AC performance was significantly best than 0.75AC and 0AC under 50FC and 70FC. On the other hand, 0.75AC also differed significantly for an increase in carotenoids than 0AC under 70FC, 50FC, and 30FC (Table 2). The maximum increase of 15.61, 32.26, and 44.22% in carotenoids was noted in 0.75AC over 0AC under 70, 50, and 30FC respectively. Similarly, the addition of 1.50AC caused a maximum significant increase (49.97, 55.77, and 66.83%) in carotenoids over 0AC under 70, 50, and 30FC respectively.
3.7 Gas exchange attributes and electrolyte leakage
A significant increase in photosynthetic rate (Pn) under 70FC, 50FC and 30FC confirmed the usefulness of 1.50AC and 0.75AC over control (0AC). It was noted that 1.50AC differed significantly best than 0.75AC and 0AC under 50FC and 70FC for enhancement in Pn. On the other hand, 0.75AC also differed significantly for increase in Pn than 0AC under 70FC, 50FC and 30FC (Table 3). Maximum increase of 9.80, 20.67 and 31.34% in Pn was noted in 0.75AC over 0AC under 70, 50 and 30FC respectively. Similarly, addition of 1.50AC caused maximum significant increase (39.52, 29.04 and 38.42%) in Pn over 0AC under 70, 50 and 30FC respectively. AC = acidified carbon; FC = Field capacity.
Field Capacity
Acidified Carbon
Photosynthetic Rate (µmol CO2 m−2 s−1)
Transpiration Rate
(mmol H2O m−2 s−1)Stomatal Conductance
(mmol CO2 m−2 s−1)Electrolyte Leakage (%)
Mean
Label
Mean
Label
Mean
Label
Mean
Label
70FC
0AC
15.12
d
2.18
de
0.10
de
22.46
def
70FC
0.75AC
16.60
bc
2.45
cd
0.10
cd
31.61
cd
70FC
1.50AC
21.09
a
3.18
a
0.12
a
62.15
a
50FC
0AC
13.75
e
2.05
ef
0.09
e
20.30
ef
50FC
0.75AC
16.59
bc
2.41
cd
0.10
bcd
31.97
cd
50FC
1.50AC
17.74
b
2.84
b
0.11
b
49.60
b
30FC
0AC
12.37
f
1.90
f
0.07
f
18.58
f
30FC
0.75AC
16.25
cd
2.31
de
0.10
cd
29.39
cde
30FC
1.50AC
17.12
bc
2.66
bc
0.11
bc
38.41
c
Field Capacity
Acidified Carbon
Soil pH
Soil EC (dS/m)
Soil Organics Matter (%)
70FC
0AC
8.55
a
3.00
b
0.42
c
70FC
0.75AC
8.36
b
3.91
a
0.92
b
70FC
1.50AC
8.18
c
3.93
a
1.13
a
50FC
0AC
8.56
a
3.02
b
0.43
c
50FC
0.75AC
8.35
b
3.88
a
0.92
b
50FC
1.50AC
8.20
c
3.98
a
1.15
a
30FC
0AC
8.54
a
3.10
b
0.45
c
30FC
0.75AC
8.33
b
3.97
a
0.95
b
30FC
1.50AC
8.23
c
3.96
a
1.15
a
Application of AC different application rates as amendment significantly affected transpiration rate (E) under level of irrigation water. A significant enhancement in E under 70FC, 50FC and 30FC verified the effectiveness of 1.50AC and 0.75AC over control (0AC). It was noted that 1.50AC was significantly best over 0.75AC and 0AC under 30FC, 50FC and 70FC for improvement in E. Furthermore, 0.75AC also remained significantly different for increase in E than 0AC under 70FC, 50FC and 30FC (Table 3). Maximum increase of 12.16, 17.26 and 21.38% in E was noted in 0.75AC over 0AC under 70, 50 and 30FC respectively. Similarly, addition of 1.50AC caused maximum significant increase (45.54, 38.29 and 39.62%) in E over 0AC under 70, 50 and 30FC respectively.
Use of AC different application rates as amendment significantly impacted stomatal conductance (gs) under level of irrigation water. A significant enrichment in gs under 70FC, 50FC and 30FC validated the efficacy of 1.50AC and 0.75AC over control (0AC). It was noted that 1.50AC was significantly best over 0.75AC and 0AC under 70FC for improvement in gs. Furthermore, 0.75AC also differed significantly better for improvement in gs than 0AC under 70FC, 50FC and 30FC (Table 3). Maximum enhancement of 7.66, 15.77 and 38.98% in gs was noted in 0.75AC over 0AC under 70, 50 and 30FC respectively. Similarly, addition of 1.50AC caused maximum significant enhancement (30.19, 26.58 and 46.62%) in gs over 0AC under 70, 50 and 30FC respectively.
Addition of AC different application rates significantly influenced electrolyte leakage under level of irrigation water. A significant decrease in electrolyte leakage under 70FC, 50FC and 30FC validated the efficacy of 1.50AC and 0.75AC over control (0AC). It was observed that 1.50AC performance was significantly best than 0.75AC and 0AC under 50FC and 70FC for decrease in electrolyte leakage. On the other hand, 0.75AC also differed significantly for decrease in electrolyte leakage than 0AC under 50FC and 30FC (Table 3A). Maximum decrease of 28.92, 36.49 and 36.80% in electrolyte leakage was noted in 0.75AC over 0AC under 70, 50 and 30FC respectively. Similarly, addition of 1.50AC caused maximum significant decrease (63.85, 59.07 and 51.64 %) in electrolyte leakage over 0AC under 70, 50 and 30FC respectively.
3.8 Soil pH, EC, and organic matter
The effect of AC at different rates was significantly different for soil pH under the level of irrigation water. Soil pH was significantly lower under 30FC, 50FC, and 70FC where 1.50AC was applied compared to control (0AC). Treatment 1.50AC was significantly better from 0.75AC and 0AC under 30FC, 50FC and 70FC for decrease in soil pH. Likewise, 0.75AC was significant for decrease in soil pH over 0AC under 30FC, 50FC and 30FC (Table 3). Maximum decrease of 2.18, 2.42 and 2.50% in soil pH was noted in 0.75AC over 0AC under 70, 50 and 30FC respectively. Similarly, the addition of 1.50AC caused maximum significant decrease (4.29, 4.17 and 3.67%) in soil pH compared to 0AC under 70, 50 and 30FC respectively.
Soil EC was significantly higher under 30FC, 50FC and 70FC where 0.75AC and 1.50AC was applied compared to control (0AC) (Table 3). No significant change was noted between 0.75AC and 1.50AC for soil EC under 30FC, 50FC and 70FC. Maximum enhancement of 30.22, 28.73 and 28.17% in soil EC was noted in 0.75AC over 0AC under 70, 50 and 30FC respectively. Similarly, addition of 1.50AC caused maximum significant enhancement (31.00, 31.82 and 27.63%) in soil EC compared to 0AC under 70, 50 and 30FC respectively.
Soil OM was significantly higher under 30FC, 50FC and 70FC where 0.75AC and 1.50AC was applied compared to control (0AC) (Table 3). A significant change was observed between 0.75AC and 1.50AC for soil OM under 30FC, 50FC and 70FC. Maximum enhancement of 120.00, 111.54 and 111.11% in soil OM was noted in 0.75AC over 0AC under 70, 50 and 30FC respectively. Similarly, addition of 1.50AC caused maximum significant enhancement (172.00, 165.39 and 155.56%) in soil OM compared to 0AC under 70, 50 and 30FC respectively.
4 Discussion
Findings of current study cleared that osmotic stress can decrease the maize growth and yield attributes. A significant decrease in the shoot and root fresh weight of maize was directly associated with limited uptake of water in the maize plants. Limited supply of water disturbed the turgor pressure in plant cells. This alteration in turgor pressure reduced cell growth resulted in poor plant development (Zeiger and Taiz, 2010). Interruption in the xylem flow of water due to osmotic stress reduced the cell division which restrict the plant height (Nonami, 1998). Similar kind of results were also noted when maize plants were cultivated in limited supply of water (50 and 30% FC). Addition of acidified chemically produced carbon at the rate of 1.50% gave better results regarding improvement in maize growth attributes under normal irrigation and osmotic stress. It was noted that 0.75 and 1.50% AC under 50 and 30% FC improved fresh and dry weight of shoot and root in maize. Such improvement was subjected to better water availability to the plants. Incorporation of organic carbon enriched amendments in soil increase the microbial proliferation. Better symbiosis caused significant improvement in root length which facilitate the plants regarding ample uptake of water under drought stress (Danish et al., 2020). Such improvement in the root length of maize plants was also observed where 0.75 and 1.50% AC was applied as amendment under 50 and 30% FC. On the other hand, a significant decline in chlorophyll contents was also observed as major negative impact of osmotic stress. Under abiotic stress i.e., osmotic stress plants membrane integrity become lost due to degradation of lipid as a result of stress ethylene accumulation. Activation of chlorophyllase (chlase) gene due to contact of ethylene with chloroplast is a major notorious impact which destroy the structure of chloroplast. Eventually a significant decline in chloroplast demonstrate the symptoms of chlorosis in the plant leaves (Matile et al., 1997). Higher permeability of cell membrane also enhance the electrolyte leakage in the leaves under limited supply of water (Senaratna and McKersie, 1983). Our findings are also in agreement with above arguments. A significant decline was also noted in the chlorophyll contents where plants were cultivated under drought stress compared to normal irrigation. Furthermore, significant improvement in chlorophyll and decrease in electrolyte leakage was also observed when AC was applied under drought stress. This fact validated the better uptake of water by maize plants due to AC which played crucial role in improvement of chlorophyll contents in maize. Limited photosynthetic rate and transpiration rate are allied factors which indicates the osmotic stress in plants (Aslam et al., 2013). It was noted that gas exchange attributes were also subjected towards improvement due to AC application in maize plants. In addition to above, improvement in soil chemical attributes also facilitate the plant for their survival in the stress environment. Decrease in soil pH of alkaline soil, causes solubilization of immobile nutrients i.e., P and K in the soil. Better uptake of these nutrients played a vital role in significant enhancement of crops yield (Sultan et al., 2020). Less losses of nitrogen as volatilization and leaching by increasing soil organic carbon is also an established fact (Esfandbod et al., 2017). Addition of carbon rich amendments in soil enhanced nitrogen uptake as well in the plants which facilitate in the vegetative growth. Similar results were also noted in the current study where grains N, P and K were significantly improved by the addition of AC compared to control under normal irrigation and drought stress.
5 Conclusion
It is concluded that AC has potential to improve the growth and yield attributes of maize under osmotic stress. Addition of 1.50% AC can alleviate the medium and severe osmotic stress in maize. Compared to control, 0.75% AC also performed significantly better for enhancement in growth and yield attributes of maize in medium and severe osmotic stress. Growers are suggested to incorporate 1.50% AC in soil for achievement of better maize productivity in normal and osmotic stress conditions. More investigation is required on variable cereal crops for declaration of 1.50% AC as a best treatment for mitigation of drought stress in altered agroclimatic condition.
Acknowledgement
The authors highly acknowledge King Khalid University for providing funding support for this study via the research project (R.G.P. 2/192/43).
Declaration of Competing Interest
The authors declare that they have no known competing financial interests or personal relationships that could have appeared to influence the work reported in this paper.
References
- Mitigation of lead (Pb) toxicity in rice cultivated with either ground water or wastewater by application of acidified carbon. J. Environ. Manage.. 2022;307:114521
- [CrossRef] [Google Scholar]
- Sulphur protects mustard (Brassica campestris L.) from cadmium toxicity by improving leaf ascorbate and glutathione: Sulphur protects mustard from cadmium toxicity. Plant Growth Regul.. 2008;54:271-279.
- [CrossRef] [Google Scholar]
- Copper Enzymes in Isolated Chloroplasts. Polyphenoloxidase in Beta vulgaris. Plant Physiol.. 1949;24:1-15.
- [CrossRef] [Google Scholar]
- Drought tolerance in maize through Potassium: Drought stress, its effect on maize production and development of drought tolerance through potassium application. Cercet. Agron. în Mold.. 2013;XLVI:16.
- [Google Scholar]
- Bremner, M., 1996. Nitrogen-Total. In: Sumner, D.L., A.L., S., P.A., P., R.H., H., N., L.P., A., S.M., T., T.C., E., J.M. (Eds.), Methods of Soil Analysis Part 3. Chemical Methods-SSSA Book Series 5. John Wiley & Sons, Inc., Madison, WI, USA, pp. 1085–1121.
- A critical review of the possible adverse effects of biochar in the soil environment. Sci. Total Environ. 2021:148756.
- [CrossRef] [Google Scholar]
- Methods of analysis for soils, plants and water. Berkeley, CA, USA: University of California, Division of Agricultural Sciences; 1961.
- Genotypic variability in morphological and physiological traits among maize inbred linesnitrogen responses. Crop Sci.. 2006;46:1266-1276.
- [Google Scholar]
- Effect of foliar application of Fe and banana peel waste biochar on growth, chlorophyll content and accessory pigments synthesis in spinach under chromium (IV) toxicity. Open Agric.. 2019;4:381-390.
- [CrossRef] [Google Scholar]
- Co-application of ACC-deaminase producing PGPR and timber-waste biochar improves pigments formation, growth and yield of wheat under drought stress. Sci. Rep.. 2019;9:5999.
- [CrossRef] [Google Scholar]
- ACC-deaminase producing plant growth promoting rhizobacteria and biochar mitigate adverse effects of drought stress on maize growth. PLoS One. 2020;15:e0230615.
- [Google Scholar]
- Determination of potassium and sodium by flame emmision spectrophotometery. In: Kalra Y., ed. Handbook of Reference Methods for Plant Analysis. Washington, D.C.: CRC Press; 1998. p. :153-155.
- [Google Scholar]
- Influence of soil properties and feedstocks on biochar potential for carbon mineralization and improvement of infertile soils. Geoderma. 2018;332:100-108.
- [CrossRef] [Google Scholar]
- Aged acidic biochar increases nitrogen retention and decreases ammonia volatilization in alkaline bauxite residue sand. Ecol. Eng.. 2017;98:157-165.
- [CrossRef] [Google Scholar]
- Methods of Soil, Plant, and Water Analysis : A manual for the West Asia and North Africa region (3rd ed.). Beirut, Lebanon: International Center for Agricultural Research in Dry Areas; 2013.
- FAO, 2009. Pakistan country sheet on global survey of agricultural research and extension.
- Gee, G.W., Bauder, J.W., 1986. Particle-size analysis, in: Methods of Soil Analysis. Part 1. Physical and Mineralogical Methods. Madison, pp. 383–411. https://doi.org/10.2136/sssabookser5.1.2ed.c15.
- The long-term effect of biochar on soil microbial abundance, activity and community structure is overwritten by land management. Front. Environ. Sci.. 2019;7:110.
- [Google Scholar]
- Pongamia pinnata L. leaves biochar increased growth and pigments syntheses in Pisum sativum L. exposed to nutritional stress. Agric.. 2019;9:153.
- [CrossRef] [Google Scholar]
- IPCC, 2007. Climate Change 2007: The Physical Science Basis.Vol 1009. Cambridge University Press, Cambridge.
- Acidified Biochar Confers Improvement in Quality and Yield Attributes of Sufaid Chaunsa Mango in Saline Soil. Horticulturae. 2021;7:418.
- [Google Scholar]
- Kuo, S., 1996. Phosphorus. In: Sparks, D.L., Page, A.L., Helmke, P.A., Loeppert, R.H., Soltanpour, P.N., Tabatabai, M.A., Johnston, C.T., Sumner, M.E. (Eds.), Methods of Soil Analysis Part 3: Chemical Methods. John Wiley & Sons, Ltd, SSSA, Madison, Wisconsin, pp. 869–919. https://doi.org/10.2136/sssabookser5.3.c32.
- NaCl-induced Senescence in Leaves of Rice (Oryza sativaL.) Cultivars Differing in Salinity Resistance. Ann. Bot.. 1996;78:389-398.
- [CrossRef] [Google Scholar]
- Planta Localization of chlorophyllase in the chloroplast envelope. Planta. 1997;201:96-99.
- [CrossRef] [Google Scholar]
- Aging induced changes in biochars functionality and adsorption behavior for phosphate and ammonium. Environ. Sci. & Technol.. 2017;51:8359-8367.
- [Google Scholar]
- Plant water relations and control of cell elongation at low water potentials. J. Plant Res.. 1998;111:373-382.
- [CrossRef] [Google Scholar]
- Slow Pyrolysis of Cassava Wastes for Biochar Production and Characterization. Iran. J. Energy Environ.. 2012;3:60-65.
- [Google Scholar]
- OriginLab Corporation, 2021. OriginPro. OriginLab, Northampton, MA, USA.
- Screening of seedlings of durum wheat (Triticum durum Desf.) cultivars for tolerance to peg-induced drought stress. Pak. J. Bot.. 2021;53:823-832.
- [Google Scholar]
- Effect of fertilizer levels and plant densities on yield and protein contents of autumn planted maize. Pak. J. Agri. Sci.. 2010;47:201-208.
- [Google Scholar]
- Effect of arbuscular mycorrhizal fungi on the physiological functioning of maize under zinc-deficient soils. Sci. Rep.. 2021;11:18468.
- [CrossRef] [Google Scholar]
- Characterization of Solute Efflux from Dehydration Injured Soybean (Glycine max L. Merr) Seeds. Plant Physiol.. 1983;72:911-914.
- [Google Scholar]
- Comparative performance and profitability of two corn hybrids with organic and inorganic fertilizers. Pak. J. Agric. Sci.. 2008;45:8-12.
- [Google Scholar]
- Mechanisms for Increasing the pH Buffering Capacity of an Acidic Ultisol by Crop Residue-Derived Biochars. J. Agric. Food Chem.. 2017;65:8111-8119.
- [CrossRef] [Google Scholar]
- Sparks, D.L., Page, A.L., Helmke, P.A., Loeppert, R.H., Nelson, D.W., Sommers, L.E., 1996. Total Carbon, Organic Carbon, and Organic Matter, in: Methods of Soil Analysis Part 3—Chemical Methods. Soil Science Society of America, American Society of Agronomy, pp. 961–1010. https://doi.org/10.2136/sssabookser5.3.c34.
- Principles and Procedures of Statistics: A Biometrical Approach (3rd ed.). Singapore: McGraw Hill Book International Co.; 1997.
- Chemical production of acidified activated carbon and its influences on soil fertility comparative to thermo-pyrolyzed biochar. Sci. Rep.. 2020;10:595.
- [CrossRef] [Google Scholar]
- Corn leaf orientation effects on light interception, intraspecific competition, and grain yields. J. Prod. Agric.. 1999;12:396-399.
- [Google Scholar]
- Biochar impacts soil microbial community composition and nitrogen cycling in an acidic soil planted with rape. Environ. Sci. Technol.. 2014;48:9391-9399.
- [Google Scholar]
- Plant Physiology. Sunderland, MA, USA: Sinauer Associates Inc., Publishers; 2010.


