

Translate this page into:
Impact of a post-lifestyle modification program in circulating angiopoietin-like proteins in Arab adolescents
⁎Corresponding author at: Department of Biochemistry, College of Science, King Saud University, Riyadh, Saudi Arabia. ndaghri@ksu.edu.sa (Nasser M. Al-Daghri)
-
Received: ,
Accepted: ,
This article was originally published by Elsevier and was migrated to Scientific Scholar after the change of Publisher.
Abstract
This study investigated the differences and associations between serum levels of angiopoietin-like (ANGPTL)3, ANGPTL4, and ANGPTL8 in Saudi adolescents with varying levels of obesity and glycemia before and after undergoing a 12-month lifestyle change intervention. A total of 218 Saudi adolescents (45 normal, 77 overweight, and 96 obese) (mean age = 15.1 ± 1.5 years; mean BMI = 35.1 ± 6.6 kg/m2) were included. Anthropometrics were measured at baseline and follow-up. Overnight-fasting serum samples were also collected at baseline and after 12 months of intervention for routine analysis of fasting glucose, glycated hemoglobin (HbA1c) and lipid profile. Serum levels of insulin and ANGPTLs were assessed using commercial assays. At baseline, obese children had a higher ANGPTL8 level [0.7 ng/ml (0.4–1.3), p = 0.03]. In children with prediabetes (defined as those with HbA1c > 5.7), ANGPTL8 levels and HbA1c were significantly lower post-intervention [0.2 (0.1–0.8), p = 0.002; 5.5 ± 1.1), p < 0.001, respectively]. Follow-up lipid profile and insulin levels were significantly higher in all participants with prediabetes and obesity (p-values < 0.05). ANGPTL8 levels of those who achieved 5 % weight loss (N = 25) showed no difference after follow-up (p = 0.59). In conclusion, following a 12-month lifestyle modification program, decreased levels of circulating ANGPTL8 were observed in adolescents with obesity and prediabetes. Consequently, the degree of insulin resistance may be improved by reducing reduced ANGPTL8 levels.
Keywords
ANGPTL8
Betatrophin
Adolescents
Obesity
Lifestyle intervention
Glycemia

- ANGPTL
-
Angiopoietin-like protein
- ANOVA
-
analysis of variance
- BMI
-
body mass index
- BP
-
blood pressure
- CBCD
-
Chair for Biomarkers of Chronic Diseases
- CV
-
coefficient of variation
- CVD
-
cardiovascular diseases
- ELISA
-
enzyme-linked immunosorbent assay
- FBG
-
fasting blood glucose
- Hba1c
-
glycated hemoglobin
- HDL
-
high density-lipoprotein
- IRB
-
Institutional Review Board
- KSH
-
King Salman Hospital
- KSU
-
King Saud University
- LDL
-
low-density lipoprotein
- LPL
-
lipoprotein lipase
- SD
-
standard deviation
- SPSS
-
Statistical Package for the Social Sciences
- T2DM
-
type 2 diabetes mellitus
- VLDL
-
very low-density lipoprotein
- WHO
-
World Health Organization
Abbreviations
1 Introduction
Obesity is a significant global health issue and one of the primary causes of several noncommunicable illnesses (Nyberg et al., 2018). In 2016, the World Health Organization (WHO) reported that over 340 million children and adolescents aged 5 to 19 were overweight or obese (AlEnazi et al., 2023; Almughamisi, O'Keeffe, & Harding, 2022). Obesity and type 2 diabetes mellitus (T2DM) are both highly prevalent incidence in developed nations and is a substantial risk factor for cardiovascular diseases (CVD) (Ng et al., 2014; Piché, Tchernof, & Després, 2020). Many high-risk obese patients have a confluence of metabolic and CVD risk factors, and the prevalence of T2DM has increased by threefold in children and adolescents due to an increased incidence in severe obesity (Ashcroft & Rorsman, 2012; Ng et al., 2014). In Saudi Arabia, as of 2022, one in four girls and one in three boys between the ages of 12 and 18 were either overweight or obese (Almughamisi et al., 2022). The increasing incidence of T2DM in the world is directly attributable to the increased prevalence of obesity because of less desirable lifestyle and nutrition habits (Association, 2017; Shilbayeh, 2022).
ANGPTL8, also known as “Betatrophin,” “RIFL,” “C19ORF80,” “TD26,” and “lipasin,” is a novel adipokine secreted from the adipose and liver tissues into circulation. It has been observed to be a nutritionally regulated factor correlated with lipid and glucose metabolism as well as energy homeostasis (M. Li et al., 2021). ANGPTL8 is a triglyceride regulator that functions in the vascular wall via lipoprotein lipase activity, and it is substantially associated with obesity, overweight, glucose intolerance, and T2DM (Fu et al., 2014a), similar to other less established adipokines like asprosin, at least in adults (Al-Daghri et al., 2022b).
Members of the angiopoietin-like protein (ANGPTL) family, specifically ANGPTL3, 4, and 8, are essential regulators of lipoprotein lipase (LPL) activity (Mattijssen & Kersten, 2012). All members consist of an N-terminal coiled-coil domain and a carboxyl terminus fibrinogen-like domain with the exception of ANGPTL8, which lacks the fibrinogen-like domain (Mattijssen & Kersten, 2012). ANGPTL3 is a circulating factor that is released steadily and expressed particularly in the liver, independent of the organism's nutritional state (Zhang, 2016). On the other hand, ANGPTL4 selectively inhibits LPL in adipose tissue and modifies LPL activity during fasting and exercise (Kersten et al., 2009). Meanwhile, overexpression of ANGPTL8 is associated with increased TG levels and decreased LPL activity dose-dependently and stimulated by feeding, which is suppressed during fasting (Zhang, 2012). Likewise, recent investigation has also connected ANGPTL4 loss of function mutations to lower rates of coronary heart disease; ANGPTL3 loss of function mutations were related to lower very low-density lipoprotein (VLDL), low density lipoprotein (LDL), high density lipoprotein (HDL), and (triglycerides) TG levels (Dewey et al., 2016; Musunuru et al., 2010). ANGPTL3, ANGPTL4, and ANGPTL6 are capable of regulating lipid, glucose, and energy metabolism without exhibiting angiogenic effects (Christopoulou et al., 2019). Conversely, ANGPTL3, ANGPTL4, and ANGPTL8, have been demonstrated to inhibit LPL and consequently control TG levels in the circulation depending on nutritional condition (Sylvers-Davie, Segura-Roman, Salvi, Schache, & Davies, 2021). Both ANGPTL3 and ANGPTL8 are expressed in the liver and can potentially be released as a complex into the bloodstream to suppress LPL as a compensatory mechanism (Stefanska et al., 2022). Diet restriction has been observed to dramatically reduce ANGPTL8 levels in obese/overweight subjects (Hu et al., 2019). As a result, targeting ANGPTL8 activity maybe a key strategy for preventing obesity and its associated pathological issues. In fact, in one observational study, T2DM patients were found to have considerably higher blood ANGPTL3, 4, and 8 levels than healthy controls (Hu et al., 2019). When the level of ANGPTL8 in 556 T2DM participants was compared to that of 1047 non-T2DM subjects, they discovered that the level of ANGPTL8 in T2DM subjects was three times greater than their non-T2DM counterparts (Issa, Abd ElHafeez, & Amin, 2019). These findings are however inconsistent, as other studies have found that ANGPTL8 was lower T2DM patients (Hou et al., 2020). In recent a meta-analysis based on nine studies that examined the relationship between ANGPTL8 level and T2DM, ANGPTL8 levels were considerably greater in T2DM participants than non-T2DM (S. Li et al., 2016). Some studies have shown that ANGPTL8 was elevated in both types of DMs and obesity subjects (Espes et al., 2014; Susanto et al., 2016; Yamada et al., 2015). In contrast, other research studies have shown that ANGPTL8 was reduced in T2DM and obese individuals (Gómez-Ambrosi et al., 2014). The conflicting data might be due to many reasons; one of them is the lack of standardization of assay kits measuring various forms of ANGPTL8 (Fu et al., 2014b). Given the potential of ANGPTLs, its effects in human metabolism must be explored further, particularly in underrepresented populations such as adolescents. For instance, the effect of lifestyle intervention on ANGPTL8 levels in adolescents with obesity and DM is yet to be documented. Given the significant impact of obesity on metabolic health, this study aims to investigate the effects of a reduced-calorie diet and physical activity on ANGPTL8 levels in adolescents with obesity and T2DM.
2 Materials and methods
2.1 Study population and ethical statement
In the present study, samples of 218 Saudi adolescents with varying levels of glycaemia and obesity statuses were taken from an existing database at the Chair for Biomarkers of Chronic Diseases (CBCD) in King Saud University (KSU), Riyadh, Saudi Arabia (Al-Daghri et al., 2022a; Al-Daghri et al., 2023; Al-Daghri et al., 2022c). The original study was in collaboration with the Ministry of Education and involved recruitment of consenting Saudi adolescents aged 12–17 years from 60 secondary and preparatory schools in Riyadh city to participate in lifestyle education programs. Participants were categorized based on Body Mass Index (BMI): 77 were classified as overweight (BMI 25.0–29.9, mean 26.6 ± 1.5 kg/m2) and 96 as obese (BMI ≥ 30, mean 35.1 ± 6.6 kg/m2). Participants were categorized based on their glycated hemoglobin (Hba1c) levels, resulting in 174 non-diabetic individuals (Hba1c < 5.7) and 44 individuals with different levels of glycemia (Hba1c ≥ 5.7). BMI was calculated as body weight (in kilograms)/height (in meters squared) (see Fig. 1). The present study was conducted in accordance to the guidelines of the Helsinki Declaration. This study was approved by the Institutional Review Board (IRB) of the College of Medicine, King Saud University (KSU), Riyadh, Saudi Arabia (Ref. No. 23/0081/IRB-A). Any participant with health issues like chronic kidney or liver diseases, CVD, and other inflammatory disorders was excluded from the study.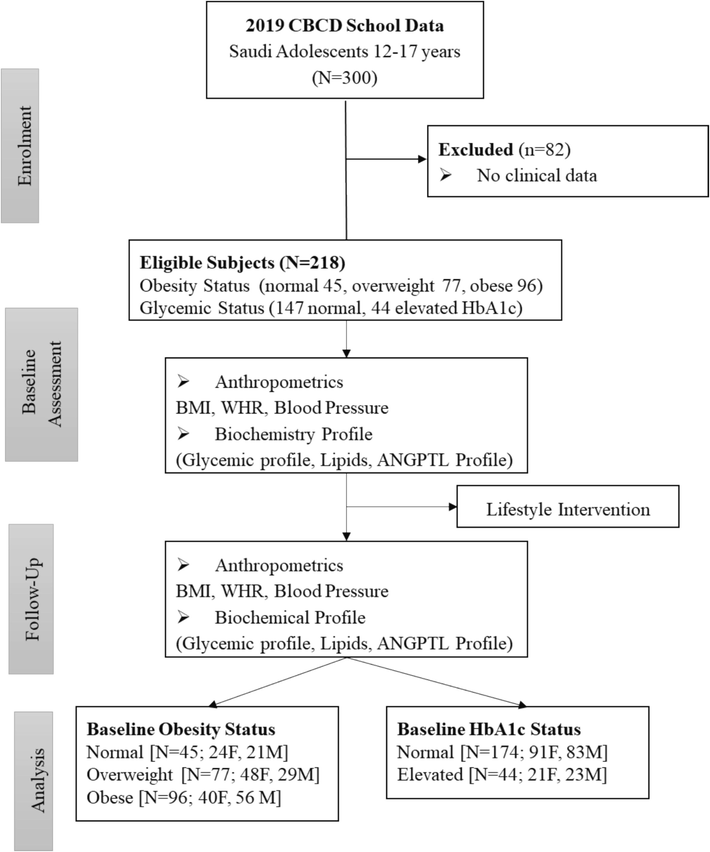
Flowchart of study participants.
2.2 Lifestyle intervention
Details about the intervention have been previously published (Al-Daghri et al., 2022a; Al-Daghri et al., 2023; Al-Daghri et al., 2022c). In brief, lifestyle modification program choices with the goal of preventing obesity and DM and especially targeting adolescents with prediabetes in Riyadh, Saudi Arabia, was launched by the CBCD at KSU in collaboration with the diabetes center at King Salman Hospital (KSH). In a cohort of school-aged children and adolescents, the 12-month lifestyle intervention was anchored on health education related to diet restriction, increased physical activity, and behavioral modifications aimed at reducing body weight, improving insulin sensitivity, and preventing the progression of chronic metabolic disorders. Educational sessions included topics such as healthy dietary habits including increasing dietary fiber intake (at least 5 %, the various components of daily caloric requirements, reduce fat consumption and increase dietary fiber intake to at least 15 g/1,000 kcal), increased physical activity (to at least 20 min per day of moderate-intensity workouts), and changes in unhealthy habits to promote sustained healthy lifestyle changes. Each educational session lasted approximately 60 min and was conducted by registered dietitians and certified fitness trainers. Participants received five educational sessions over the course of the study: one at baseline and four follow-up sessions every three months. follow-up sessions were conducted digitally via platforms like Zoom and WhatsApp. These sessions incorporated interactive elements such as gamification, infographic videos. The intervention was delivered by a team of health professionals, including certified dietitians, endocrinologists, and fitness trainers. These professionals were trained in delivering standardized educational content to ensure consistency across all participants. The participants' adherence to lifestyle changes was monitored through self-reported lifestyle diaries and regular follow-ups via phone calls.
2.3 Blood collection, anthropometric and biochemical measurements
Blood samples were collected in vacutainer EDTA tubes that were centrifuged to collect serum samples, which in turn were aliquoted and stored at − 80 °C until assayed as described previously. General and demographic information was collected by a structured questionnaire, such as age, gender, degree of education, marital status, and family history. Anthropometric and biochemical measurements were collected from the database and included weight, height, waist circumference, hip circumference, systolic and diastolic blood pressures (BP), and BMI. Fasting blood glucose (FBG), TG, total cholesterol (TC), LDL-, and HDL-cholesterol were measured using a routine chemical analyzer (Konelab, Finland) as previously assessed (Al-Daghri et al., 2022d). HbA1C was determined using D-10 hemoglobin testing system (BioRad, Hercules, CA).
2.4 Biochemical analysis
Biochemical analysis was done for the different parameters of interest which included ANGPTL8 and other associated biomarkers, using commercially available immunoassay kits. For the ANGPTL8 (pg/ml), serum samples were thawed at room temperature, and repeated freeze–thaw cycles were avoided. The ANGPTL8 level was determined using the competitive inhibition ELISA kit (Phoenix Pharmaceuticals, Inc, Burlingame, CA, USA, catalogue number EK-051–55). Lower and upper limits for ANGPTL8 are 78–5,000 pg/mL, as are the intra- and inter-assay coefficients of variation (CV). Serum levels of ANGPTL3 were assessed using Human Angiopoietin-like 3 Immunoassay Quantikine®ELISA and catalog number DANL30 (Bio-Rad, Hercules, CA, USA). The data was processed using the Bio-Plex manager software version 6 (Bio-Rad) using a five-parametric curve fitting. Intra-assay coefficients of variation (CV) were 2.6 to 3.8 %, while the inter-assay coefficients of variation were 6.9 to 8.9 %. Plasma levels of ANGPTL4 were assessed using the Human Angiopoietin Like4 ELISA Kit (Invitrogen Thermo Fisher Scientific, Waltham, Massachusetts, USA, catalog number EHANGPTL4, according to the manufacturer's instructions. Intra-Assay CV%: <10 % and inter-Assay CV%: <12 %.
2.5 Statistical analysis
Data was analyzed using the Statistical Package for the Social Sciences software (SPSS) version 21 from SPSS Inc. (Chicago, IL, USA). Normality of variables was assessed visually using quantile–quantile plots and histograms, as well as through the Kolmogorov-Smirnov test. Outliers which did not make clinical sense, if any, were removed from the data analysis. All normally distributed data were presented as mean and standard deviations (SD), while non-normally distributed data were presented as median and interquartile range. The analysis of variance (ANOVA) and Kruskal-Wallis Test were used to determine significant differences according to obesity status for normal and non-normal variables respectively. Furthermore, independent sample t-test and Mann-Witney U test were used to determine significant differences according to glycemic status for normal and non-normal variables respectively. Repeated measures ANOVA was used to determine within and between group differences. A p-value < 0.05 was considered statistically significant.
3 Results
3.1 General characteristics of participants, according to obesity and glycemic status
Table 1 presents descriptive statistics categorized according to obesity status. A total of 45 participants were classified as normal, 77 overweight, and 96 obese. Obese individuals being younger on average (14.7 years) than overweight (15.6 years) participants. The gender distribution also varied significantly, with a significantly higher proportion of females in the obese group (40 males to 56 females) than other groups (24 males to 21 females in normal and 48 males to 29 females in overweight) (p = 0.02). Weight, waist, and hip measurements were significantly higher in the overweight and obese groups (p-values < 0.001). Mean systolic BP increased with obesity status, while diastolic BP showed no significant difference. Among the lipids, HDL cholesterol levels were lower in the overweight and obese groups, and HbA1c levels were significantly higher in the overweight group than normal. Glucose levels were non-significant across groups (p = 0.38). Mean TG was modestly higher in the obese group than normal and overweight groups (p = 0.09). Insulin levels were significantly higher in the overweight group (7.1 ng/ml) than obese (1.8 ng/ml), with a p = 0.01. Lastly, ANGPTL8 levels were significantly higher in the obese group (0.7 ng/ml) than overweight (0.5 ng/ml) (p = 0.05). Mean ANGPTL3 and ANGPTL4 were not significantly different according to obesity status. Note: Data presented as Mean ± SD for normal variables and Median (1st Quartile – 3rd Quartile) for non-normal variables; P < 0.05 considered significant.
Parameters
Normal
Overweight
Obese
p-value
N (F/M)
45 (24/21)
77 (48/29)
96 (40/56)
0.02
Age (Years)
15.1 ± 1.5
15.6 ± 1.7
14.7 ± 1.8B
0.002
Anthropometrics
Weight (kg)
49.1 ± 8.7
66.5 ± 7.8 A
87.0 ± 18.7 AB
<0.001
BMI (kg/m2)
19.8 ± 2.6
26.6 ± 1.5 A
35.1 ± 6.6 AB
<0.001
Waist (cm)
63.5 ± 17.0
75.2 ± 16.4 A
85.5 ± 21.4 AB
<0.001
Hips (cm)
79.9 ± 22.0
92.1 ± 20.3 A
100.9 ± 25.4 AB
<0.001
WHR
0.80 ± 0.08
0.82 ± 0.08
0.85 ± 0.11 AB
0.004
Systolic BP (mmHg)
119.5 ± 11.8
122.0 ± 15.1
129.8 ± 19.5 AB
0.005
Diastolic BP (mmHg)
73.1 ± 12.7
72.2 ± 11.6
75.8 ± 14.1
0.53
Lipid Profile
Triglycerides (mmol/l)
1.0 (0.7 – 1.3)
1.0 (0.8 – 1.3)
1.1 (0.8 – 1.6)
0.09
Total Cholesterol (mmol/l)
4.6 ± 1.2
4.6 ± 0.8
4.6 ± 0.9
0.97
HDL Cholesterol (mmol/l)
1.1 ± 0.2
0.9 ± 0.3 A
0.9 ± 0.2 A
0.002
LDL Cholesterol (mmol/l)
3.0 ± 0.9
3.1 ± 0.7
3.0 ± 0.7
0.58
Glycemic Profile
HbA1c (%)
6.1 ± 0.9
5.1 ± 0.7 A
5.2 ± 0.5 A
<0.001
Glucose (mmol/l)
5.1 (4.9 – 5.4)
5.2 (4.8 – 5.7)
5.2 (5.0 – 5.6)
0.38
Insulin (IU/ml)
1.4 (0.7 – 9.1)
7.1 (1.2 – 15.3)
1.8 (0.8 – 5.2) B
0.01
ANGPTL Profile
ANGPTL8 (ng/ml)
0.6 (0.3 – 1.3)
0.5 (0.2 – 0.8)
0.7 (0.4 – 1.3) B
0.05
ANGPTL4 (pg/mL)
523.5 (178 – 906)
526.3 (240– 731)
384.6 (202 – 592)
0.39
ANGPTL3 (ng/mL)
4.8 (1.5 – 5.2)
4.9 (4.6 – 22.7)
4.6 (1.7 – 4.8)
0.15
Table 2 shows the characteristics of participants according to glycemic status. The control group (Hba1c < 5.7) included 174 participants and prediabetes group (Hba1c ≥ 5.7) included 44 participants. The prediabetes group were significantly older and had lower BMI (p < 0.001) than their normoglycemic counterparts. The median ANGPTL8 levels were modestly higher in the prediabetes group (0.7 ng/ml) than the HbA1c < 5.7 group (0.6 ng/ml), but this difference is not statistically significant (p = 0.22). Similarly, ANGPTL4 levels were also modestly higher in controls than the prediabetes group but not statistically significant (p = 0.66). Lastly, there was no significant difference in ANGPTL3 between groups (p = 0.79). Note: Data presented as Mean ± SD for normal variables and Median (1st Quartile – 3rd Quartile) for non-normal variables; p < 0.05 considered significant.
Parameters
Control
Prediabetes
p-value
N
174
44
Age
14.9 ± 1.8
15.6 ± 1.4
0.03
F/M
91/83
21/23
0.59
Anthropometrics
Weight (kg)
74.0 ± 19.0
64.0 ± 23.3
0.003
BMI (kg/m2)
29.9 ± 7.3
24.9 ± 7.3
<0.001
Waist (cm)
79.4 ± 19.5
68.4 ± 22.6
0.01
Hips (cm)
95.6 ± 23.3
84.2 ± 26.0
0.02
WHR
0.84 ± 0.10
0.82 ± 0.08
0.38
Systolic BP (mmHg)
124.9 ± 16.2
124.4 ± 20.5
0.95
Diastolic BP (mmHg)
74.1 ± 12.9
73.1 ± 13.3
0.47
Lipid Profile
Triglycerides (mmol/l)
1.1 (0.8–––1.4)
1.0 (0.8–––1.4)
0.66
Total Cholesterol (mmol/l)
4.6 ± 0.9
4.7 ± 1.2
0.56
HDL Cholesterol (mmol/l)
0.9 ± 0.2
1.0 ± 0.2
0.10
LDL Cholesterol (mmol/l)
3.1 ± 0.7
3.0 ± 0.9
<0.001
Glycemic Profile
HbA1c (%)
5.1 ± 0.3
6.6 ± 0.9
<0.001
Glucose (mmol/l)
5.1 (4.9–––5.5)
5.2 (4.9–––6.0)
0.14
Insulin (IU/ml)
2.5 (0.9–––9.8)
1.4 (0.6–––4.8)
0.09
ANGPTL Profile
ANGPTL8 (ng/ml)
0.6 (0.3–––1.0)
0.7 (0.3–––1.7)
0.22
ANGPTL4 (pg/mL)
446.0 (203–––762)
380.6 (228–––656)
0.66
ANGPTL3 (ng/mL)
4.8 (2.4–––5.3)
4.7 (1.6–––4.9)
0.79
3.2 Characteristics of participants at baseline and follow-up
Clinical characteristics for each group (control, overweight, and obese) at baseline and follow-up according to obesity status are shown in Table 3. The normal group significantly increased weight over time from 49.1 kg to 52.3 kg (p = 0.001). On the other hand, the overweight group had a marginal weight increase (from 66.5 kg to 67.5 kg, p = 0.07) with a significant decline in BMI (26.6 to 25.6, p = 0.02). In contrast, the obese group showed a significant decrease in weight (from 87.0 kg to 85.1 kg, p = 0.001) and BMI (35.1 to 33.1, p < 0.001). All groups reported significant increases in waist and hip measurements, with the normal group experiencing the most drastic change in waist size (from 63.5 cm to 81.2 cm, p < 0.001). Systolic BP decreased significantly across all groups (p = 0.003), while diastolic BP changes were not statistically significant for normal and overweight groups. Moreover, HbA1c levels improved significantly in the normal group (from 6.1 to 5.2, p < 0.001), while the overweight group saw a modest but significant increase (from 5.1 to 5.6, p = 0.01). Lipid profiles (total cholesterol, HDL, and LDL levels) significantly increased over time in across all groups, highlighting worsening lipid profiles despite some weight loss in the obese group. At baseline, TG levels were similar across groups, but all groups showed significant increase at follow-up, with the normal group rising from 1.0 to 1.7 mmol/l (p < 0.001), the overweight group from 1.0 to 1.6 mmol/l (p < 0.001), and the obese group from 1.1 to 1.5 mmol/l (p = 0.003). Insulin levels also increased significantly in all groups, particularly in the Normal group, which saw a dramatic rise from 1.4 to 6.5 ng/ml (p < 0.001). In contrast, glucose levels remained relatively stable across all groups, with no significant changes noted. The ANGPTL8 levels decreased significantly in the normal group (from 0.6 to 0.2 ng/ml, p = 0.003) while a significant decrease in the obese group was observed (from 0.7 to 0.5 ng/ml, p = 0.03). ANGPTL4 levels increased in the obese group (from 384.6 to 761.0 pg/mL, p = 0.04). Lastly, ANGPTL3 levels increased significantly across all groups over time (Table 3). Note: Variables presented as Mean ± SD for normal variables and Median (1st Quartile – 3rd Quartile) for non-normal variables; P < 0.05 considered significant. ** and * indicates significance at 0.01 and 0.05 respectively.
Normal
Overweight
Obese
P-value
Baseline
Follow-up
Baseline
Follow-up
Baseline
Follow-up
N
45
77
96
M/F
21/24
29/48
56/40
0.025
Anthropometrics
Weight (kg)
49.1 ± 8.7
52.3 ± 8.7**
66.5 ± 7.8
67.5 ± 7.4
87.0 ± 18.7
85.1 ± 17.4**
<0.001
BMI (kg/m2)
19.8 ± 2.6
20.4 ± 3.4
26.6 ± 1.5
25.6 ± 2.3*
35.1 ± 6.6
33.1 ± 7.5**
<0.001
Waist (cm)
63.5 ± 17.0
81.2 ± 33.8**
75.2 ± 16.4
76.4 ± 12.0
85.5 ± 21.4
77.6 ± 15.1**
<0.001
Hips (cm)
79.9 ± 22.0
85.8 ± 14.2*
92.1 ± 20.3
84.1 ± 11.7
100.9 ± 25.4
84.0 ± 14.2**
<0.001
WHR
0.80 ± 0.08
0.89 ± 0.08**
0.82 ± 0.08
0.91 ± 0.07**
0.85 ± 0.11
0.92 ± 0.06**
0.003
Systolic BP (mmHg)
119.5 ± 11.8
108.9 ± 11.5**
122.0 ± 15.1
112.8 ± 12.0**
129.8 ± 19.5
110.8 ± 12.3**
0.002
Diastolic BP (mmHg)
73.1 ± 12.7
72.3 ± 7.0
72.2 ± 11.6
74.1 ± 7.4
75.8 ± 14.1
73.3 ± 6.6*
0.11
Lipid Profile
Triglycerides (mmol/l)
1.0 (0.7–––1.3)
1.7 (1.3–––2.4) **
1.0 (0.8–––1.3)
1.6 (1.1–––2.2) **
1.1 (0.8–––1.6)
1.5 (1.0–––2.2) **
0.91
Total Cholesterol (mmol/l)
4.6 ± 1.2
6.7 ± 1.5**
4.6 ± 0.8
6.6 ± 1.7**
4.6 ± 0.9
6.5 ± 1.8**
0.82
HDL Cholesterol (mmol/l)
1.1 ± 0.2
1.7 ± 0.6**
0.9 ± 0.3
1.7 ± 0.7**
0.9 ± 0.2
1.6 ± 0.7**
0.34
LDL Cholesterol (mmol/l)
3.0 ± 0.9
4.1 ± 1.2**
3.1 ± 0.7
4.0 ± 1.4**
3.0 ± 0.7
4.1 ± 1.4**
0.74
Glycemic Profile
HbA1c (%)
6.1 ± 0.9
5.2 ± 1.0**
5.1 ± 0.7
5.6 ± 1.9*
5.2 ± 0.5
5.3 ± 1.3
0.04
Glucose (mmol/l)
5.1 (4.9–––5.4)
4.7 (4.4–––5.8)
5.2 (4.8–––5.7)
5.2 (4.6–––6.1)
5.2 (5.0–––5.6)
5.1 (4.5–––5.8)
0.14
Insulin
1.4 (0.7–––9.1)
6.5 (3.7–––16.9) **
7.1 (1.2–––15.3)
10.0 (5.2–––19.2) **
1.8 (0.8–––5.2)
6.1 (1.6–––11.9) **
0.02
ANGPTL Profile
ANGPTL8 (ng/ml)
0.6 (0.3–––1.3)
0.2 (0.1–––0.8) **
0.5 (0.2–––0.8)
0.4 (0.2–––1.1)
0.7 (0.4–––1.3)
0.5 (0.1–––1.1) *
0.80
ANGPTL4 (pg/mL)
523.5 (178–906)
837.2 (657–1090)
526.3 (240–731)
744.7 (549–1378)
384.6 (202–592)
761.0 (493–891) *
0.69
ANGPTL3 (ng/mL)
4.8 (1.5–––5.2)
17.8 (11.3–31.3) **
4.9 (4.6–22.7)
22.1 (8.6–48.0) *
4.6 (1.7–––4.8)
17.9 (1.4–––33.6) **
0.45
Clinical characteristics of participants at baseline and follow-up according to glycemic status are summarized in Table 4. For controls, ANGPTL8 levels showed a slight decrease from 0.6 ng/ml to 0.4 ng/ml, but this change was not statistically significant (p = 0.35). In contrast, the prediabetes group experienced a significant reduction in ANGPTL8 levels from 0.7 ng/ml to 0.2 ng/ml (p = 0.002). Regarding ANGPTL4, controls had a significant increase from 446.0 pg/mL to 766.0 pg/mL (p = 0.01), whereas the prediabetes group did not show a significant change. Lastly, both groups showed a significant increase in ANGPTL3 levels. Note: Data presented as Mean ± SD for normal variables and Median (1st Quartile – 3rd Quartile) for non-normal variables; P < 0.05 considered significant. * Indicates p-values adjusted for age and gender.
Parameters
Hba1c < 5.7
Hba1c ≥ 5.7
p-value*
Baseline
Follow-up
p-value
Baseline
Follow-up
p-value
Weight (kg)
74.0 ± 19.0
73.7 ± 17.4
0.59
64.0 ± 23.3
65.8 ± 19.9
0.05
<0.001
Waist (cm)
79.4 ± 19.5
77.9 ± 20.9
0.10
68.4 ± 22.6
78.1 ± 14.2
0.005
0.003
Hips (cm)
95.6 ± 23.3
84.0 ± 13.0
<0.001
84.2 ± 26.0
86.0 ± 14.6
0.45
0.004
WHR
0.84 ± 0.10
0.93 ± 0.23
<0.001
0.82 ± 0.08
0.91 ± 0.07
<0.001
0.28
Systolic BP (mmHg)
124.9 ± 16.2
111.8 ± 11.8
<0.001
124.4 ± 20.5
108.6 ± 12.8
<0.001
0.14
Diastolic BP (mmHg)
74.1 ± 12.9
73.5 ± 7.1
0.74
73.1 ± 13.3
72.8 ± 6.4
0.60
0.65
BMI (kg/m2)
29.9 ± 7.3
28.6 ± 7.4
<0.001
24.9 ± 7.3
24.8 ± 6.5
0.83
<0.001
Lipid Profile
Triglycerides (mmol/l)
1.1 (0.8–––1.4)
1.6 (1.1–––2.2)
<0.001
1.0 (0.8–––1.4)
1.5 (1.0–––2.3)
0.002
0.61
Total Cholesterol (mmol/l)
4.6 ± 0.9
6.5 ± 1.7
<0.001
4.7 ± 1.2
6.7 ± 1.7
<0.001
0.55
HDL Cholesterol (mmol/l)
0.9 ± 0.2
1.6 ± 0.7
<0.001
1.0 ± 0.2
1.7 ± 0.7
<0.001
0.53
LDL Cholesterol (mmol/l)
3.1 ± 0.7
4.1 ± 1.3
<0.001
3.0 ± 0.9
4.1 ± 1.3
<0.001
0.87
Glycemic Profile
HbA1c (%)
5.1 ± 0.3
5.4 ± 1.5
0.006
6.6 ± 0.9
5.5 ± 1.1
<0.001
<0.001
Glucose (mmol/l)
5.1 (4.9–––5.5)
5.1 (4.5–––5.8)
0.06
5.2 (4.9–––6.0)
4.7 (4.3–––6.1)
0.13
0.29
Insulin (IU/ml)
2.5 (0.9–––9.8)
8.5 (1.8–––14.5)
<0.001
1.4 (0.6–––4.8)
7.8 (3.2–––17.4)
<0.001
0.46
ANGPTL Profile
ANGPTL8 (ng/ml)
0.6 (0.3–––1.0)
0.4 (0.1–––1.2)
0.35
0.7 (0.3–––1.7)
0.2 (0.1–––0.8)
0.002
0.74
ANGPTL4 (pg/mL)
446.0 (203–762)
766.0 (538–1093)
0.01
380.6 (228–656)
812.7 (380–1090)
0.401
0.74
ANGPTL3 (ng/mL)
4.8 (2.4–––5.3)
21.5 (6.2–––43.6)
<0.001
4.7 (1.6–––4.9)
13.0 (4.7–––28.8)
<0.001
0.29
4 Discussion
The present study assessed altered expressions of ANGPTL8 and related biomarkers in the serum of Arab adolescents with differing levels of BMI and glycemic before and following a 12-month lifestyle change intervention and observed that ANGPTL8 expression was significantly influenced by changes in obesity and glycemic status. ANGPTL8 levels were associated with baseline and prospective changes in BMI levels in obese participants. We also found that baseline serum ANGPTL8 levels were significantly higher in the prediabetes group than controls before undergoing the lifestyle intervention program. There was a stepwise increase in the risk of developing diabetes according to the serum ANGPTL8 levels. However, there was no significant inter-relationship between circulating ANGPTL8 and ANGPTL4 concentrations.
ANGPTL3, 4, and 8 have been documented to have a significant effect on TG metabolism, while ANGPTL4 and ANGPTL8 have been linked to glucose metabolism. These 3 markers have been examined for their potential roles as TG regulators and insulin mediators (Ke, Liu, Zhang, & Hu, 2021). Based on findings from Gao et al., ANGPTL8 levels are higher in newly diagnosed T2DM patients and lower in those with improved β-cell activity (Hu et al., 2014). In contrast, a similar study has found lower levels of ANGPTL8 in T2DM patients due to insulin resistance (Gokulakrishnan et al., 2015). Moreover, a study has pointed out that ANGPTL8 levels are reduced in young-onset T2DM (Gokulakrishnan et al., 2015). Fenzl et al., on the other hand, found that ANGPTL8 levels are comparable among lean and morbidly obese individuals and in both non-T2DM and T2DM subjects (Fenzl et al., 2014). Other studies have found no association between baseline ANGPTL8 levels and subsequent alterations in fasting blood glucose levels and obesity indicators, including BMI and waist circumference (Chung et al., 2016). Although the precise cause of this discrepancy has not been determined, a recent investigation revealed that circulating ANGPTL8 levels do not reflect insulin action in the liver or adipose tissue (Nidhina Haridas et al., 2015). In the present study, we found that circulating ANGPTL8 concentrations were markedly reduced among adolescents after a 12-month lifestyle intervention program. Therefore, the decreased levels of betatrophin may be related to hyperglycemia and to the degree of insulin resistance. Supporting this notion, ANGPTL8 concentration was strongly and inversely correlated with all markers of insulin resistance, such as glycemia and insulinemia. Furthermore, ANGPTL8 concentrations were not associated with ANGPTL3 and ANGPTL4 levels and were significantly higher in overweight and obese adolescents. These findings demonstrate that inhibiting ANGPTL8 might be a therapeutic approach for hypertriglyceridemia. Wang et al. also discovered that mice missing ANGPTL8 had a disruption in TG metabolism (Wang et al., 2013). In the present study, ANGPTL8 concentration was inversely associated with lipid profiles in Arab adolescents at follow-up. Our findings are consistent with earlier cross-sectional evidence indicating an association between ANGPTL8 and lipid profile, particularly circulating TG levels (Gómez-Ambrosi et al., 2014).
ANGPTL4 plays a major role in the regulation of lipid metabolism through inhibition of the enzyme lipoprotein lipase, thereby suppressing clearance of TG-rich lipoproteins and thus raising plasma TG levels (Kersten et al., 2009). Circulating ANGPTL3 and ANGPTL4 have been observed to be highly associated with plasma lipids but not with metabolic syndrome features such as TGs (Chung et al., 2016). In this study, we observed that ANGPTL3 and ANGPTL4 concentrations were significantly associated with fasting insulin concentrations, with significant inverse association with lipid profiles. A recent study has indicated that ANGPTL8 levels in obese participants are greatly reduced and strongly correlated with TG levels (inversely) and with HDL-cholesterol (positively). It is possible that ANGPTL8 levels are reduced in response to increasing lipidemia as a compensatory mechanism aimed at lowering lipoprotein levels (Gómez-Ambrosi et al., 2014).
The authors acknowledge several limitations. Dietary intake was not included in the assessment and this could partially explain the changes observed in ANGPTLs overtime as some markers assessed, including lipids, are dependent on nutritional status. As some of the discrepancies in findings across literature can be explained by ethnicity, the results of the present study may only be applicable to Arab adolescents, which coincidentally, is also one of the study’s strengths, as it fills a gap in the literature on how ANGPTLs are expressed overtime in understudied population.s.
5 Conclusion
Our results show that serum ANGPTL8 concentrations are decreased in obese participants after a 12-month lifestyle intervention program and are further reduced in parallel to the increase in insulin resistance. Further studies modulating ANGPTL8 levels and activity, determining which are the pathophysiological regulators of ANGPTL8, together with the identification of the ANGPTL8 receptor will undoubtedly help to elucidate the exact role of ANGPTL8 in obesity and obesity-associated comorbidities such as T2D and dyslipidemia.
CRediT authorship contribution statement
Mona M. Alenazi: Writing – original draft, Methodology, Formal analysis, Conceptualization. Shaun Sabico: Writing – review & editing, Supervision. Abdullah M. Alnaami: Project administration, Methodology. Kaiser Wani: Writing – review & editing, Formal analysis, Conceptualization. Syed D. Hussain: Data curation. Nasser M. Al-Daghri: Writing – review & editing, Supervision, Funding acquisition, Conceptualization.
Acknowledgment
The authors are grateful to the Researchers Supporting Project (RSP2024R21) in King Saud University, Riyadh, Saudi Arabia for their support.
Funding
This work was funded by the Researchers Supporting Project (RSP2024R21) in King Saud University, Riyadh, Saudi Arabia.
Declaration of competing interest
The authors declare that they have no known competing financial interests or personal relationships that could have appeared to influence the work reported in this paper.
References
- Effects of a 12-Month Hybrid (In-Person+ Virtual) Education Program in the Glycemic Status of Arab Youth. Nutrients. 2022;14(9):1759.
- [Google Scholar]
- Serum asprosin levels are associated with obesity and insulin resistance in Arab adults. J. King Saud Univ.-Sci.. 2022;34(1):101690
- [Google Scholar]
- Cardiometabolic Effects of a 12-Month, COVID-19 Lockdown-Interrupted Lifestyle Education Program for Arab Adolescents. Front. Pediatr.. 2022;10:887138
- [Google Scholar]
- Attendance-based adherence and outcomes of obesity management program in Arab adolescents. Children. 2023;10(9):1449.
- [Google Scholar]
- Al-Daghri, N.M., Sabico, S., Ansari, M.G.A., Abdi, S., Tripathi, G., Chrousos, G.P., McTernan, P.G. Endotoxemia, vitamin D and premature biological ageing in Arab adults with different metabolic states (2022). Saudi J Biol Sci, 29(6), 103276.
- Prevalence of obesity among children and adolescents in Saudi Arabia: A multicenter population-based study. Saudi J. Med. Med. Sci.. 2023;11(1):19.
- [Google Scholar]
- Adolescent obesity prevention in Saudi Arabia: co-identifying actionable priorities for interventions. Front. Public Health. 2022;10:863765
- [Google Scholar]
- 7. Obesity management for the treatment of type 2 diabetes. Diabetes Care. 2017;40(Supplement_1):S57-S63.
- [Google Scholar]
- Christopoulou, E., Elisaf, M., & Filippatos, T. (2019). Effects of angiopoietin-like 3 on triglyceride regulation, glucose homeostasis, and diabetes. Disease markers, 2019.
- Circulating angiopoietin-like protein 8 (ANGPTL8) and ANGPTL3 concentrations in relation to anthropometric and metabolic profiles in Korean children: a prospective cohort study. Cardiovasc. Diabetol.. 2016;15(1):1-8.
- [Google Scholar]
- Inactivating variants in ANGPTL4 and risk of coronary artery disease. N. Engl. J. Med.. 2016;374(12):1123-1133.
- [Google Scholar]
- Espes, D., Martinell, M., & Carlsson, P.-O. (2014). Increased circulating betatrophin concentrations in patients with type 2 diabetes. International Journal of Endocrinology, 2014.
- Circulating betatrophin correlates with atherogenic lipid profiles but not with glucose and insulin levels in insulin-resistant individuals. Diabetologia. 2014;57:1204-1208.
- [Google Scholar]
- An explanation for recent discrepancies in levels of human circulating betatrophin. Diabetologia. 2014;57:2232-2234.
- [Google Scholar]
- Elevated circulating lipasin/betatrophin in human type 2 diabetes and obesity. Sci. Rep.. 2014;4(1):5013.
- [Google Scholar]
- Relationship of betatrophin with youth onset type 2 diabetes among Asian Indians. Diabetes Res. Clin. Pract.. 2015;109(1):71-76.
- [Google Scholar]
- Circulating betatrophin concentrations are decreased in human obesity and type 2 diabetes. J. Clin. Endocrinol. Metab.. 2014;99(10):E2004-E2009.
- [Google Scholar]
- Hou, G., Tang, Y., Ren, L., Guan, Y., Hou, X., & Song, G. (2020). The ANGPTL8 rs2278426 (C/T) polymorphism is associated with prediabetes and type 2 diabetes in a han Chinese population in Hebei province. International Journal of Endocrinology, 2020.
- Increased circulating levels of betatrophin in newly diagnosed type 2 diabetic patients. Diabetes Care. 2014;37(10):2718-2722.
- [Google Scholar]
- Effects of a diet with or without physical activity on angiopoietin-like protein 8 concentrations in overweight/obese patients with newly diagnosed type 2 diabetes: a randomized controlled trial. Endocr. J.. 2019;66(1):89-105.
- [Google Scholar]
- The potential role of angiopoietin-like protein-8 in type 2 diabetes mellitus: a possibility for predictive diagnosis and targeted preventive measures? EPMA Journal. 2019;10:239-248.
- [Google Scholar]
- Circulating angiopoietin-like proteins in metabolic-associated fatty liver disease: a systematic review and meta-analysis. Lipids Health Dis.. 2021;20(1):55.
- [Google Scholar]
- Caloric restriction and exercise increase plasma ANGPTL4 levels in humans via elevated free fatty acids. Arterioscler. Thromb. Vasc. Biol.. 2009;29(6):969-974.
- [Google Scholar]
- Li, S., Liu, D., Li, L., Li, Y., Li, Q., An, Z., . . . Tian, H. (2016). Circulating betatrophin in patients with type 2 diabetes: a meta-analysis. Journal of diabetes research, 2016.
- Association of ANGPTL8 and Resistin with diabetic nephropathy in type 2 diabetes mellitus. Front. Endocrinol.. 2021;12:695750
- [Google Scholar]
- Regulation of triglyceride metabolism by Angiopoietin-like proteins. Biochimica et Biophysica Acta (BBA)-Molecular and Cell Biology of. Lipids. 2012;1821(5):782-789.
- [Google Scholar]
- Exome sequencing, ANGPTL3 mutations, and familial combined hypolipidemia. N. Engl. J. Med.. 2010;363(23):2220-2227.
- [Google Scholar]
- Global, regional, and national prevalence of overweight and obesity in children and adults during 1980–2013: a systematic analysis for the Global Burden of Disease Study 2013. Lancet. 2014;384(9945):766-781.
- [Google Scholar]
- Regulation of angiopoietin-like proteins (ANGPTLs) 3 and 8 by insulin. J. Clin. Endocrinol. Metab.. 2015;100(10):E1299-E1307.
- [Google Scholar]
- Obesity and loss of disease-free years owing to major non-communicable diseases: a multicohort study. Lancet Public Health. 2018;3(10):e490-e497.
- [Google Scholar]
- Obesity phenotypes, diabetes, and cardiovascular diseases. Circ. Res.. 2020;126(11):1477-1500.
- [Google Scholar]
- Type 2 diabetes mellitus and its effect on quality of life in adolescents: A retrospective cohort study in Saudi Arabia. Pediatr. Endocrinol. Diabetes Metab.. 2022;28(1):54-63.
- [Google Scholar]
- Serum ANGPTL8 and ANGPTL3 as predictors of triglyceride elevation in adult women. Metabolites. 2022;12(6):539.
- [Google Scholar]
- Increased serum levels of betatrophin in pancreatic cancer-associated diabetes. Oncotarget. 2016;7(27):42330.
- [Google Scholar]
- Angiopoietin-like 3 inhibition of endothelial lipase is not modulated by angiopoietin-like 8. J. Lipid Res.. 2021;62
- [Google Scholar]
- Mice lacking ANGPTL8 (Betatrophin) manifest disrupted triglyceride metabolism without impaired glucose homeostasis. Proc. Natl. Acad. Sci.. 2013;110(40):16109-16114.
- [Google Scholar]
- Circulating betatrophin is elevated in patients with type 1 and type 2 diabetes. Endocr. J.. 2015;62(5):417-421.
- [Google Scholar]
- Lipasin, a novel nutritionally-regulated liver-enriched factor that regulates serum triglyceride levels. Biochem. Biophys. Res. Commun.. 2012;424(4):786-792.
- [Google Scholar]
- The ANGPTL3-4-8 model, a molecular mechanism for triglyceride trafficking. Open Biol.. 2016;6(4):150272
- [Google Scholar]


