

Impact of 5D regularization and interpolation on subsurface imaging: A case study of Stratton field, South Texas, United States of America
⁎Corresponding author at: Department of Geology and Geophysics, King Saud University, Riyadh, Saudi Arabia. khassanein@ksu.edu.sa (Kamal Abdelrahman)
-
Received: ,
Accepted: ,
This article was originally published by Elsevier and was migrated to Scientific Scholar after the change of Publisher.
Peer review under responsibility of King Saud University.
Abstract
This case study aims to determine the effect of five-dimensional regularization and interpolation on seismic subsurface imaging, particularly focusing on impacts to noise attenuation, velocity analysis, and migration. Advanced seismic processing requires high fold coverage and regular cross-spread data to attain good noise attenuation and common offset vectors for appropriate migration. Complex geological scenarios pose substantial challenges for subsurface imagers and interpreters. Stratton Field, USA, contains a major fault, Agua Dulce, along with many smaller faults and thus requires dense acquisition for high-resolution subsurface imaging to reduce migration smiles. Data were processed twice, the first migration without 5D regularization and interpolation and the second with 5D regularization and interpolation. The migration without 5D regularization and interpolation was found to suffer from acquisition footprints, migration smiles and a lack of amplitude versus offset (AVO) behavior, whereas the subsurface image was enhanced with 5D regularization and interpolation and improved in terms of AVO behavior.
Keywords
Five-dimensional regularization
Interpolation
Seismic subsurface imaging
Noise attenuation
Velocity analysis
Migration

1 Introduction
Oil and gas companies require dense 3D seismic geometric data to enhance subsurface images, particularly in the case of complex subsurface structures and complicated stratigraphy. However, in the 1990s, most acquisitions were not as dense as that conducted at the Stratton Field in 1992. Stratton Field is located in south Texas, USA, between the counties of Nueces and Kleberg (El-Mowafy and Marfurt, 2016). Fig. 1 shows the site of the 3D seismic survey of this field and of the related Agua Dulce and Vicksburg faults, which cause parallel and large rollover anticlines trending southwest-northeast. Advanced seismic processing methods require regularized and interpolated input data; therefore, irregularly spaced sampled data must be transformed into regular sampled data to avoid seismic data processing problems.
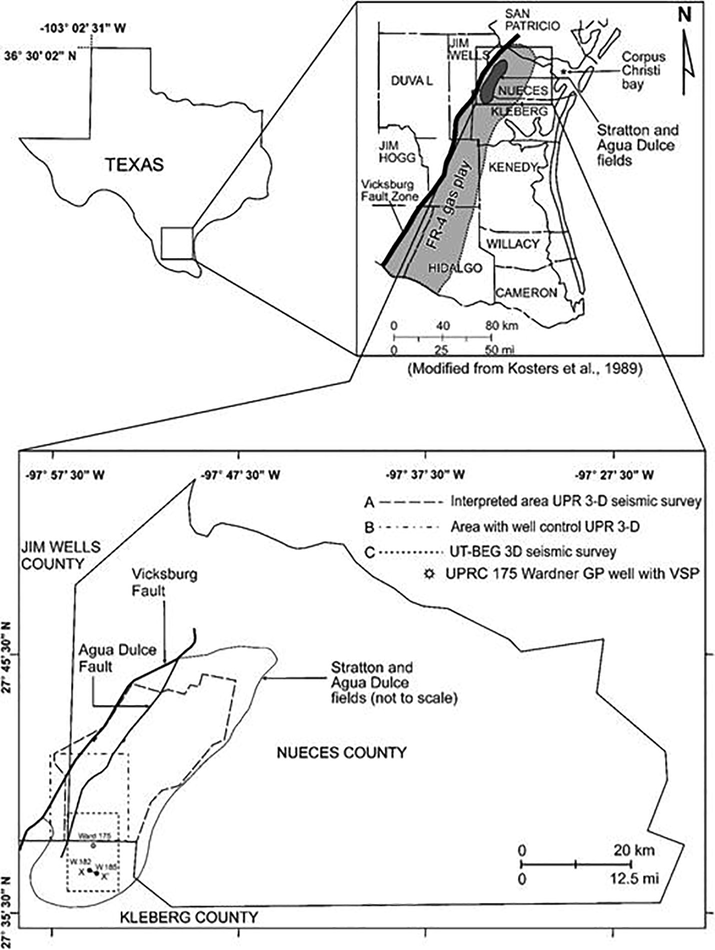
- Location of Stratton Field, south Texas, USA, including the Agua Dulce and Vicksburg faults. The oil field is located between the counties of Nueces and Kleberg. The two major faults, Agua Dulce and Vicksburg, are parallel and large rollover anticlines trending southwest-northeast.
Data can be regularized using Fourier’s theory and through implementing estimation methods that locate frequency on an irregular grid (Xu et al., 2005). After the estimation of Fourier coefficients, data can be reconstructed on any grid. As Fourier regularization aims to fill gaps in seismic data, its density increase makes it adequate for constructing common offset vectors (COVs). The bin size of the geometry is determined by the spacing of the receivers and shots on lines that define the cross-spread (Poole et al., 2009). Data that are regularized in the shots and receivers improve the signal-to-noise ratio, coherency, and the alignment of reflection events (Chopra and Marfurt, 2013).
Regularization and interpolation can be applied to many different domains; for example, if there are missing receivers, data interpolation is applied on the shot gather, and vice versa (Vermeer, 2002). In complex geology, 5D regularization and interpolation techniques provide significant improvements, allowing seismic data inputs to be densely sampled on a regular grid without spatial aliasing in such directions such as IL, XL and COV (Xu et al., 2010).
Irregular shot and receiver lines will affect noise attenuation on the cross-spread (Fig. 5A) for ground rolls and guided wave removal. Ground rolls and guided wave noises are typical issues when acquiring land data (Le Meur et al., 2010). These wave types are partially aliased and the main characteristics of ground rolls are low velocities, low frequencies and high amplitudes (Chen et al., 2015). Fig. 5C shows irregularities, i.e., missing data affecting noise attenuation (NA), in the crossline direction of the cross-spread. Furthermore, common midpoint (CMP) gathers and mini-stacks are difficult to identify in the velocity spectrum (Fig. 4A).
Irregular shot lines and receivers also affect the migration of COVs, as regularizing data is an important step prior to performing the Kirchhoff migration to deactivate post-migration noise and enhance subsurface images (Poole and Herrmann, 2007). Pre-migration COV domains rely on symmetrical reflected energy from reflection layers (with a CMP as in P-waves) and receivers and sources in the same acquisition survey datum (Vinje et al., 2015). The Stratton Field 1992 seismic survey (SEG wiki seismic open source data) contains irregular shots and empty CMP bins that cannot be properly processed in cross-spread and COVs domains. Therefore, Stratton Field is a good case study through which we can analyze the impact of 5D regularization and interpolation.
2 Materials and methods
To improve the Stratton Field 3D seismic data subsurface image, several steps were required, as shown in the flow chart (Fig. 2), beginning with reformatting the data, amplitude recovery, the removal of high-frequency noise, constant velocity picking, angle muting, and 5D regularization and interpolation in the shot and receiver domain for pre-processing. 5D (shot x, shot y, receiver x, receiver y, and frequency) regularization and interpolation was applied after high-frequency noise removal to avoid interpolating high frequencies. This data set accrued parameters and preconditioning data, setting the appropriate parameters for its application to the original data. The use of 5D regularization and interpolation requires velocity. As the data are still noisy, constant velocity picking and angle muting was performed after high-frequency noise removal to model the 5D regularization and interpolation. Interpolation was undertaken on the frequency-wavenumber domain FK to create missed shots and receivers. Three grids are required for this 5D process: the first is the regular geometry grid, the second is for the source, and the third for the receivers.
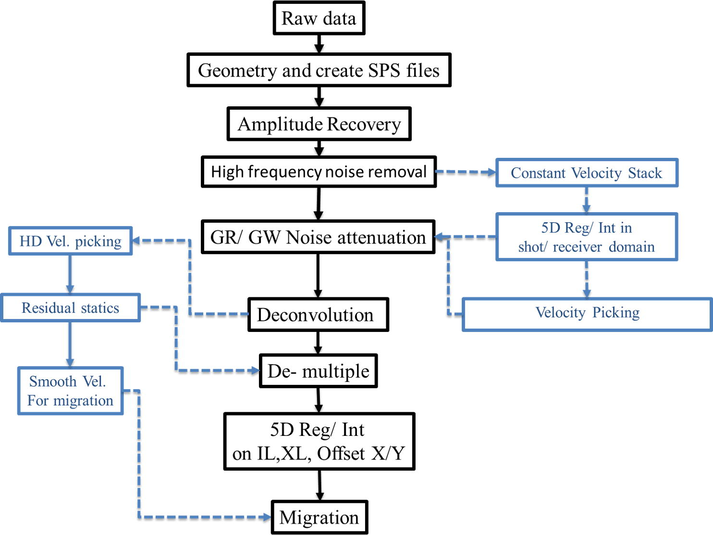
- Methodology workflow. Black boxes represent the main seismic data flow and blue boxes reflect preconditioning of the data, starting from reading the SEGY shot gathers and reformatting and extracting the missing SPS files from data headers. After the geometry, amplitude recovery is conducted using time amplitude function 2, and the removal of high-frequency noise is necessary to avoid interpolation. For 5D regularization and interpolation (shot x, shot y, receiver x, receiver y, and frequency), velocities are required as this is done by constant velocity stacking. Velocity picking was undertaken after 5D regularization and interpolation, and used to model and to remove the ground roll and guided wave. Gap deconvolution 24 was applied. Dense velocity picking and residual statics for preconditioning the data were conducted before the de-multiples. 5D regularization and interpolation (inline, crossline, offset class x, offset class y, and frequency) was applied before migration in the main work flow. The data set was sorted on the COV domain before migration. Finally, Kirchhoff migration is performed.
Cross-spreading without 5D regularization and interpolation is complicated; it is difficult to set the parameters for noise attenuation (NA) as this requires a range of velocities for both the ground roll and the guided wave and for the estimation of frequencies. The cross-spread gather domain is necessary to remove ground roll noises with consecutive applications of receiver/shot domains using f/k or 3D velocity filters Poole et al., 2009). After 5D interpolation, the missing cross lines are interpolated and used to fill the empty CMP bins to complete the seismic volume. Thus, the application of 5D regularization and interpolation enhances the cross-spread, which is accordingly regularized to identify the GR and GW velocities and their frequency ranges.
Subsequent to using the first 5D datset (shot x, shot y, receiver x, receiver y, and frequency) to precondition and set the appropriate parameters on the data, another 5D dataset (inline, crossline, offset class x, offset class y, and frequency domain) was applied before migration in the main work flow. These data were sorted on the COV domain prior to migration. Applying 5D regularization and interpolation is recommended prior to migration to assure consistent amplitudes and reduce the footprint of pre-stack time migration (PSTM) (Wang and Wang, 2014). Migration of the offset vector tiles and COV domains facilitates an azimuth-dependent anisotropy analysis. As a COV domain creates a single fold, it is ideal to provide sampled in-lines, cross lines, and offset coordinates for migration. The single fold in each COV can provide a clean subsurface image that limits migration smiles while maintaining the amplitude vs. offset character (Fomel, 2000). The migration process and AVO analysis observed during the migration can be affected by empty CMP bins as this is based on the principle of destructive and constructive interference of data. Most 3D geometry acquisitions contain poor sampling as they are sensitive to coarse sampling and irregular datasets (Trad, 2009).
3 Quality control
The main QC tool used for developing the processing sequence of the Stratton 3D 1992 field is to visualize cross-spread gathers, fractures and faults resolution on PSTM stacks and the offset/azimuth stacks with fk spectra. Fig. 3A shows the lack in offset/azimuth stacks before applying 5D regularization and interpolation causing a poor signal-to-noise ratio as the azimuth was divided into four sectors (90 degrees for each sector). On the other hand, the offset/azimuth stack after applying 5D regularization and interpolation was fully interpolated and regularized (Fig. 3B). Improvements in the offset/azimuth stacks result mostly from interpolating the data in the additional two dimensions as indicated (Fig. 3C and D). In Fig. 3G, the primary signal is shown to be enhanced subsequent to 5D regularization and interpolation compared with the vintage data.
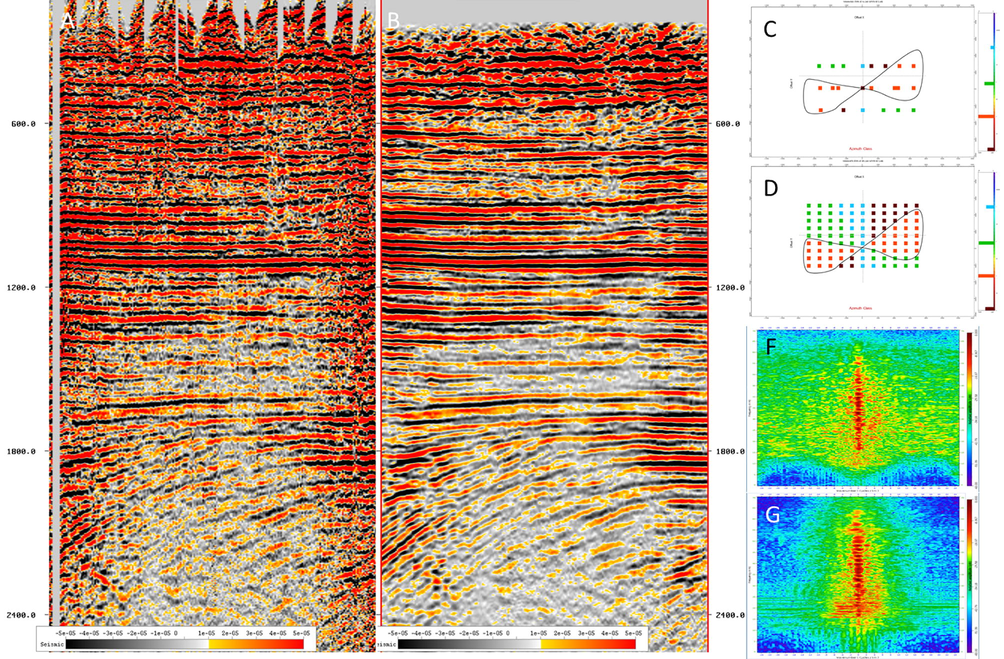
- The main QC tool used to analyze the effects of 5D regularization and interpolation. (A) An example of the azimuth stack on in-line 240, where data are missing near the surface and the stack contains high-frequency, non-continuous geological layers. (B) An example of the azimuth stack on in-line 240, where full data are apparent at the near surface and with continuity in geological settings. (C) Azimuth sector with offset class X/Y, where missing and irregular traces are apparent, whereas on the other hand (D) has full regular traces in the traces bin. (F-G) FK spectrum window (100 ms–2800 ms) before 5D (top) and after 5D (bottom), showing that noise was reduced after 5D regularization and interpolation.
4 Results
5D regularization and interpolation (shot x, shot y, receiver x, receiver y, and frequency) assisted in the determination of parameters for the pre-processing and velocity analysis. Some difficulty was encountered in the velocity picking of data without 5D even after preconditioning the data for velocity analysis, as shown in Fig. 4A. Furthermore, velocity picking was much easier in the case of 5D data. The energy of the spectrum, reflected energy in the CDP, and the mini-stacks were much clearer, as shown in Fig. 4B.
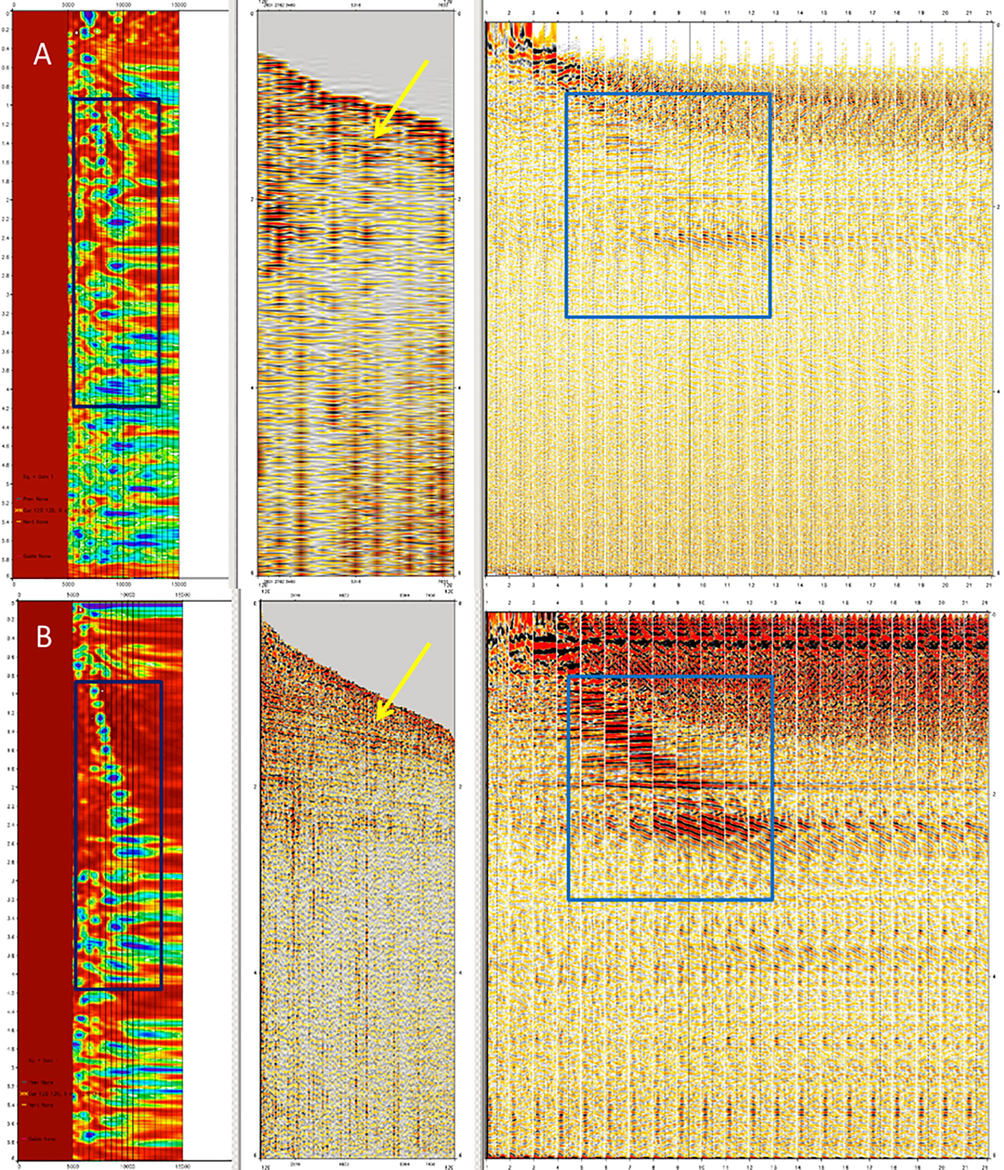
- (A) Velocity analysis without 5D regularization and interpolation; the energy spectrum (energy interference shown in the dark blue box) is on the left, the common midpoint gathers produced as a result of no hyperbola events is shown in the center, and mini-stacks are shown on the right. (B) Velocity analysis with 5D regularization and interpolation; the energy spectrum in which energy spots are clear is on the left, the common midpoint gather produced a result of hyperbola events is in the center, and mini-stacks with clear events are on the right.
The cross-spread without 5D regularization and interpolation was complicated; in particular, it was difficult to set the parameters for NA. Fig. 5 shows an example of the effect of 5D regularization and interpolation in a cross-spread gather. The GR on the cross-spread without 5D regularization and interpolation still exists, whereas the GR cross-spread with 5D regularization and interpolation does not.
- Cross-spread in an inline direction showing adaptive attenuation on the GR/GW for noise attenuation under the following conditions: (A) without 5D regularization and interpolation, indicating that adaptive noise attenuation did not work in the ground roll due to missing data, (B) with 5D regularization and interpolation, in which the ground roll disappears in the inline direction, (C) without 5D regularization and interpolation, indicating missing data in the crossline direction, and (D) with complete data in the crossline direction in the cross-spread.
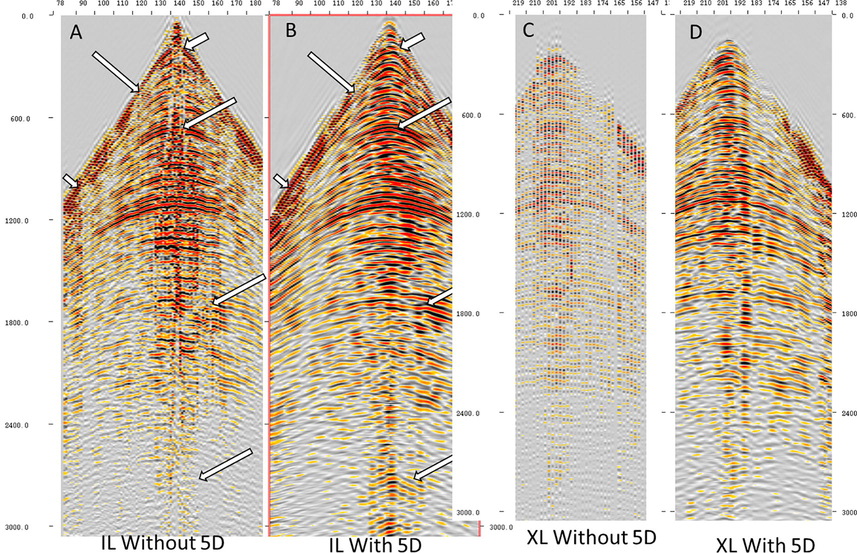
Migration smiles appeared on the migrated cube without 5D regularization and interpolation (inline, crossline, offset class x, offset class y, and frequency domain). Owing to missing and irregular traces in the bin, such smiles clearly appear on the diffraction areas, although they are depressed in the 5D regularization and interpolation processed data (Fig. 6).
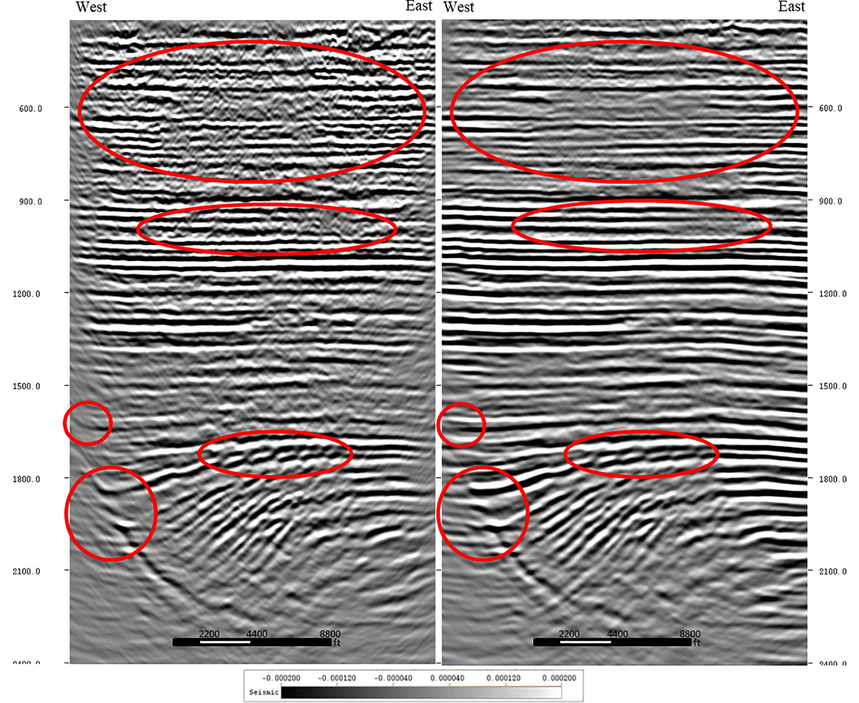
- The left-hand side shows PSTM without 5D regularization and interpolation, containing migration smiles inside the red circles. The right-hand side shows PSTM with 5D regularization and interpolation, in which no migration smiles are noted.
Two angle cubes were created: near (0–10 degrees) and mid (10–35 degrees). Fig. 7 shows the case without the 5D cube, wherein no hot spots were detected. The case with the 5D cube shows improvements in amplitude versus offset (AVO). The maximum offset was approximately 8000 feet, and owing to this small offset, the far offset was not found to be useful. An anomaly between the two angle stacks was spotted in the B46 and F21 reservoirs. Based on the amplitude variation with offset, class I was spotted and the hot spot was detected on the seismic cube (Fig. 8).
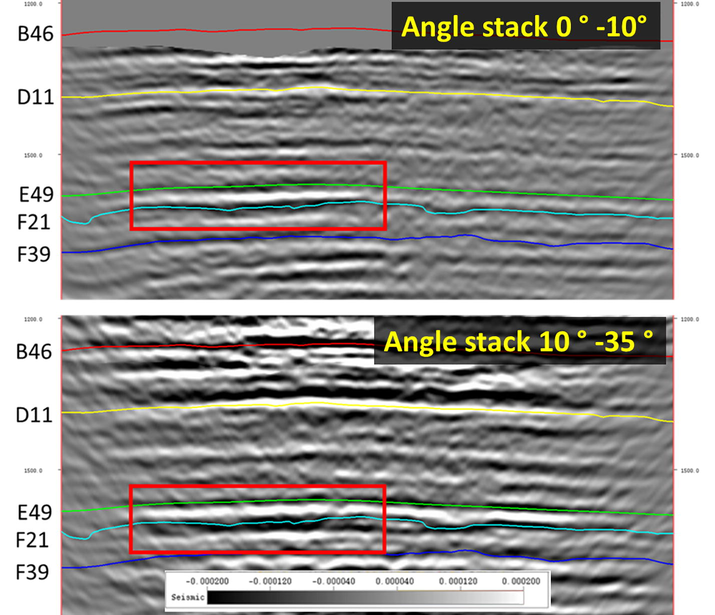
- Angle stacks for 0–10 degrees and 10–35 degrees, which no hot spot was observed. Different colors reflect different horizons.
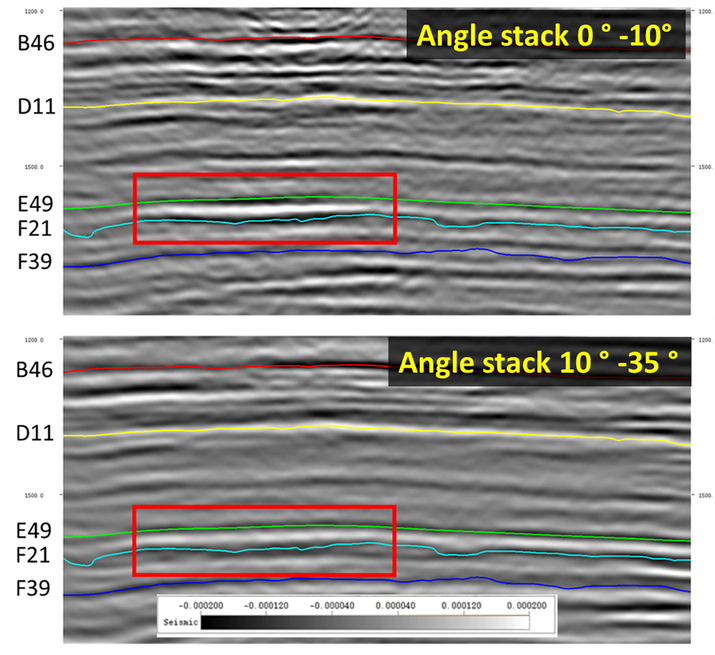
- (A) Display angle with the 5D angle stack (0–10 degrees), showing a hot spot between horizon B46 and D11. (B) Display with the 5D angle stack (10–35 degrees), where a hot spot is observed on the 0–10 degree angle stack and was reduced in the 5D 10–35 degree angle stack as it is class I.
5 Discussion and conclusions
The application of 5D regularization and interpolation to seismic imaging helps to reduce the migration smiles that result from bad geometry layout and can cause gaps in seismic data. This process is also effective for shallow structures, subsurface imaging of complex geology, and the NA of ground rolls and guided waves. In addition, it enhances the energy sampling and improves CMP gathers and mini CVS for velocity analysis. 5D regularization and interpolation provides high resolution in flat structures.
5D regularization and interpolation is an extremely sensitive process and, as such, the domain and sorting of the data will lead to different results. This is particularly true for complex geological cases, where it may affect both the amplitude and nature of geological fractures.
Irregular cross-spreads leading to leaks in ground roll and guided wave NA were acquired from a case study of Stratton Field, USA. Using regularized and 5D interpolation sorted by (shot x, shot y, receiver x, receiver y, and frequency) cross-spread data, we obtained improved ground roll and guided wave NA. Missing data caused difficulties in velocity estimation or picking owing to poor signal-to-noise ratios. As this was improved by the interpolation of missing traces, the interpolation and regularization was found to enhance the signal-to-noise ratio such that the subsurface geology became more continuous in the reflected layer and the energy of the spectrum was increased.
For interpretation and the AVO analysis, it is necessary to enhance the signal-to-noise ratios and increase fold coverage to eliminate the migration smiles. This has been solved through five-dimensional regularization and interpolation sorted by (inline, crossline, offset class x, offset class y, and frequency domain). Thus, 5D regularization and interpolation is extremely effective in cases of complex geology as it considers the azimuth during the interpolation. The dipping layer exhibits a sinusoidal pattern with the azimuth, and it is thus possible to correct the dip. Time shifts are a function of the input trace offset, azimuth, travel time, and the dip and direction of the dipping layer. In contrast, 5D regularization and interpolation sorted in shots and receivers can eliminate dipping structures, faults, and fractures in complex geology.
Acknowledgements
We sincerely thank SEG wiki and the Bureau of Economic Geology at the University of Texas, Austin, for the data and ARGAS Technology center. We extend our appreciation to the Deanship of Scientific Research at King Saud University for funding this work through the research group No. RGP -1436-011. Great thanks to the reviewers for their beneficial review and valuable comments.
Declaration of Competing Interest
The authors declare that they have no known competing financial interests or personal relationships that could have appeared to influence the work reported in this paper.
References
- Ground-roll noise attenuation using a simple and effective approach based on local band-limited orthogonalization. IEEE Geosci. Remote Sensing Lett.. 2015;12(11):2316-2320.
- [Google Scholar]
- Preconditioning seismic data with 5D interpolation for computing geometric attributes. Leading Edge.. 2013;32(12):1456-1460.
- [Google Scholar]
- Quantitative seismic geomorphology of the middle Frio fluvial systems, south Texas, United States. AAPG Bull.. 2016;100(4):537-564.
- [Google Scholar]
- Fomel, S., 2000. Three-dimensional seismic data regularization. http://www.academia.edu/ 289171/Three-dimensional_seismic_data_regularization.
- Poole, G., Herrmann, P., 2007. Multidimensional data regularization for modern acquisition geometries. InSEG Technical Program Expanded Abstracts 2007, Society of Exploration Geophysicists, pp. 2585–2589.
- Poole, G., Trad, D., Wombell, R., Williams, G., 2009. Regularisation for Wide Azimuth Datasets. InEAGE Workshop on Marine Seismic-Focus on Middle East and North Africa.
- Trad, D., 2009. Five-dimensional interpolation: Recovering from acquisition constraints. Geophysics, 74 (6), V123–V132 doi:10.1190/1.3245216.
- Vermeer, G.J., 2002. 3-D seismic survey design. Society of Exploration Geophysicists.
- Vinje, V., Zhao, P., Gaiser, J., 2015. Offset vector tile gather extension and weighting to reduce footprint in dual-datum and converted-wave migration. InSEG Technical Program Expanded Abstracts 2015, Society of Exploration Geophysicists, pp. 2103–2107.
- Wang, S., Wang, J., 2014. 5D interpolation/regularization and COV/OVT PSTM for converted-wave (PS) data. InSEG Technical Program Expanded Abstracts 2014, Society of Exploration Geophysicists, pp. 3584–3588.
- Xu, S., Zhang, Y., Pham, D., 2005. Anti-Leakage Fourier Transform for seismic data regularization. Regularization, 70, V78–V95.
- Xu, S., Zhang, Y., Lambaré, G., 2010. Antileakage Fourier transform for seismic data regularization in higher dimensions. Geophysics. 75(6), WB113–120.


