

Translate this page into:
Immunotoxic potential of nanoparticles of cerium oxide and gadolinium oxide in human monocyte (THP-1) cells
⁎Corresponding author at: King Abdullah Institute for Nanotechnology (KAIN), King Saud University, P.O. Box 2454, Riyadh 11451, Saudi Arabia. mjakhtar@ksu.edu.sa (Mohd Javed Akhtar)
-
Received: ,
Accepted: ,
This article was originally published by Elsevier and was migrated to Scientific Scholar after the change of Publisher.
Peer review under responsibility of King Saud University.
Abstract
Objectives
NPs of cerium oxide (CeO2) and gadolinium oxide (Gd2O3; designated as GO for simplicity) belong to the lanthanide group of elements. Due to the potential applications of GO NPs in MRI or CeO2 NPs as novel antioxidant, attention about their impact on the immune-toxicity is needed.
Methods
Potential immune-toxicity response due to interactions of GO NPs (54.8 ± 29 nm in length and 13.7 ± 6 nm in diameter with a fiber-like shape) and CeO2 NPs (40 ± 17 nm with a cuboidal shape) was examined in human monocytic THP-1 cells exposed for 24 h, 48 h and 72 h. A battery of parameters intended to measure oxidative stress and mechanism of cell death, if occurring, in THP-1 cells exposed to NPs for the periods as mentioned above was also examined.
Results
NPs of GO induced higher toxicity and oxidative stress than it was by NPs of CeO2. Interestingly, CeO2 NPs behaved as antioxidant when exposed for 24 h at concentrations of 100- and 200 µg/mL. This trend, however, reversed at 72 h of exposure that resulted in induction of significant cytotoxicity, reactive oxygen species (ROS) and exhaustion of cellular antioxidant glutathione (GSH). Cuboid CeO2 NPs with low potential to induce toxicity and oxidative stress caused a rise in Bax/Bcl2 ratio and caspase 3 apoptotic markers in THP-1 cells. Lack of these apoptotic markers in more toxic fiber-like GO NPs treated THP-1 cells indicate an apoptosis-independent mechanism of cell death by GO NPs. Although, CeO2 NPs caused induction of interleukin-1β (IL-1β) after 72 of exposure, CeO2 NPs did not induce tumor necrosis factor-α (TNF-α) at any duration of exposure.
Conclusion
Despite belonging to same rare-earth metal groups in lanthanide series, NPs of GO and CeO2 induce different bio-responses in human immune THP-1 cells. GO NPs were highly inflammatory than the NPs of CeO2. To the best of our knowledge, this is the first report on comparative analysis carried out for these NP’s potential cytotoxicity, oxidative stress and inflammation in THP-1 cells.
Keywords
Nanoparticles
Immunotoxicity
ROS
Glutathione
Inflammation

1 Introduction
Nanoparticles (NPs) of cerium oxide (CeO2) and gadolinium oxide (Gd2O3; designated as GO for simplicity) belong to the lanthanide groups of elements (Ge et al., 2016). NPs of GO have been reported to have promising role as antimicrobial agent, in therapeutic agents and as nano-vaccine (Akhtar et al., 2022; Ortega-Berlanga et al., 2020). NPs that have biomedical oriented applications are most likely to interact with human body and can pose potential health hazard. One of the such applications is the diagnosis of diseases using magnetic resonance imaging (MRI). At the core of MRI are the different kinds of contrast agents. Most of the contrast agents are based on gadolinium element (or gadolinium compounds) in MRI (Kuo et al., 2016; Rogosnitzky and Branch, 2016). Moreover, in hope of improving diagnostic capacity of MRI, GO NPs are being examined in preclinical models (Anishur Rahman et al., 2013). Whatever the form used of gadolinium in MRI, concerns are increasing due to several reports about deposition of gadolinium in the tissues of patients undergoing MRI (Olchowy et al., 2017; Rogowska et al., 2018). Gadolinium element has been reported to enter the circulatory system and traces have been found in liver, breast, kidney, lung and neural tissues (Rogosnitzky and Branch, 2016). Post-mortem analysis in the brain tissue has revealed gadolinium traces in endothelial walls and neuronal interstituium (McDonald et al., 2017). Similarly, NPs of CeO2 are interesting to researchers due to their potential as a novel antioxidant and anti-inflammatory agent (Akhtar et al., 2017; Das et al., 2007). In summary, these NPs have exhibited remarkable bio-compatibility and protective potential in human skin fibroblasts, cardiac progenitor cells, human breast MCF-7 cells and fibrosarcoma cells against several exogenously applied molecules/agents inducing oxidative stress and toxicity (Akhtar et al., 2018).Table 1.
Physico-chemical Parameters
CeO2 NPs
Gd2O3 NPs
Colour
White powder
White powder
Morphology by SEM and TEM
Cuboidal
Nanofibers
Structural characterization by TEM and XRD
Crystalline
Crystalline
Elemental composition by EDS
Ce and O, no other impurities detected
Gd and O, no other impurities detected
Primary TEM size
Rhomboid or cuboidal with average particle size of 40 ± 17 nm
Fibrous with particle aspect ratio of over 5; average particle diameter of 13.7 ± 6 nm and average particle length of 54.8 ± 29 nm
DLS in complete culture media
Hydrodynamic size
140 ± 66 nm
490 ± 42 nm
Zeta potential
–23 ± 3 eV
−18 ± 3 eV
DLS in pure water
Hydrodynamic size
292 ± 101 nm
1100 ± 130 nm
Zeta potential
−14 ± 2 eV
−10 ± 2 eV
Despite of belonging to same group of periodic Table, these NPs are considered as differently as their potential application in various fields is anticipated. From a biomedical point of view, the two NPs have generated very different biological end-result in pre-clinical models. While the reporting about bio-responses and associated mechanism with GO NPs is relatively recent in comparison of CeO2 NPs, potential of these NPs in possible improvement of MRI does have some scientific backing now. Overall, both NPs share promising potential in serving in biomedical application although for different reasons. Being used as anti-oxidant or as diagnostic agents in MRI, NPs of CeO2 or GO could interact with several components of vascular and immune system eliciting immune-response (Engin and Hayes, 2018). Therefore, NPs with potential applications in biomedical science need special attention about their impact on the cross-roads of cytotoxicity, oxidative stress and immune system (Engin and Hayes, 2018). In the present study, immunotoxicity of NPs of GO and CeO2 was assessed in a relevant cell line- THP-1 cell- derived from human monocytic cell which is an established in vitro cell model for immune modulation research (Chanput et al., 2014; Deng et al., 2021). Most NPs are recognized as foreign particles by the immune system and may be, thus, potential agent to modulate immunogenicity at varying degree in various biological models (Luo et al., 2015). Undesirable immune-response due to NPs, despite promising scenario in other aspects, may lead to harmful effects. Therefore, the primary objective of this investigation was to evaluate a comparative analysis about their immunotoxicity since both NPs belong to same lanthanide group. Recall, chemical composition is regarded as the primary criteria of characterizing different NPs for regulatory purposes (Lynch et al., 2014). The mechanism of syntheses and details of physico-chemical characterization have been recently published for CeO2 NPs (Akhtar et al., 2021) and GO NPs (Akhtar et al., 2020). A comprehensive data on potential cytotoxicity, oxidative stress and inflammation of two lanthanide NPs is provided in human THP-1 cells. To the best of our knowledge, there is a serious lack of knowledge about the possible response of these related NPs in immune cells like THP-1. We believe, a comparative data regarding immune-toxicity will serve as a useful reference for the future research.
2 Materials and methods
2.1 Chemical and reagents
Fetal bovine serum and penicillin–streptomycin was purchased from Invitrogen Co. (Carlsbad, CA, USA). RPMI-1640, MTT [3-(4,5-dimethyl thiazol-2-yl)-2,5-diphenyl tetrazolium bromide], perchloric acid, DCFH-DA, GSH, o-phthalaldehyde (OPT), Hank’s balanced salt solution (HBSS) and Bradford reagent were obtained from Sigma–Aldrich, MO, USA. Kits for IL-1β and TNF-α were purchased from Abcam. Ultrapure water was taken from a Milli-Q system (Millipore, Bedford, MA, USA). All other chemicals used were of reagent grade.
2.2 Preparation and characterization of CeO2 and Gd2O3 (or GO) NPs
NPs were characterized under transmission electron microscopy (FETEM, JEM-2100F, JEOL, Inc., Japan) for their shapes and sizes. Powder X-ray diffraction (PXRD) technique was used for crystallinity determination using Cu-Kα radiations of wavelength 1.54060 Å. XRD data were collected in the 2θ range of 20 to 80ο at a scan rate 0.02°/s. Hydrodynamic properties of NPs were evaluated by the use of a dynamic light scattering system (DLS) (Malvern Instruments, Malvern, UK) as detailed in previous publications (Akhtar et al., 2020; Akhtar et al., 2021). NPs of CeO2 appeared as cuboidal in shape with an average size of 37 ± 9 nm whereas NPs of GO came out to be fiber-like in shape with an average of 54.8 ± 29 nm for the length and 13.7 ± 6 nm for the width of GO NPs.
2.3 Cell culture and treatment with NPs
The human monocytic (THP1; ATCC US) cell were cultured in RPMI-1640 medium supplemented with 15 % foetal bovine serum and 10 mL antibiotic/antimycotic solution per liter of culture media. Cells were maintained in a 5 % humidified CO2 incubator at 37 °C. A cell suspension density 1 to 5 × 10⁵ cells/mL was maintained in culture. A THP-1 cell seeding density of 1 to 5 × 10⁵ cells/mL was used in experiments depending on exposure periods; shorter the exposure periods, higher was the cell density and vice-versa. THP-1 cell suspension without treatment served as negative control in each experiment.
2.4 MTT assay
Different concentrations of NPs were exposed for 24- and 48 h to THP1 cells differentiated in macrophage-like cells as described above. After completion of exposure periods in 96 well plates, 20 µL of freshly prepared MTT solution in HBSS (5 mg/mL filtered with a 0.22 µ pore size syringe filter) was added for 2 h in CO2 incubator as described by Mosmann (1983). Blue formazan, thus, formed upon reduction of yellow MTT by dehydrogenases of viable cells were solubilized, centrifuged, and absorbance at 570 nm was taken in a plate reader (Synergy HT, Bio-Tek, Winooski, Vermont, USA). The mean absorbance of untreated cells was taken as 100 % cell viability. Cell viability of treated cells were expressed as % age to that of untreated control cells.
2.5 Cytokines assay by ELISA
THP-1 cells were grown in 24-well plates and treated as described above. After 24 h of exposure of NPs, cell culture supernatant was collected by centrifugation at 3000 rpm for 5 min at a room temperature of 24 °C. In the collected supernatant, IL-1β and TNF-α were examined according to the protocols of the ELISA kits (ab181421, human TNF-α ELISA kit; ab100562, human IL-1β ELISA kit) from the manufacturer (Abcam, Discovery Drive, Cambridge Biomedical Campus, Cambridge, CB2 0AX, UK). A specific antibody was employed in the measurement with the IL-1β ELISA kit (#ab100562). Cell culture supernatants (100 µL) from control and treated cells were pipetted into the antibody-immobilized insert-wells and incubated for 3 h at room temperature. After washing wells four times with the supplied wash solution, 100 µL of biotinylated anti-human IL-1β antibody was added for 1 h with gentle shaking. After washing away unbound biotinylated antibody with wash solution four times, HRP-conjugated streptavidin was pipetted to the wells and left for 45 min. After washing again four times, a TMB substrate solution (100 µL) was added for 30 min. Absorbance at 450 nm was immediately taken after adding stop solution (50 µL). A standard of IL-1β was prepared in assay diluent B and run similarly for calculation purposes.
2.6 Measurement of intracellular ROS
The potential induction of ROS was determined by 2′, 7′-dichlorofluorescin diacetate (DCFH-DA) probe (Wang and Joseph, 1999) that was incubated for 45 min at the final concentration of 50 µM after the treatment period was over. The plate was washed thrice with cold HBSS to remove excess dye from each well, and the intensity of DCF fluorescence was taken at 528 nm in the plate reader (Synergy HT, Bio-Tek, Winooski, Vermont, USA).
2.7 Determination of lipid peroxidation
The basic mechanism of membrane damage caused by lipid peroxidation (LPO) in fatty acids was quantified by the method of Ohkawa et al. (1979). After each exposure period, cells were collected by centrifugation at 2000×g for 5 min at 4 °C. Cell pellets were lysed and protein content was determined. A 200 μL from each lysate was incubated with 800 μL of LPO assay cocktail {(0.4 % (w/v) thiobarbituric acid, 0.5 % (w/v) SDS, and 5 % (v/v) acetic acid, pH 3.5)} for 60 min at 95 °C. The pinkish absorbance of thiobarbituric acid reactive substances (TBARS) was quantified at 532 nm. Results were calculated as nmol TBARS/mg of cellular protein using 1.56 × 10⁵ M−1cm−1 as molar extinction coefficient of MDA-TBA adduct.
2.8 Evaluation of cellular antioxidant GSH
The cellular content of GSH was quantified according to the method given by Hissin and Hilf (1976). After treatment, cells were lysed in an aqueous solution of 0.1 % deoxycholic acid plus 0.1 % sucrose for 2 h, subjected to 3 freeze–thaw cycles and centrifuged at 10,000×g for 10 min at 4 °C. Supernatant was precipitated in the final concentration of 1 % perchloric acid and centrifuged at 10,000×g for 5 min at 4 °C. Twenty microlitres of the perchloric acid protein-precipitated cell lysate supernatant was mixed with 160 μL of 0.1 M K-phosphate–5 mM EDTA buffer, pH 8.3 and 20 μL o-phthalaldehyde (OPT, 1 mg/mL in methanol) in black 96-well plates. After 2 h of incubation at room temperature in the dark, fluorescence was measured at an emission wavelength of 460 nm (Synergy HT, Bio-Tek, Winooski, Vermont, USA). A standard curve was obtained for calculation from a similarly prepared known concentrations of GSH. The protein in the cell samples was estimated from unprecipitated supernatant, and data were converted to GSH with the nmol/mg protein present in unprecipitated supernatant.
2.9 Assessment of Bax and Bcl2 mRNAs
Expression levels of Bax and Bcl2 mRNAs provide plausible evidence of apoptosis (Paul-Samojedny et al., 2005). Bax and Bcl2 belong to two different gene families involved in the regulation of apoptosis. The overexpression of Bcl2 prevents apoptosis whereas an increase in Bax expression induces apoptosis. That is an increase in the ratio of Bax/bcl2 ratio is indicative of apoptosis and vice-versa (Paul-Samojedny et al., 2005). Levels of mRNA in Bax and bcl2 were determined by real-time PCR (ABI PRISM 7900HT Sequence Detection System, Applied Biosystems, Foster City, CA). Nucleotide sequences of Bax and Bcl2 primers are given in our previous report (Ahamed et al., 2011). The expression of mRNA of Bax and Bcl2 was determined as detailed by Ahamed et al (Ahamed et al., 2011). In brief, total RNA was isolated from treated and control THP-1 cells cultured in 6-well plates. DNA-free RNA was reverse transcribed into cDNA for real-time analysis by a PCR machine as mentioned above. House-keeping gene β-actin was used as a reference point for the expression of Bax and Bcl2 genes.
2.10 Caspase-3 enzyme
Activity of caspase-3 enzyme was determined from cell lysate of control and treated cells as described elsewhere (Akhtar et al., 2022). In brief, 5 × 10⁴ THP-1 cells were seeded in T25 flasks and exposed to NPs and cisplatin. A reaction mixture containing 30 μL of cell lysate, 20 μL of Ac-DEVDAFC (caspase-3 substrate), and 150 μL of protease reaction buffer (50 mM Hepes, 1 mM EDTA, and 1 mM DTT, pH 7.2) was incubated. The fluorescence of the reaction mixture was measured at every 5 min intervals for 15 min at excitation/ emission wavelengths of 430/535 nm using a microplate reader (Biotek Synergy HT). 7-Amido-4- trifluoromethyl coumarin (AFC) standard ranging from 5 μM to 15 μM was prepared, and its fluorescence was recorded for calculation of caspase-3 activity in pmol AFC released/min/mg protein.
2.11 Protein estimation
The total protein content was measured by using a convenient BCA Protein Assay Kit from Sigma-Aldrich (MO, USA) as per instructions.
2.12 Statistics
An ANOVA (one-way analysis of variance) followed by Dunnett's multiple comparison tests was employed for the statistical analysis of results. Statistical significance was attributed at p < 0.05. The experiment was repeated three times (n = 3) each carried in triplicates or quadruplicates.
3 Results
3.1 NPs of GO were more toxic than NPs of CeO2 in THP-1 cells
Physicochemical properties and aqueous behavior of the two NPs have been summarized in Table-1. It deserves mention here that NPs of CeO2 appeared as cuboidal in shape with an average size of 37 ± 9 nm whereas NPs of GO came out to be fiber-like in shape with an average of 54.8 ± 29 nm for the length and 13.7 ± 6 nm for the width of GO NPs. NPs of GO and CeO2 did not induce any change in cell viability when exposed for a 24 h at the concentration of 50 µg/mL (Fig. 1A, B, C). GO NPs caused a significant reduction in cell viability to 92-, 84, and 77 % respectively at the concentrations of 100-, 200- and 300 µg/mL when exposed for 24 h. GO induced reduction in cell viability was further increased at extended exposure of 48 and 72 h. Cell viability due to CeO2 NPs was not appreciable at these concentrations if exposed for 24 h. CeO2 NPs started toxicity only after 48 h of exposure that caused a reduction in cell viability to 90 % at the concentration of 200 µg/mL and 85 % at 300 µg/mL; cell viability further reduced to 74 % and 62 % respectively if the exposure period was extended to 72 h. Cytotoxicity induced by GO NPs was, therefore, more robust than that by CeO2 NPs.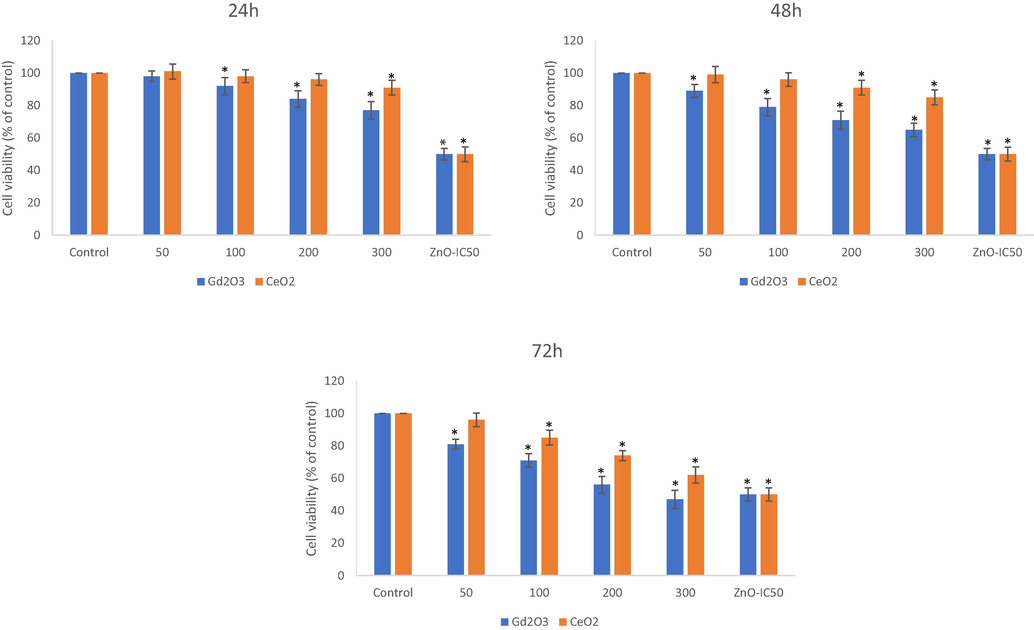
THP-1 cells were treated with NPs of Gd2O3 (i.e. GO) and CeO2 and cytotoxicity was determined by MTT after exposure of 24 h (A), 48 h (B) and 72 h (C) at the indicated concentrations of NPs. Triplicates (n = 3) of each treatment group were used in each independent experiment. *Denotes a significant difference from the control (p < 0.05).
Since the concentration of 50 µg/mL of did not exhibit pronounced toxicity in the case of CeO2 NP and also was not come out as robust in the case of GO NPs, this concentration was omitted in next experiments. The concentration of 300 µg/mL was also omitted due to the preference of studying concentrations that are close to in eliciting sub-lethal- and lethal-effects. Since the exposure period range is from 24 h to 72 h, a concentration that is sub-lethal at 24 h of exposure might be lethal at 72 h of exposure. NP of ZnO was used as positive control of cytotoxicity that caused 50 % cell death/growth inhibition at concentrations of 34-, 27- and 19 µg/mL respectively for 24 h, 48 h and 72 h exposure periods.
3.2 NPs increased cytokines level in a concentration- and time-dependent manner
All NPs under investigation induced cytokine level but their intensity was different with respect to NP identity, concentration and exposure period (Fig. 2A, B, and C). In general, GO NPs appeared to be more pro-inflammatory than NP of CeO2. LPS was used as positive control for cytokine markers. A strong time-dependent factor was also emerged in cytokine release. Cytokine release was started after a 24 h exposure period for the NPs of GO but in the case of CeO2 NPs, cytokines were only released after 72 h of exposure. That is, NPs of CeO2 did not induce cytokine release when exposed for 24 h and 48 h except for 72 h of exposure. GO NPs induced both cytokines IL-1β and TNF-α at every exposure time.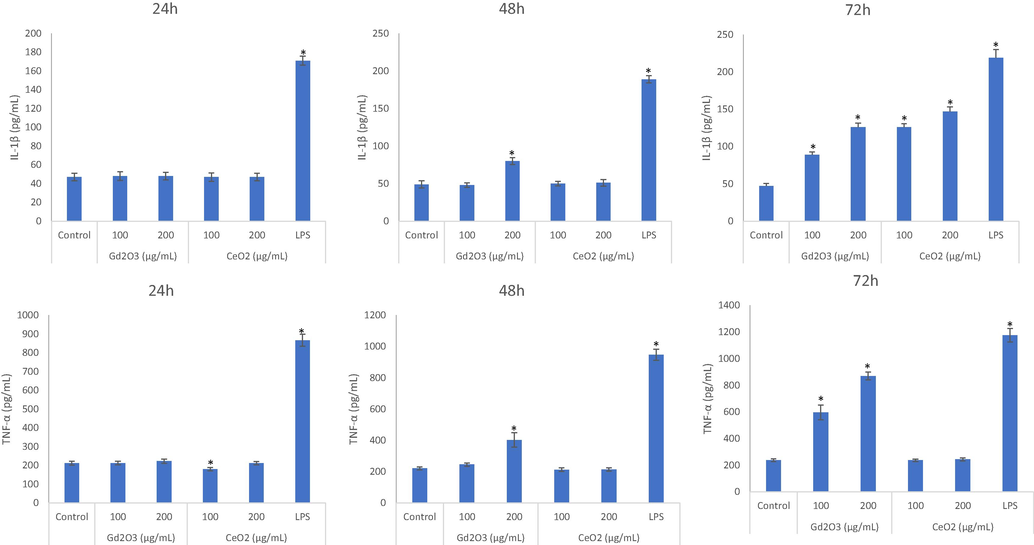
Comparative cytokines inducing potential of NPs evaluated after exposure of 24 h (A), 48 h (B) and 72 h (C) at the concentrations of 100 μg/mL and 200 μg/mL. Triplicates (n = 3) of each treatment group were used in each independent experiment. *Denotes a significant difference from the control (p < 0.05).
3.3 Dynamics of intracellular ROS and lipid peroxidation (LPO) due to the two NPs
NPs of CeO2 decreased base level of ROS up to the concentrations of 100 µg/mL exposed for 24 h and 48 h but same concentration elicited ROS when exposure period was extended to 72 h (Fig. 3A, B, and C). Concentrations higher than 100 µg/mL (i.e. 200 and 300 µg/mL) even induced ROS after 48 exposure but not at 24 h of exposure. NPs of GO induced ROS in a concentration and time dependent manner and ROS begin to build up intracellularly after 100 µg/mL of concentration from 24 h and onwards. A 10 µM H2O2 was used as a positive control of ROS in the experiment. Similar was the trend for LPO data due to the two NPs in which GO NPs came out to be strong inducer of LPO in comparison of CeO2 NPs (Fig. 3D, E, and F).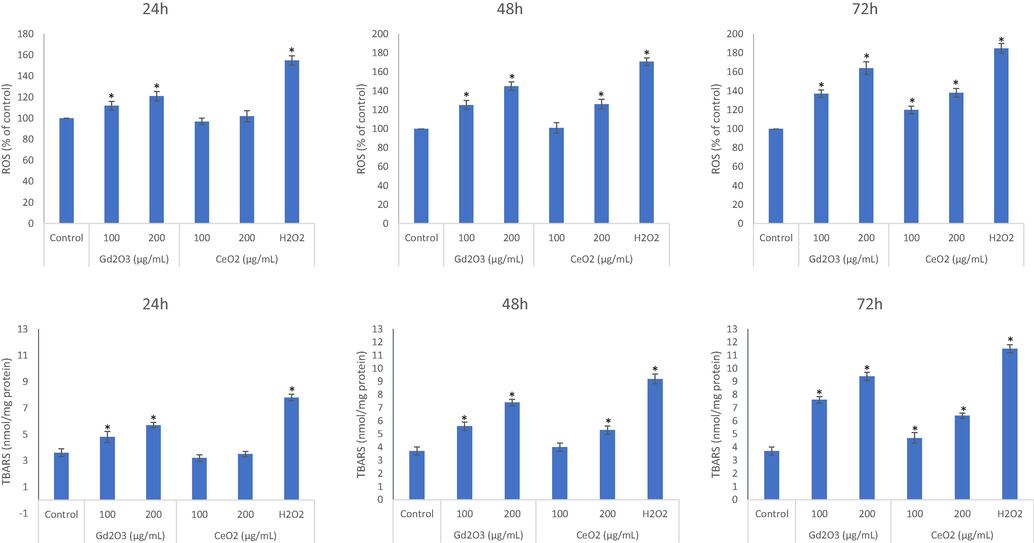
Comparative analysis on the induction of ROS due to NPs evaluated after exposure of 24 h (A), 48 h (B) and 72 h (C) at the concentrations of 100 μg/mL and 200 μg/mL. Similarly, LPO inducing potential due to NPs treatment in THP-1 cells were analyze at the three mentioned exposure periods (D, E, and F). Triplicates (n = 3) of each treatment group were used in each independent experiment. *Denotes a significant difference from the control (p < 0.05).
3.4 NPs modulated intracellular GSH level differently in THP-1 cells
GSH depleting potential for GO NPs was comparatively higher than it was due to CeO2 NPs at every concentration and exposure period (Fig. 4A, B and C). BSO refers to buthionine-(S,R)-sulfoximine that diminishes GSH synthesis in cells (Akhtar et al., 2022). CeO2 NPs caused significantly increase in cellular GSH when exposed for 24 h (Fig. 4A) at concentrations of 100 and 200 which came down to almost control level when analyzed after 48 h exposure (Fig. 4B). This time-dependent decline trend continued and GSH was significantly depleted in CeO2 NPs treated cells for 72 h (Fig. 4C). This GSH decline for 72 h exposure due to CeO2 NPs might be responsible for the observed toxicity in THP-1 and that might be further aggravated due to rise in the ROS. Collectively this oxidative stress might be a consequence for IL-1β release for that period of exposure.
3.5 Cell death due to CeO2 NPs might be apoptosis-dependent whereas GO NPs induced death might be apoptosis-independent
An increase in the ratio of Bax/bcl2 is indicative of apoptosis and vice-versa. NPs of GO did not appear to significantly alter the expression level of mRNAs for Bax and Bcl2 genes for the any concentration or exposure time (Fig. 5A, B, and C). CeO2 NPs with low potential of inducing oxidative stress increased significantly the ratio of Bax/Bcl2 in cells undergoing death after the 72 h of exposure. CeO2 NPs significantly upregulated pro-apoptotic Bax while downregulated anti-apoptotic Bcl2. Together with the activity of caspase 3 (Fig. 5D, E, and F), it is safe to conclude that GO NP with robust capacity to increase cytotoxicity seemed to go through apoptosis-independent mechanism of cell death. CeO2 NP, on the other hand, with a limited capacity of inducing oxidative stress, in comparison of GO NPs, appeared to cause deaths via apoptosis-dependent mechanism (Fig. 5).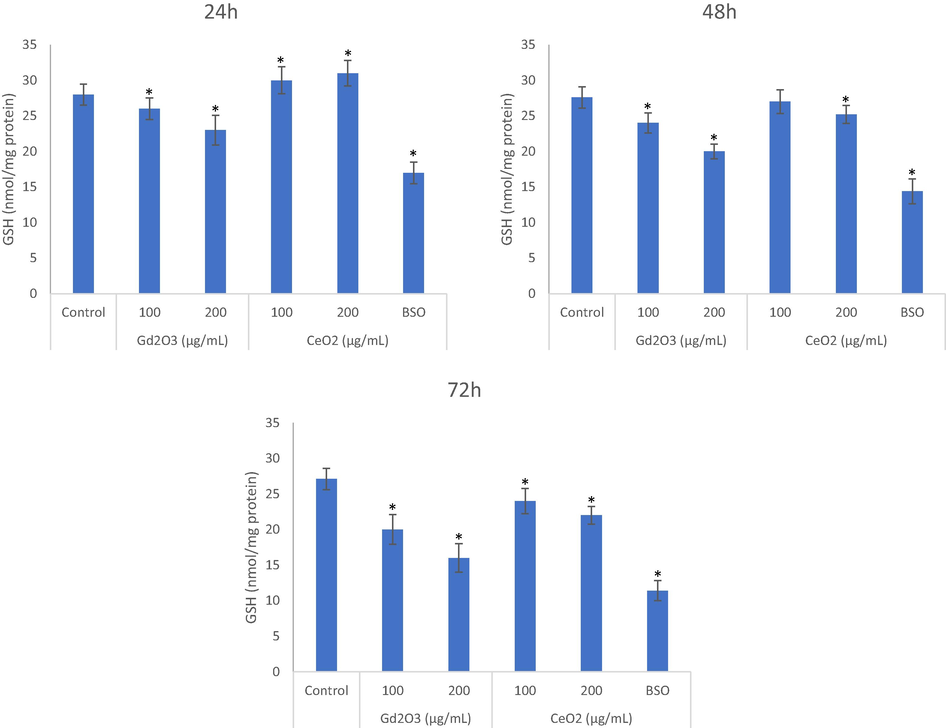
Comparative GSH depleting potential of NPs were evaluated after exposure for 24 h (A), 48 h (B) and 72 h (C) assay at the concentrations of 100 μg/mL and 200 μg/mL of each. BSO is a chemical that is used as a positive depletor of GSH in cells. Triplicates (n = 3) of each treatment group were used in each independent experiment. *Denotes a significant difference from the control (p < 0.05).
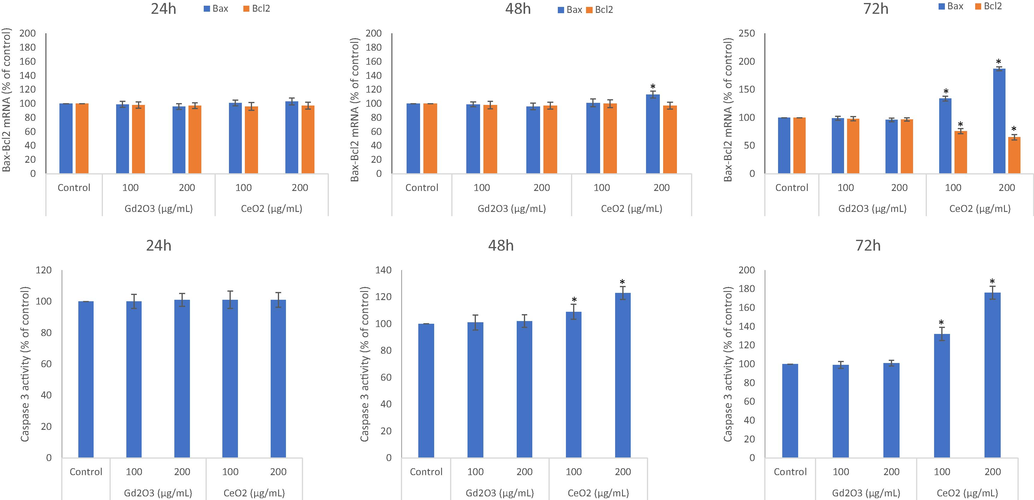
Comparative potential effects of GO NPs and CeO2 NPs on Bax/Bcl2 mRNA expression evaluated after exposure of 24 h (A), 48 h (B) and 72 h (C) at the concentrations of 100 μg/mL and 200 μg/mL. Similarly, caspase 3 inducing potential due to NPs treatment in THP-1 cells were evaluated as mentioned above (D, E, and F). Triplicates (n = 3) of each treatment group were used in each independent experiment. *Denotes a significant difference from the control (p < 0.05).
4 Discussion
In the present study, the two NPs belonging to the same lanthanide family elicited different response in THP-1 cells. A steeper response in cytotoxicity was observed due GO NPs in comparison to that of CeO2 NPs at every exposure time and concentration. This difference in bio-response may not be only due to elemental difference but may also occur due to differences in shape and surface charge. The hydrodynamic sizes in complete culture media were 478 ± 44 nm for the GO NPs and 143 ± 63 nm for the CeO2 NPs. The respective zeta-potentials in complete culture media were −17 ± 4 eV for the GO NPs and −24 ± 3 eV for the CeO2 NPs. From the very basic physico-chemical data, it is clear that the two NPs significantly differ in their shapes, agglomeration tendency and surface charge. NPs of CeO2 are significantly smaller than that of GO NPs in terms of their primary size and also have a lower agglomeration tendency in complete culture media. In the field of nanotoxicity, smaller NPs are expected to induce higher toxicity than that caused by bigger one subject to other factors be similar such as chemical composition and shape (Oberdörster et al., 2005). For example, NPs of gold with a 15 nm size have been found to be 60 times less toxic than the NPs of gold with 1.4 nm size (Pan et al., 2007). NPs shape is also a strong determinant in biological outcomes (Sukhanova et al., 2018). Macrophages evolved for engulfing foreign particles have, therefore, been found more sensitive to NPs toxicity than the epithelial cells suggesting toxicity may fundamentally relate according to basic structural and functional diversity of cell types (Cowie et al., 2015). A 24 h exposure of amorphous silica NPs was most cytotoxic in the two macrophages than in A549 epithelial cells (Breznan et al., 2017).
Although, CeO2 NPs caused induction of IL-1β after 72 of exposure, CeO2 NPs did not induce another inflammatory marker TNF-α at any exposure duration examined (24 h, 48 h or 72 h). Overall, in terms of cytokine tested in this study, GO NPs were highly inflammatory in comparison of NPs of CeO2. GO NPs induced both cytokines IL-1β and TNF-α at every exposure time. Similarly, in comparison of CeO2 NPs, NPs of CuO significantly elevated cytokines IL6, IL8 and TNF α, and ROS induced apoptotic parameters in both models of in vivo and in vitro whereas CeO2 NPs did not exert any significant toxicity in THP-1 cells (Kaur et al., 2019). NPs of CeO2 had little effect on the release of cytokines in THP-1 cells while NPs of CuO induced toxicity and release of various cytokines was again higher (Kaur et al., 2019). Like THP-1 cells, these investigators found comparable results in another model of study zebra fish embryos (Kaur et al., 2019). Curiously, dose-dependent genotoxicity in THP-1 cells was induced by NPs of graphene-plateletes without affecting cytotoxicity and immunotoxicity (Malkova et al., 2021).
In terms of findings on ROS for the two NPs, NPs of CeO2 are clearly less toxic than NPs of GO. Moreover, NPs of CeO2 exhibited property of antioxidant up to the shorter periods of exposure. If the concentration and/or exposure time is increased, CeO2 NPs begin to induce ROS in THP-1 cells however. This finding draws importance of evaluating the optimum concentration for the purpose of CeO2 exploration as antioxidant. Some NPs are reported to induce ROS and inflammation while some are reported to suppress it. Another NPs, ultra-small Cu-based NPs, nanozymes) have shown strong potential to scavenge ROS (hence nanozymes) that could be harnessed in the treatment of ROS-associated inflammation (Liu et al., 2020). A significant amount of ROS induction was detected for GO NPs in HUVE cells (Akhtar et al., 2020) whereas NPs of CeO2 lead to cell protection against oxidant induced toxicity (Akhtar et al., 2021). Observation on the dynamics of GSH indicate that CeO2 NPs may behave as antioxidant in THP-1 cells up to 24 but the extended period of exposure could limit the antioxidant property of CeO2 NPs, at least, in THP-1 cells. GO NPs, on the other hand, did not exhibit any antioxidant activity at any exposure period tested. Like the findings in cytotoxicity and ROS, GO NPs exposure lead to a GSH depletion, which is steeper in comparison of CeO2 NPs.
It is widely recognized that abrupt ROS can activate necrosis whereas low and controlled ROS can activate apoptosis in damaged cells (Lee et al., 2012). Alarifi et al. (2017) have reported an induction of apoptosis in human neuronal (SH-SY5Y) cells due to 48 h of GO NP exposure. These investigators found a reduction in MMP with an increase in the expression of the Bax/Bcl2 gene ratio. Contrary to this, in MCF-7 cells, a decrease in the expression of the Bax/Bcl2 ratio was reported due to GO NPs treatment (Akhtar et al., 2019). In HUVE cells GO NPs again appeared to induce apoptosis-independent cell death via abruptly inducing ROS and lipid peroxidation NPs (Akhtar et al., 2020). In the present study too, fibrous GO NPs causing higher toxicity and robust oxidative stress did not appear to induce an apoptosis-dependent cell death in THP-1 cells. Cuboid CeO2 NPs, on the other hand, with low potential to induce toxicity and oxidative stress caused a rise in apoptotic Bax/Bcl2 ratio and caspase 3 in THP-1 cells undergoing death. Initially, low level of induced ROS can activate pro-survival signaling pathway leading to an increase in cellular antioxidant buffering capacity.
Activation of necrosis has been reported under conditions of ROS-induced ceramide formation or uncontrolled ROS generation after TNF-induced NADPH oxidase-1 (NOX-1) activation (Perillo et al., 2020). ROS induced necrosis and inflammation can also be a result of “frustrated phagocytosis” that is a condition of unsuccessful engulfment of fibrous particles by clearing macrophages (Sayan and Mossman, 2016). In our opinion, fibrous GO NPs under investigation with higher capacity of inducing oxidative stress could promote inflammation and apoptosis-independent death (i.e. necrosis) whereas CeO2 NPs is quite biocompatible up to the 24 h of exposure. However, CeO2 induced ROS may induce initially pro-survival pathway in cells as evidenced by its potential to power up antioxidant buffering capacity in THP-1 cells and other cell types reported by several investigators. At higher exposure concentration or duration, a cell can no longer maintain its homeostasis and, thus, a cell death via apoptosis might have been already taken its course due to gradual build-up of ROS (Perillo et al., 2020).
5 Conclusion
Despite belonging to same rare-earth metal groups in lanthanide series, NPs of GO and CeO2 induce different bio-responses. The tested CeO2 NPs exhibited low cytotoxicity and inflammatory potential than that elicited by the NPs of GO. Lack of apoptotic markers in more toxic fibrous GO NPs treated THP-1 cells indicate an apoptosis-independent mechanism of cell death in THP-1 cells whereas CeO2 NPs clearly activate an apoptotic mode of cell death in damaged cells. Moreover, when exposure time was extended, the antioxidant properties of CeO2 NPs arising at 24 h and turned to be neutral at 48 h of exposure that turned to be oxidative and toxic at 72 h of exposure. This fact signifies the importance of evaluating the optimum concentration and exposure period if antioxidant properties of CeO2 are to be further explored, at least, in THP-1 cells.
Funding
This work was funded by the National Plan for Science, Technology and Innovation (MAARIFAH), King Abdulaziz City for Science and Technology, Kingdom of Saudi Arabia, Award Number (14-BIO144-02).
Declaration of Competing Interest
The authors declare that they have no known competing financial interests or personal relationships that could have appeared to influence the work reported in this paper.
References
- Oxidative stress mediated apoptosis induced by nickel ferrite nanoparticles in cultured A549 cells. Toxicology. 2011;283:101-108.
- [CrossRef] [Google Scholar]
- Mechanism of ROS scavenging and antioxidant signalling by redox metallic and fullerene nanomaterials: Potential implications in ROS associated degenerative disorders. Biochim. Biophys. Acta - Gen. Subj.. 2017;1861:802-813.
- [CrossRef] [Google Scholar]
- Challenges facing nanotoxicology and nanomedicine due to cellular diversity. Clin. Chim. Acta.. 2018;487:186-196.
- [Google Scholar]
- Toxicity mechanism of gadolinium oxide nanoparticles and gadolinium ions in human breast cancer cells. Curr. Drug Metab.. 2019;20:907-917.
- [CrossRef] [Google Scholar]
- Gadolinium oxide nanoparticles induce toxicity in human endothelial huvecs via lipid peroxidation, mitochondrial dysfunction and autophagy modulation. Nanomaterials. 2020;10:1-18.
- [CrossRef] [Google Scholar]
- Anti-inflammatory ceo2 nanoparticles prevented cytotoxicity due to exogenous nitric oxide donors via induction rather than inhibition of superoxide/nitric oxide in huve cells. Molecules. 2021;26:5416.
- [CrossRef] [Google Scholar]
- CeO2-Zn nanocomposite induced superoxide, autophagy and a non-apoptotic mode of cell death in human umbilical-vein-derived endothelial (HUVE) cells. Toxics. 2022;10:250.
- [CrossRef] [Google Scholar]
- Regulation of apoptosis through bcl-2/bax proteins expression and DNA damage by nano-sized gadolinium oxide. Int. J. Nanomedicine. 2017;12:4541-4551.
- [CrossRef] [Google Scholar]
- Gd 2O 3 nanoparticles: Size-dependent nuclear magnetic resonance. Contrast Media Mol. Imaging. 2013;8:92-95.
- [CrossRef] [Google Scholar]
- Differential cytotoxic and inflammatory potency of amorphous silicon dioxide nanoparticles of similar size in multiple cell lines. Nanotoxicology. 2017;11:223-235.
- [CrossRef] [Google Scholar]
- THP-1 cell line: An in vitro cell model for immune modulation approach. Int. Immunopharmacol.. 2014;23(1):37-45.
- [Google Scholar]
- Suitability of human and mammalian cells of different origin for the assessment of genotoxicity of metal and polymeric engineered nanoparticles. Nanotoxicology. 2015;9:57-65.
- [CrossRef] [Google Scholar]
- Auto-catalytic ceria nanoparticles offer neuroprotection to adult rat spinal cord neurons. Biomaterials. 2007;28:1918-1925.
- [CrossRef] [Google Scholar]
- A THP-1 cell line-based exploration of immune responses toward heat-treated BLG. Front. Nutr.. 2021;7:350.
- [CrossRef] [Google Scholar]
- Engin, A.B., Hayes, A.W., 2018. The impact of immunotoxicity in evaluation of the nanomaterials safety. Toxicol. Res. Appl. 2, 239784731875557. https://doi.org/10.1177/2397847318755579.
- Lanthanide (Gd3+ and Yb3+) functionalized gold nanoparticles for in vivo imaging and therapy. Biomaterials. 2016;108:35-43.
- [CrossRef] [Google Scholar]
- A fluorometric method for determination of oxidized and reduced glutathione in tissues. Anal. Biochem.. 1976;74:214-226.
- [CrossRef] [Google Scholar]
- Toxicological evaluation of metal oxide nanoparticles and mixed exposures at low doses using zebra fish and THP1 cell line. Environ. Toxicol.. 2019;34:375-387.
- [CrossRef] [Google Scholar]
- Development of bifunctional gadolinium-labeled superparamagnetic nanoparticles (Gd-MnMEIO) for In Vivo MR imaging of the liver in an animal model. PLoS ONE. 2016;11(2):e0148695.
- [Google Scholar]
- Autophagy, mitochondria and oxidative stress: Cross-talk and redox signalling. Biochem. J.. 2012;441:523-540.
- [CrossRef] [Google Scholar]
- Ultrasmall copper-based nanoparticles for reactive oxygen species scavenging and alleviation of inflammation related diseases. Nat. Commun.. 2020;11:1-16.
- [CrossRef] [Google Scholar]
- Metal-based nanoparticles and the immune system: activation, inflammation, and potential applications. Biomed Res. Int.. 2015;2015:1-12.
- [Google Scholar]
- A strategy for grouping of nanomaterials based on key physico-chemical descriptors as a basis for safer-by-design NMs. Nano Today. 2014;9:266-270.
- [CrossRef] [Google Scholar]
- In vitro assessment of the genotoxic potential of pristine graphene platelets. Nanomaterials. 2021;11(9):2210.
- [Google Scholar]
- Gadolinium deposition in human brain tissues after contrast-enhanced MR imaging in adult patients without intracranial abnormalities. Radiology. 2017;285:546-554.
- [CrossRef] [Google Scholar]
- Rapid colorimetric assay for cellular growth and survival: Application to proliferation and cytotoxicity assays. J. Immunol. Methods. 1983;65:55-63.
- [CrossRef] [Google Scholar]
- Nanotoxicology: An emerging discipline evolving from studies of ultrafine particles. Environ. Health Perspect.. 2005;113(7):823-839.
- [Google Scholar]
- Assay for lipid peroxides in animal tissues by thiobarbituric acid reaction. Anal. Biochem.. 1979;95:351-358.
- [CrossRef] [Google Scholar]
- The presence of the gadolinium-based contrast agent depositions in the brain and symptoms of gadolinium neurotoxicity-A systematic review. PLoS ONE. 2017;12(2):e0171704.
- [Google Scholar]
- Optical and biological evaluation of upconverting Gd2O3:Tb3+/Er3+ particles as microcarriers of a Zika virus antigenic peptide. Chem. Eng. J.. 2020;385:123414
- [CrossRef] [Google Scholar]
- Size-dependent cytotoxicity of gold nanoparticles. Small. 2007;3:1941-1949.
- [CrossRef] [Google Scholar]
- Expression of cell survival/death genes: Bcl-2 and Bax at the rate of colon cancer prognosis. Biochim. Biophys. Acta - Mol. Basis Dis.. 2005;1741:25-29.
- [CrossRef] [Google Scholar]
- ROS in cancer therapy: the bright side of the moon. Exp. Mol. Med.. 2020;52(2):192-203.
- [Google Scholar]
- Gadolinium-based contrast agent toxicity: a review of known and proposed mechanisms. Biometals. 2016;29:365-376.
- [CrossRef] [Google Scholar]
- Gadolinium as a new emerging contaminant of aquatic environments. Environ. Toxicol. Chem.. 2018;37:1523-1534.
- [CrossRef] [Google Scholar]
- The NLRP3 inflammasome in pathogenic particle and fibre-associated lung inflammation and diseases. Part. Fibre Toxicol.. 2016;13
- [CrossRef] [Google Scholar]
- Dependence of nanoparticle toxicity on their physical and chemical properties. Nanoscale Res. Lett.. 2018;13(1)
- [CrossRef] [Google Scholar]
- Quantifying cellular oxidative stress by dichlorofluorescein assay using microplate reader. Free Radic. Biol. Med.. 1999;27:612-616.
- [Google Scholar]


