

Imidazooxazine moiety as polyketide synthase 13 inhibitors targeting tuberculosis
⁎Corresponding authors. kathirak@srmist.edu.in (M.K. Kathiravan), jesuaroa@srmist.edu.in (Jesu Arockiaraj)
-
Received: ,
Accepted: ,
This article was originally published by Elsevier and was migrated to Scientific Scholar after the change of Publisher.
Abstract
Introduction
Recently, imidazooxazines have attracted more attention due to their therapeutic potential against tuberculosis (TB). The present study aimed to identify and develop potential inhibitors against Pks13-TE to combat the antimicrobial drug resistance of TB.
Methods
Computer-aided drug design is a more highly valued technology than the traditional drug discovery approach. Herein, we computationally investigated a chemical dataset using QSAR models and virtually screened novel leads of imidazooxazines against the thioesterase domain, further subjecting them to molecular docking and dynamics simulation.
Results
The present study identified two molecules, 1 and 3, promising leads with minimum energy conformations of −7.63 and −7.62 kcal, respectively, providing structural insight into Pks13 inhibition. The average values of MolSA, SASA, and PSA for molecules 1 and 3 were 382.41 Å, 77.65 Å, and 195.54 Å and 386.24 Å, 71.105 Å, and 184.46 Å, respectively. In conclusion, our research has demonstrated that imidazoxazines are promising leads to combat the resistance problem of TB. Among the two potent molecules 1 and 3, molecule 1 displayed favourable interactions in the active site with good stability, as confirmed by the RMSD, RMSF, RoG, H-bond, and SASA analyses. The Molecule 1 protein complex showed two strong hydrogen bonds, effectively maintained for 80–85 % of the simulation time, indicating its stability and potency.
Conclusion
The identified two molecules and their conformations were highly stable; hence, these findings provide valuable insight into the evolution of new therapeutic agents to address the growing problem of TB and its resistance.
Keywords
Antimicrobial resistance
Tuberculosis
Antimycobacterial
Polyketide synthase
Thioesterase
Imidazo [2,1-b] [1,3] oxazine

- AMR
-
antimicrobial resistance
- Pks
-
polyketide synthase
- RoG
-
radius of gyration
- WHO
-
World Health Organization
- TB
-
Tuberculosis
- HIV
-
Human immunodeficiency virus
- CADD
-
computer-aided drug design
- SASA
-
solvent accessible surface area
Abbreviations
1 Introduction
Antimicrobial resistance is one of the twenty-first century's most significant concerns to human health. The rise of antimicrobial resistance (AMR) poses a substantial risk to worldwide health, potentially increasing illness, death, and healthcare expenditures. As stated by the World Health Organization (WHO), AMR causes approximately 700,000 deaths annually, and the number of deaths may increase by approximately 10 million every year by 2050 if adequate measures are not taken to address this issue. One of the main drivers of AMR is the overuse and misuse of drugs in human health care (He et al., 2022).
Tuberculosis (TB) has a significant health impact on society, infecting more than 10 million people every year and becoming an important global challenge. The two main health concerns of TB, drug resistance and co-infection with HIV, are making it more complicated. An estimated 1.2 million deaths and an additional 0.2 million deaths were reported for HIV-positive patients in 2021. Nearly one lakh people, in which HIV-suspected individuals are more vulnerable, died from drug-resistant strains (Bon et al., 2022). The introduction of streptomycin, the initial medication for treating tuberculosis, also develops resistance to M. tuberculosis (Mtb). AMR in tuberculosis is a significant public health concern, as it makes the treatment of the disease more difficult and increases the risk of transmission. Most Mtb resistance is associated with independent, spontaneous mutations that prevent the drug from binding to the target protein, decreasing the levels of prodrug-activating enzymes or overexpressing a crucial target (Altharawi et al., 2023). AMR resistance in TB is classified into two categories: primary and acquired. Primary resistance arises when an individual contracts a strain of M.tb inherently resistant to one or more of the initial drugs used in treatment. Acquired resistance occurs when a person with TB is initially infected with a drug-susceptible strain of M.tb but then develops resistance during therapy due to poor adherence, inadequate dosing, or other factors. Specific resistance mutations are common even for currently available antitubercular drugs (Deb and Al-Shar’i, 2021).
Pks13, a multifunctional enzyme involved in the biosynthesis of mycolic acids, which is an essential requirement of the cell wall and converts two fatty acids to form a mycolic β-ketoester by a condensation reaction, a direct precursor for Mycolic acids. It is composed of long chain fatty acid that plays a critical role in the pathogenesis of TB by contributing to the virulence and protecting the bacterium from host defence and antibiotics (Lun et al., 2023; Maitra et al., 2019; Wellington and Hung, 2018). Pks 13 is responsible for the elongation and branching of the fatty acid chains that comprise mycolic acids and plays a crucial role in regulating cell wall permeability and antibiotic resistance in Mtb (Shanthakumar and Kathiravan, 2020). It has been determined that the Pks13 thioesterase domain is a druggable target for the creation of antitubercular medications and that combating antimicrobial resistance by inhibition results in the loss of mycolic acids and bacterial death. Hence, this target is identified for developing novel pks13 inhibitors to treat TB (Altharawi et al., 2023).
Computer-aided drug design accelerates drug development by efficiently bridging lead identification and marketing. Utilising insilico methods, such as QSAR, aids in identifying novel leads crucial for drug discovery (Cınaroglu and Timuçin, 2019). Molecular docking reveals protein–ligand binding affinity, and molecular dynamics simulations provide deeper insights into binding pocket dynamics (Pandey et al., 2018; Obakiro et al., 2023; Irfan et al., 2023). The basic understanding of ligand-macromolecule interactions aids in identifying conformational changes and hidden binding pockets (Pinto et al., 2019; Thobeka et al., 2022). In our ongoing computational work on tuberculosis, we explored imidazooxazine bicyclic moieties as promising candidates for inhibiting the Pks13 thioesterase domain, utilising molecular docking and dynamics simulations (Chitre et al., 2011; Gopinath and Kathiravan, 2019; Nilewar and Kathiravan, 2014)..
2 Materials and methods
2.1 QSAR method development and validation
QSAR analysis was performed for the dataset of fifty-eight molecules on H37Rv by the software QSARINS, developed at the University of Insubria (Gramatica et al.; Thompson et al., 2017). The complete methodology pertaining to run the QSAR was cited in the literature. There is diversity in chemical structure and biological data that exists in the dataset, QSAR models were developed using MLR via the ordinary least squares approach (O’Boyle et al., 2011). It directly calculates the relationship between the dependent variable Y and the independent variable X. Therefore, in MLR analysis, the mean value of the dependent variable (single response) relies on introducing more than one descriptor (independent variable) (Gramatica et al., 2014; Kennard and Stone, 1969; Moulishankar and Pharmacophore, 2024; Moulishankar and Sundarrajan, 2023; Yap, 2011; Yuanita et al., 2020). Moreover, the outliers and the influential molecules were determined by employing applicability by testing the model to make better predictions of the allowable space limit. Y-randomization was applied as an external validating parameter to analyse the QSAR model obtained by trials and not by chance. In addition, the model must possess significant R2 and Q2 values to justify its robustness. The quality of the model was validated with the recommended statistical parameters, such as fitting criteria, stability, reliability, and predictive strength, and internal and external validation parameters evaluated its robustness. The models generated with the most tremendous statistical significance were selected to design molecules and assessed for their predictively.
2.2 Molecular docking
The best molecules that satisfied the QSAR model equation were subjected to molecular docking using Schrodinger (Veerasamy et al., 2011). Ligands were subjected to force field MMFF94 and the steepest descent algorithm using Avogadro V 1.2.0. The protein's three-dimensional structure with the PDB ID 5 V41 was retrieved from the Protein Data Bank in the prescribed PDB format. It represents a high protein structure with no mutations and ensures that the protein's natural behaviour and interactions are preserved in the study. The Ramachandran plot indicates that the protein's backbone torsion angles are well within the allowed regions, reflecting a structurally sound and reliable protein conformation. Moreover, the protein structure analysis was determined using X-ray diffraction. This method ensures the accuracy and reliability of the structural data. Active site analysis for the target was performed by MOER version 2023. A Discovery Studio visualiser was used for the analysis of the molecular docked complex results.
2.3 Molecular dynamics simulation studies
Molecular dynamics simulations were conducted using the Desmond V 5.9 package from the Schrödinger LLC suite to investigate alterations in the solvent environment surrounding a macromolecular complex. The complex, initially docked for dynamics, was subjected to the OPLS force field (Kaminski et al., 2001; Ghosh et al., 2021; Adeniji et al., 2019; Rajasekhar et al., 2021). To facilitate simulation, the complex was positioned at the centre of an orthorhombic cubic box. This box was filled with TIP3P water molecules, along with buffers, ensuring a distance of approximately 10 Å between the protein atoms and the box edges. Additionally, the box volume was adjusted to accommodate the complex and counter ions such as Na + and Cl- ions, ensuring system neutrality. According to the Desmond protocol, minimization procedures utilized the OPLS-2005 force field parameters. A Berendsen NVT ensemble was employed to maintain a temperature of 10 K, effectively constraining heavy atoms within the solute. The simulation itself operated at approximately 300 K, maintained at 1 atmospheric pressure, with a relaxation time of 20 ps (Kim et al., 2023 Mar; Khade, 2020; Umar et al., 2021). Throughout the simulation process, the Martyne-Tobias-Klein barostat and Nose-Hoover thermostat methodologies were employed to maintain a stable pressure of 1 atm and a temperature of 300 K (Gupta et al., 2021). The system was initialized under the NPT ensemble, which was executed for approximately 100 ns. Subsequently, frames were compiled and examined to analyse trajectories using simulation interaction diagrams, which offered valuable insights into fluctuations (Dixit et al., 2006; Nyambo et al., 2024).
2.4 HOMO-LUMO studies
The HOMO-LUMO energy gap is a critical parameter for evaluating molecules' electronic properties and potential reactivity. This study shows that energy transfer occurring within the molecules will support the bioactive properties of the molecules. A smaller energy gap indicates that the molecule is more susceptible to electron transfer or participation in chemical reactions.
3 Results and discussion
3.1 QSAR
Models were developed, but the best model had four descriptor equations obtained by GA-MLR with good R2 and Q2loo values, internal predictions, and external validation. The models were scrutinized and evaluated based on a chemometric approach and statistical parameters.
Model 1: pKi = 5.6018 + AlogP (0.4381) + ATSc4 (4.0635).
Model 2: pKi = 4.6654 + ALogP (0.4135) + ATSc4 (3.7187) + MDEC-23.
Model 5: pKi = 4.8446 + ALogP (0.3600) + ATSc4 (3.4398) + mindssC (0.3463) + MDEC23 (0.0547), with an R2 value of 0.7406 and a Q2loo value of 0.6569. According to the statistical evaluation of the four descriptors, model (5) is excellent for the expected activity. To further improve the model status, the process continued, resulting in a model containing five descriptors.
Model 8: pKi = 4.6103 + ALogP (4.6103) + ATSc4 (3.5034) + mindssC (0.2284) + ETA_Beta_ns_d (0.2943) + MDEC-23 (0.0628).
The best model equation 5 shows contributing descriptors that helped in the designing of molecules with better predicted Pki, shown in Fig. 1 and then subjected to molecular docking and simulation studies.
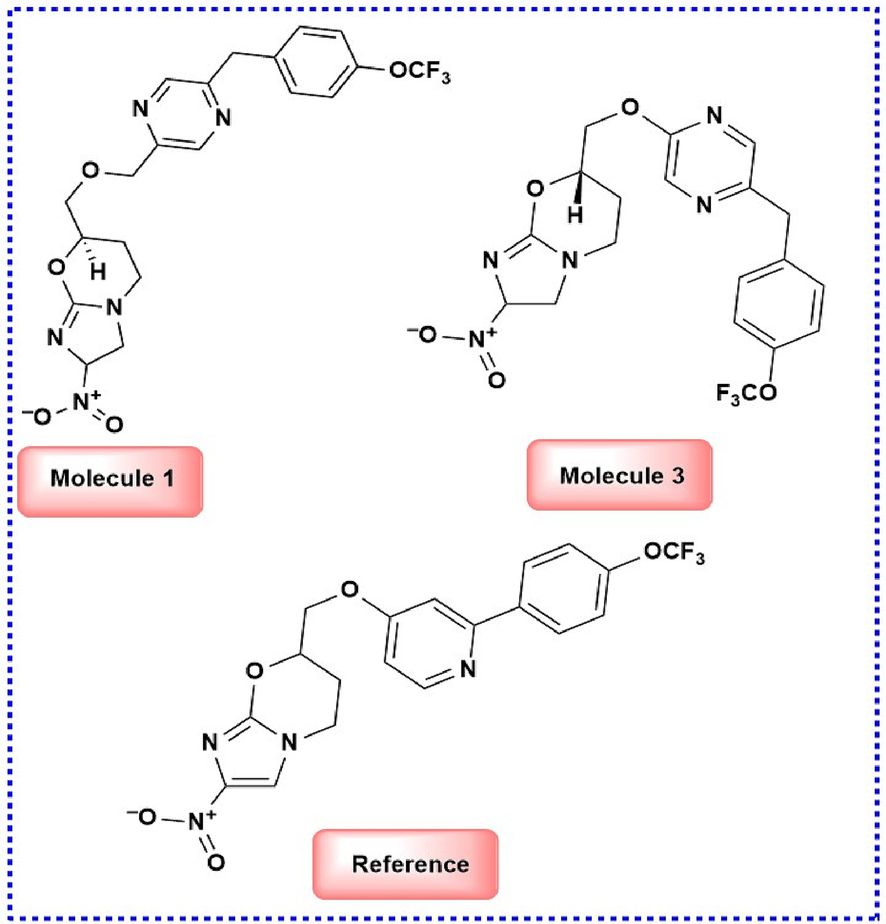
- Lead molecules identified through the QSAR study.
3.1.1 Interpretation of the descriptor in model
The four descriptors contribute to 7 – Nitro derivatives substituted with imidazole-fused oxazines. Among those, (i) Alog P – a 2D descriptor accounts for a molecule's total number of 45 atoms and specifies the nonpolar interactions. A phenyl ring with fluorine atoms is hydrophobic. (ii) The ATSC4-centered Broto–Moreau autocorrelation descriptor tag 4, weighted by changes, quantifies how the polarisation induced by a more electronegative atom at a certain distance from the atom of interest affects the molecular structure. It provides valuable information about the electronic environment and interactions within a molecule, and the more electronegative elements there are in the molecule, the greater the activity. (iii) MDEC23 refers to the molecular edge distance between secondary (sec) and tertiary (ter) carbons in a molecule. This descriptor measures the distance between these specific types of carbon atoms within a molecular structure. iv) MindssC is an electrotopological state atom-type descriptor that represents path distances within a molecule. This descriptor characterises atoms' electronic and topological properties in a molecular structure. Specifically, it denotes the distances along paths between atoms, providing information about atoms' connectivity and spatial arrangement within the molecule. The maximum activity relies on the greater distances between the atoms in a molecule. The SAR studies and descriptor contribution of nitro imidazooxazines are shown in Fig. 2.
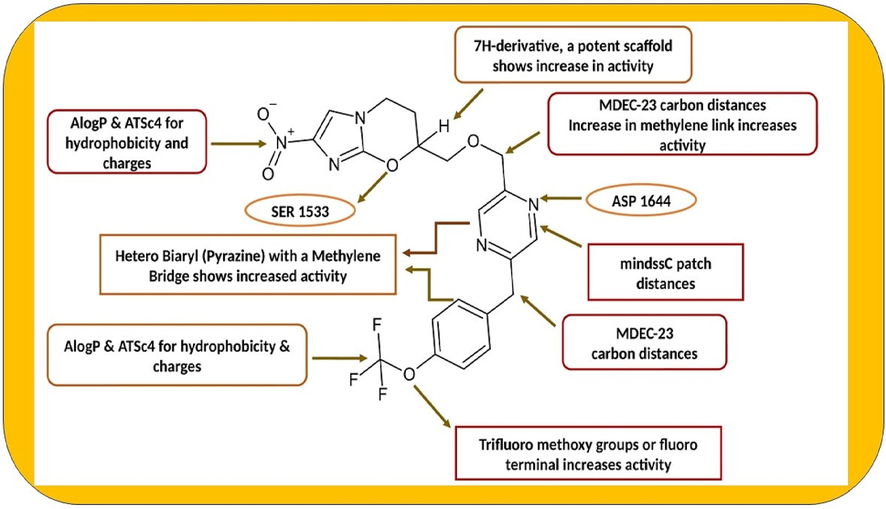
- SAR and descriptor contribution in nitro imidazooxazines.
3.2 Docking analysis
The docking score of Molecules 1 and 3 along with the reference molecule were shown in Table 1 and its 2D and 3D interactions were depicted in Fig. 3. Active sites are typically regions on a protein's surface that are involved in specific interactions with other ligands. The active site analysis of the protein revealed that the protein has 25 different regions or pockets where ligands can bind. The first active site pocket size (1 9 8) refers to the size or volume of the first active site pocket on the protein, measured in Angstroms cubed (Å^3). The size of the active site pocket can influence the types of ligands that can bind. The Pocket Volume of Ligand Binding (PLB) scorewas found to be 2.46 where a ligand fits into the active site pocket. A higher PLB indicates a better fit between the ligand and the active site, suggesting stronger binding interactions. The essential amino acid interactions were well noted in the docking and simulation studies.
| Molecule Code | Docking Affinity in Kcal/mol | Amino acid interactions |
|---|---|---|
| 1 | −7.63 | H-bond with ASP1644, ASN1640, HIS 1699, PHE 1670 |
| 2 | −7.12 | Hydrophobic SER 1636, TYR 1637 with pi-pi interaction |
| 3 | −7.62 | H-Bond SER 1636, GLN 1633, Pi-Pi stacking PHE 1670 |
| 4 | −7.24 | HIS 1664, TYR 1663 with pi-pi interaction |
| 5 | −7.33 | PHE 1670, TYR 1674 showing Hydrophobic interaction |
| Reference | −7.42 | SER 1636, TYR 1637 with pi-pi interaction |
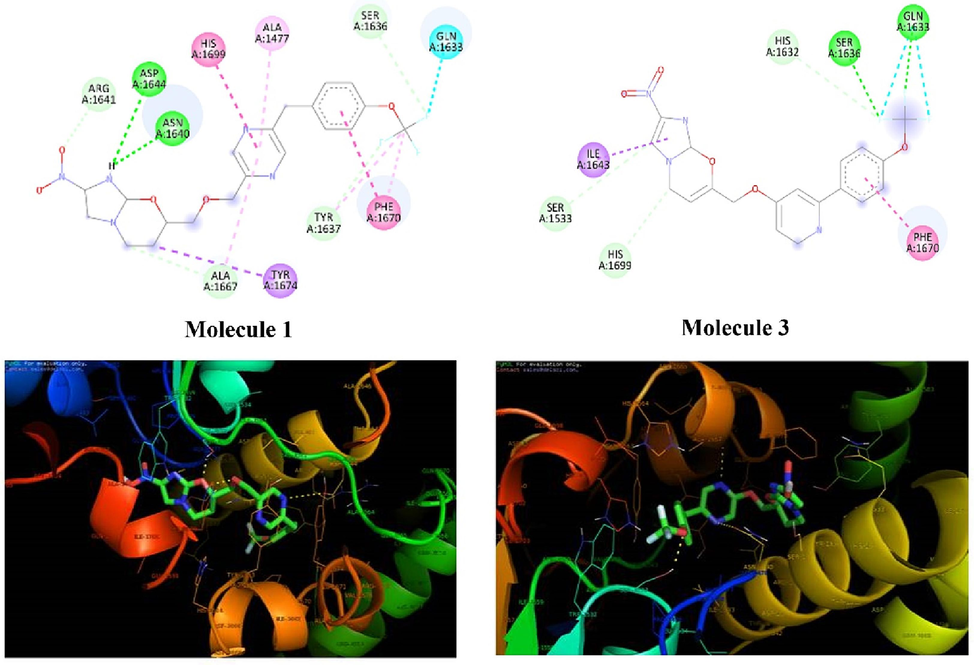
- 2D and 3D interaction of molecules 1 and 3 with Pks 13.
3.3 Molecular dynamics simulation
3.3.1 RMSD of protein 5 V41 complexes
The RMSD of the protein and molecule 1 complex shown in Fig. 4 displayed both positive and negative fluctuations until 20 ns (0.5 – 1.5 Å) and continued to show incremental fluctuations until 75 ns (1.5 – 3.5 Å), attaining stability at approximately 80 ns at 2.5 Å. The average RMSD of the protein backbone was approximately 2.557 Å, and the average and maximum values for the reference molecule complex were found to be 4.438 and 8.076 Å, respectively, at 75 ns. The RMSD of the protein and molecule 1 complex backbone first increased to 1.957 Å at 0.1 ns, then reached maximum and minimum values at 3.183 Å and 2.647 Å, respectively, at a similar trajectory and stabilised at the end of the simulation. Molecule 1 complex heavy atoms were found to have average and maximum values of 2.851 Å and 3.37 Å, respectively. However, compared to the reference molecule complex, these values showed more terrific structural refinement throughout the investigation. The RMSD of the protein and molecule 3 complex in Fig. 4 indicates that the backbone initially started at 1.569 Å. The average length of the protein backbone was 2.628 Å and reached a maximum of 3.111 Å for specific trajectories but reached a stable value of approximately 2.628 Å. The average length of the complex was approximately 5.800 Å greater than that of complex 1. Cα, the protein backbone, is well correlated. Still, the ligand fit protein fluctuates approximately ns at 0.9 Å − 1.5 Å, reaches approximately 2.6 Å at 60 ns and then continuously fluctuates until100 ns from 2.6 Å – 3.111 Å. The RMSD values of the C α atoms of the protein stabilized within 2.0 to 3.0 deviations from its initial structure according to the analysis of the produced trajectories of the complexes. This indicates that the protein retains its interaction profile upon binding molecules 1 and 3 and does not undergo further significant conformational changes. Based on the RMSD values of molecules 1 and 3, molecule 1 was the most stable.

- Protein-Ligand RMSD of molecule 1, 3 and reference.
3.3.2 Dynamic properties of a protein
Ligand binding to a protein can induce structural changes, potentially increasing fluctuations in the RMSF plot, suggesting destabilization. This effect may arise from alterations in hydrogen bonds, van der Waals, or electrostatic interactions between the protein and ligand. The RMSF plot of the molecule 1 complex (Fig. 5) shows minimal localized alterations along the protein chain during thermal motion. Helices experience mild fluctuations, while loops exhibit moderate ones. Vibrations exceeding 4.5 Å suggest strong hydrogen bond contacts. The 'N' and 'C' terminal display higher fluctuations compared to other regions. Secondary structure elements like α-helices and β-strands exhibit less fluctuation than loop residues, active for 70 % of the simulation time. The protein backbone's average RMSF is 1.037 Å. In the RMSF analysis of the molecule 1 complex, the key backbone residue positions include PHE 1474 – GLY 1478, ASP 1560 – ALA 1561, ARG 1662 – TYR 1663, and HIS 1699 – ILE 1700. The maximum and average protein backbone values are 5.232 Å and 1.003 Å, respectively, lower than the reference molecule. Conversely, in the molecule 3 complex, 'N' and 'C' termini exhibit more fluctuations, with loop regions showing higher fluctuations and hydrogen bonding interactions. Fluctuations in the unstructured portion of the molecule 1 complex exceed 5.6 Å compared to the reference molecule, with maximum and average backbone lengths of 7.14 Å and 1.454 Å, respectively, indicating enhanced stability during the simulation and diverse amino acid interactions.
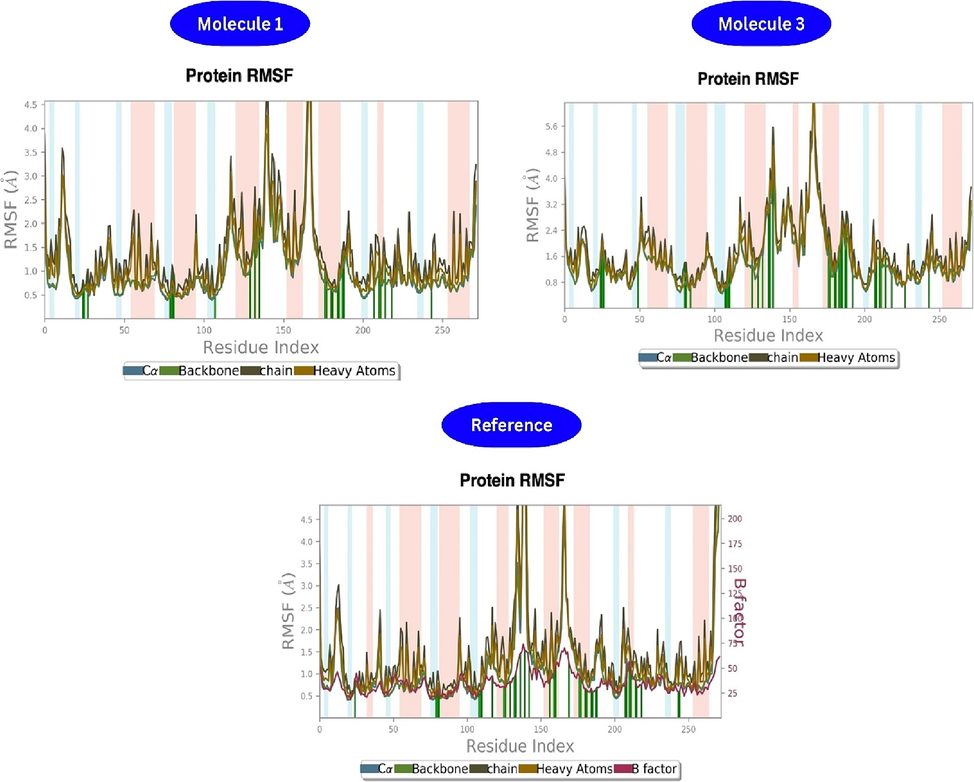
- Protein-Ligand RMSF of molecule 1, 3 and reference.
3.3.3 H bond analysis
The H-bond analysis (Fig. 6) reveals consistent hydrogen bond interactions involving residues HIS 1632, ASN 1640, and TYR 1663, collectively occurring for up to 40 % of the simulation time. Specifically, ASN 1640 engages in a hydrogen bond with the imidazole nitrogen at the fifth position for approximately 10 % of the time before transitioning to a water bridge. In complex 1, strong hydrogen bonding occurs at ALA 1477, transitioning to water bridges, with moderate hydrogen bonding at SER 1636. Hydrophobic contacts, such as TYR 1582, PHE 1670, and TYR 1674, contribute to approximately 70 % of the simulations through pi-cation or pi-pi interactions. Complex 3 exhibits hydrogen bonds at TYR 1582, shifting to hydrophobic contacts and water bridges. Strong H-bonding interactions occur at GLN 1633 and SER 1636, with ASN 1640 showing mild bonding initially and moderate bonding at ASP 1666 after 15 % of the simulation time. The H-bond analysis of molecule 1 by docking and dynamics showed amino acid residues such as ALA 1477 and SER 1636, which showed H-bond interactions and pi-pi stacking interactions with TYR 1674 and PHE 1670, and with TYR1582, ASP 1644, and ASN1640, which also showed H-bond interactions. Moreover, all the interactions during docking were correlated with similar amino acid residues exhibiting specific molecular interactions.
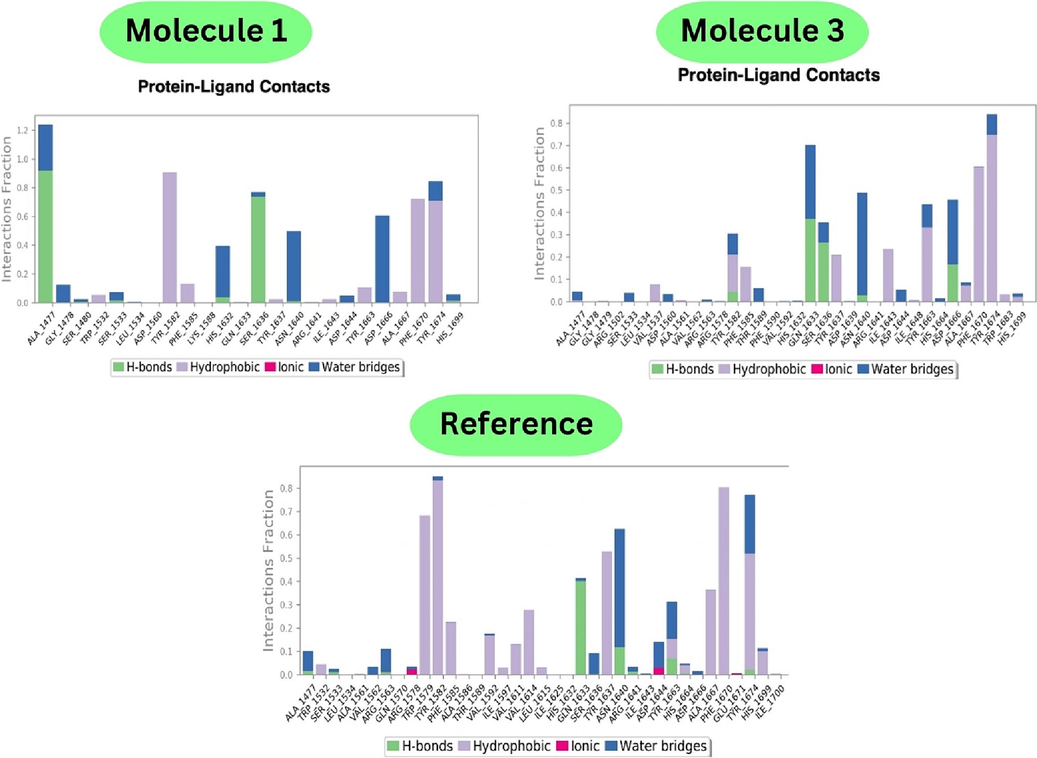
- Protein-Ligand contacts of molecule 1, 3 and reference.
3.3.4 Protein structural analysis
Interactions between proteins and ligands involve changes in secondary structure elements. During the simulation, a check of the secondary structure elements revealed a stable complex comprising 41.87 % of the 31.71 % of the α-helices and 10.16 % of the β-sheets of the reference molecule, which participated constantly during the entire simulation. The α-helices and β-strands were secondary structure elements monitored throughout the simulation. For molecule 1, 33.75 % of the α-helices and 11.09 % of the β-strands participated constantly. There was not even much deviation in the protein structure during the protein–ligand interaction of the entire trajectory. Analysing the secondary structure elements is mandatory when investigating protein-ligand interactions. It includes 30.25 % α-helices and 10.95 % β-strands, and the total percentage of SSE is 41.20 %. There were no changes in the rigid portions of the protein molecule, and 41.20 % of the total SSE constantly participated in amino acid interactions during the entire simulation. The RMSD plot shows the structural and conformational changes of the system. The average values of both complexes lie near the reference molecule's range, indicating the system's stability. The RMSF value is involved in characterizing local changes that take place along the protein and its flexibility throughout the trajectory. Typically, the C-terminal and N-terminal ends fluctuate more than the unstructured part of a protein and thus fluctuate less than the loop regions. Therefore, the RMSD, RMSF, and secondary structure analysis indicated that the ligands remained within the active site pocket while the proteins unfolded throughout the trajectory.
3.3.5 Ligand RMSD of molecules1 and 3
The ligand RMSD of molecule 1 started at 2 Å and slightly increased to 2.5 Å up to 20 ns, indicating minor conformational adjustments. A significant increase to 3 Å at 20 ns suggested a structural transition. Subsequently, the RMSD stabilized between 3 and 3.5 Å, indicating a consistent binding conformation from 20 to 100 ns. These findings justify a stable ligand-target interaction after an initial transition phase, providing insights into the ligand's structural dynamics and potential binding modes during the simulation.
The ligand RMSD of molecule 3 started initially at 2.5 Å, gradually increased to 5 Å within the first 5 ns and then maintained up to 50 ns. The initial changes up to 5 ns indicated some structural adjustments in the ligand. However, at 50 ns, there was a sudden increase in the RMSD from 2.5 Å to 5 Å. This abrupt increase is indicative of a significant transition in the ligand's interaction with the target molecule. Subsequently, the RMSD continued to increase and stabilized at 6 Å from 50 ns to 100 ns, indicating a relatively stable conformation compared to the initial state.
3.3.6 Radius of gyration (RoG)
The radius of gyration reveals the structure of a protein’s compactness, which in turn reflects its stability during the simulation. The analysis of molecule 1 initially started at 5 Ã… and showed slight fluctuations up to 15 ns, indicating structural adjustments in the compound. However, beyond 15 ns, there was a slight decrease to 4.8 Å, and the peak remained stable throughout the simulation up to 100 ns. The stability of Rg from 15 ns to 100 ns indicates that molecule 1 reached an equilibrium state, where its overall shape and size remained relatively constant over time. Molecule 3 started at 4.5 Å and was maintained for up to 5 ns, indicating a well-defined conformation. A slight increase to 6.4 Å occurred after that, followed by minor fluctuations between 5.6 and 6.4 Å. From this point onwards, molecule 3 maintained a stable Rg for up to 100 ns, suggesting it reached an equilibrium state.
3.4.HOMO-LUMO analysis
The energy gap is relatively larger at 2.14678 eV for molecule 1, suggesting that it has moderate stability and may exhibit lower reactivity towards electron transfer or chemical reactions than molecule 3. This larger energy gap indicates that compound 1 requires more energy to promote an electron from the HOMO to the LUMO, reflecting a more stable electronic configuration. The DFT results for molecule 1 and 3, shows the energy gap between the highest occupied molecular orbital (HOMO) energies and lowest unoccupied molecular orbital (LUMO) energies, are presented in Table 2, and Fig. 7.
| Molecule code | HOMO (ev) | LUMO (ev) | Energy gap (ev) |
|---|---|---|---|
| 1 | −2.22720 | −0.08042 | 2.14678 |
| 3 | −0.23049 | −0.08237 | 0.14819 |
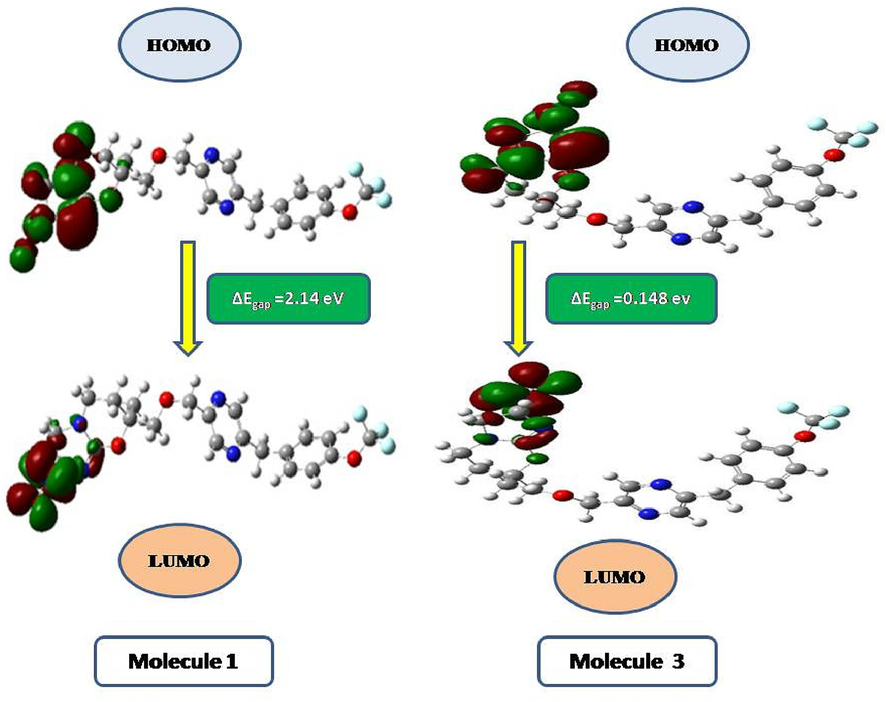
- Counterplots of the HOMO-LUMO for molecules 1 and 3.
Additionally, molecule 3 has a significantly smaller energy gap of 0.14819 eV, indicating higher reactivity and a lower energy requirement for electron transfer or participation in reactions. The smaller energy gap suggests that compound 3 may exhibit more dynamic electronic properties, making it potentially more reactive or prone to interactions with other molecules. The differences in the HOMO-LUMO energy gaps between molecules 1 and 3 can influence their electronic and chemical behaviours, affecting their suitability for specific applications, such as in electronic devices or chemical reactions.
4 Conclusion
The docking and dynamics studies confirm the potential of imidazoxazines as anti-mycobacterial agent, particularly in inhibiting Mycobacterium tuberculosis growth. Molecules 1 and 3 displayed excellent binding affinity to Pks13-TE, indicating promise in combating drug resistance. Stability assessments via dynamic simulations reveal that molecule 1 forms strong and sustained hydrogen bonds while molecule 3 exhibits less stable bonding. These findings underscore the stability and efficacy of molecule 1, offering valuable insights for therapeutic development against anti-mycobacterial resistance. These molecules could be developed as lead in the discovery of drugs targeting the thioesterase domain of polyketide synthase 13 in Mtb.
CRediT authorship contribution statement
B. Shanthakumar: Writing – original draft, Methodology, Formal analysis, Data curation, Conceptualization. P. Gopinath: Writing – original draft, Methodology, Formal analysis, Data curation, Conceptualization. Bharath Kumar Chagaleti: Writing – original draft, Methodology, Formal analysis, Data curation, Conceptualization. Venkatesan Saravanan: Writing – original draft, Validation, Resources, Methodology. Senthil Kumar Palaniappan: Writing – original draft, Validation, Resources, Methodology. Saeedah Musaed Almutairi: Writing – original draft, Validation, Resources, Methodology. Dina S. Hussein: Writing – original draft, Validation, Resources, Methodology. Yasmine Hamdy Eisa: Writing – original draft, Validation, Resources, Methodology. M.K. Kathiravan: Writing – original draft, Validation, Resources, Methodology, Investigation, Formal analysis, Conceptualization. Jesu Arockiaraj: Writing – review & editing, Visualization, Validation, Supervision, Resources, Project administration, Methodology, Investigation, Funding acquisition, Formal analysis, Conceptualization.
Acknowledgments
We thank the Management of SRM College of Pharmacy, SRM Institute of Science and Technology, Kattankukatur for their constant support and encouragement. The authors extend their appreciation to the Researchers Supporting Project Number (RSP2024R470), King Saud University, Riyadh, Saudi Arabia.
Declaration of competing interest
The authors declare that they have no known competing financial interests or personal relationships that could have appeared to influence the work reported in this paper.
References
- An integrated computational approach towards novel drugs discovery against polyketide synthase 13 thioesterase domain of Mycobacterium tuberculosis. Sci Rep.. 2023;13(1):7014.
- [CrossRef] [Google Scholar]
- An in silico quest for next-generation antimalarial drugs by targeting Plasmodium falciparum hexose transporter protein: a multi-pronged approach. J. Biomol. Str. Dyn. 41(23), 14450–59. doi:10.1080/07391102.2023.2181635. 2023
- [Google Scholar]
- Adeniji, S.E., Uba, S., Uzairu, A., Arthur, D.E., 2019. A Derived QSAR Model for Predicting Some Compounds as Potent Antagonist against Mycobacterium tuberculosis: A Theoretical Approach. Adv. Prevent. Med.2019, 5173786. https://doi.org/10.1155/2019/5173786.
- Pharmacophore optimization and design of competitive inhibitors of thymidine monophosphate kinase through molecular modeling studies. Chem. Biol. Drug Des.. 2011;78(5):826-834.
- [CrossRef] [Google Scholar]
- Insights into an alternative benzofuran binding mode and novel scaffolds of polyketide synthase 13 inhibitors. J. Mol. Model.. 2019;25(130)
- [CrossRef] [Google Scholar]
- n vitro anti-TB properties, in silico target validation, molecular docking and dynamics studies of substituted 1, 2, 4-oxadiazole analogues against Mycobacterium tuberclosis. Taylor Fr.. 2021;36(1):869-884.
- [CrossRef] [Google Scholar]
- Root mean square deviation probability analysis of molecular dynamics trajectories on DNA. J. Chem. Inf. Model.. 2006;46(3):1084-1093.
- [Google Scholar]
- Pinto, V.d.S., Araújo, J.S.C., Silva, R.C., da Costa, G.V., Cruz, J.N., De A. Neto, M.F., Campos, J.M., Santos, C.B.R., Leite, F.H.A., Junior, M.C.S. 2019. In Silico Study to Identify New Antituberculosis Molecules from Natural Sources by Hierarchical Virtual Screening and Molecular Dynamics Simulations. Pharmaceuticals 12, 36. https://doi.org/10.3390/ph12010036.
- Computational modeling of novel phosphoinositol-3-kinase γ inhibitors using molecular docking, molecular dynamics, and 3D-QSAR. Bull Korean Chem Soc.. 2021;42(8):1093-1111.
- [CrossRef] [Google Scholar]
- QSAR and docking studies on Triazole benzene sulfonamides with human carbonic anhydrase IX inhibitory activity. J. Chemom.. 2019;33(12):Dec.
- [CrossRef] [Google Scholar]
- QSARINS: a new software for the development, analysis, and validation of QSAR MLR models. Artic. J. Comput. Chem.. Sep. 2013;34(24):2121-2132.
- [CrossRef] [Google Scholar]
- QSARINS-chem: Insubria datasets and new QSAR/QSPR models for environmental pollutants in QSARINS. J. Comput. Chem.. 2014;35(13):1036-1044.
- [CrossRef] [Google Scholar]
- In Silico Prediction, Molecular Docking and Dynamics Studies of Steroidal Alkaloids of Holarrhena pubescens Wall. ex G. Don to Guanylyl Cyclase C: Implications in Designing of Novel Antidiarrheal Therapeutic Strategies. Molecules. 2021;26(14):4147.
- [CrossRef] [Google Scholar]
- Drug-Resistant Characteristics, Genetic Diversity, and Transmission Dynamics of Rifampicin-Resistant Mycobacterium tuberculosis in Hunan, China, Revealed by Whole-Genome Sequencing. Microbiol Spectr. 2022;10(1):e0154321
- [CrossRef] [Google Scholar]
- In silico development of novel benzofuran-1,3,4-oxadiazoles as lead inhibitors of M. tuberculosis polyketide synthase 13. Pharmaceuticals. 2023;16:829.
- [CrossRef] [Google Scholar]
- Evaluation and reparametrization of the OPLS-AA force field for proteins via comparison with accurate quantum chemical calculations on peptides. J Phys Chem b.. 2001;105(28):6474-6487.
- [CrossRef] [Google Scholar]
- Computer aided design of experiments. Technometrics. 1969;11(1):137-148.
- [CrossRef] [Google Scholar]
- Design, synthesis, biological evaluation and molecular dynamic simulation studies of diphenyl ether derivatives as antitubercular and antibacterial agents. ChemistrySelect. 2020;5(1):201-210.
- [CrossRef] [Google Scholar]
- Structure and dynamics of the essential endogenous mycobacterial polyketide synthase Pks13. Nat Struct Mol Biol.. 2023 Mar;30(3):296-308.
- [CrossRef] [Google Scholar]
- Therapeutic potential of coumestan Pks13 inhibitors for tuberculosis. Antimicrob Agents Chemother. 2023;95(5):e02190-20.
- [CrossRef] [Google Scholar]
- Cell wall peptidoglycan in mycobacterium tuberculosis: an achilles’ heel for the TB-causing pathogen. FEMS Microbiol Rev.. 2019;43(5):548-575.
- [CrossRef] [Google Scholar]
- QSAR, molecular docking, molecular dynamics and ADMET study of trisubstituted benzimidazole derivatives as potent anti-tubercular agents. Chem Phys Impact.. 2024;8, 100512.
- [CrossRef] [Google Scholar]
- QSAR modeling, molecular docking, dynamic simulation and ADMET study of novel tetrahydronaphthalene derivatives as potent antitubercular agents. Beni-Suef Univ J Basic Appl Sci. 2023;12:111.
- [CrossRef] [Google Scholar]
- 3D CoMFA, CoMSIA, topomer CoMFA and HQSAR studies on aromatic acid esters for carbonic anhydrase inhibitory activity. J. Chemom.. Jan. 2014;28(1):60-70.
- [CrossRef] [Google Scholar]
- Molecular docking, molecular dynamics simulations and binding free energy studies of interactions between Mycobacterium tuberculosis Pks13, PknG and bioactive constituents of extremophilic bacteria. Sci Rep. 2024;14(1):6794.
- [CrossRef] [Google Scholar]
- Molecular Docking Interactions with Mycobacterial ATP and Polyketide-13 Synthase Enzymes of Phytoconstituents Isolated from Entada abyssinica Stem Bark. Biointerface Research in Applied Chemistry. 2023;13(4):323.
- [CrossRef] [Google Scholar]
- Dynamics of fluoroquinolones induced resistance in DNA gyrase of mycobacterium tuberculosis. J. Biomol. Struct. Dyn.. 2018;36(2):362-375.
- [CrossRef] [Google Scholar]
- Exploration of potential inhibitors for tuberculosis via structure-based drug design, molecular docking, and molecular dynamics simulation studies. J. Comput. Chem.. 2021;42(24):1736-1749.
- [CrossRef] [Google Scholar]
- Bon, C., Cabantous, S., Julien, S., Guillet, V., Chalut, C., Rima, J., Brison, Y., Malaga, W., Sanchez-Dafun, A., Gavalda, S., Quémard, A., Marcoux, J., Waldo, G.S., Guilhot, C.,Mourey, L., 2022. Solution structure of the type I polyketide synthase Pks13 from. Mycobacterium tuberculosis. BMC Biol. 20, 147. doi.10.1186/s12915-022-01337-9.
- N. Thobeka, P. Ngidi, K. E. Machaba, N. N. Mhlongo, “In Silico Drug Repurposing Approach: Investigation of Mycobacterium tuberculosis FadD32 Targeted by FDA-Approved Drugs,” mdpi.com, vol. 27, no. 3, Feb. 2022, doi: 10.3390/molecules27030668.
- Insights into structures of imidazo oxazines as potent polyketide synthase XIII inhibitors using molecular modeling techniques. J. Recept. Signal Transduct. Res.. 2020;40(4):313-323.
- [CrossRef] [Google Scholar]
- 7-Substituted 2-Nitro-5,6-dihydroimidazooxazines: novel antitubercular agents lead to a new preclinical candidate for visceral leishmaniasis. ACS Publ. 2017;60(10):4212-4233.
- [CrossRef] [Google Scholar]
- Ligand-based drug design and molecular docking simulation studies of some novel anticancer compounds on MALME-3M melanoma cell line. Egypt. J. Med. Hum. Genet.. 2021;22(6)
- [CrossRef] [Google Scholar]
- Validation of QSAR Models-Strategies and Importance. International Journal of Drug Design and Discovery. 2011;2:511-519.
- [Google Scholar]
- The expanding diversity of mycobacterium tuberculosis drug targets. ACS Infect Dis.. 2018;4(5):696-714.
- [CrossRef] [Google Scholar]
- PaDEL-descriptor: an open source software to calculate molecular descriptors and fingerprints. J Comput Chem. 2011;32(7):1466-1474.
- [CrossRef] [Google Scholar]
- Quantitative structure–activity relationship (QSAR) and molecular docking of xanthone derivatives as anti-tuberculosis agents. J Clin Tuberc Other Mycobact Dis.. 2020;21, 100203
- [CrossRef] [Google Scholar]


