

Translate this page into:
Image feature extraction in detection technology of breast tumor
⁎Corresponding author. lijinzhoumu@gmail.com (Chen Li)
-
Received: ,
Accepted: ,
This article was originally published by Elsevier and was migrated to Scientific Scholar after the change of Publisher.
Peer review under responsibility of King Saud University.
Abstract
Presently, detection technology of breast tumors is mostly influenced by external interference factors, leading to poor detection efficiency. To improve the detection efficiency of breast tumors and reduce the cost of breast tumor detection, the study was designed to analyze the characteristics of breast tumors and improved the traditional ultra-wideband microwave technology to construct a two-dimensional and three-dimensional detection model of breast tumors. In addition, the study used dimensional transformation to optimize the two-dimensional texture feature extraction method and employed three-dimensional texture feature extraction method to study the image. Finally, this paper verifies the validity of the feature model proposed by this study through comparison experiments and collects 2D and 3D detection effects images separately.
Keywords
Impact characteristics
Feature recognition
Breast neoplasms
Diagnosis
Detection

1 Introduction
The pathological types of breast cancer are complex and numerous. At present, the pathological classification of breast cancer in international and domestic countries is still not unified in practice. In China, breast cancer is mainly divided into non-invasive cancer, early invasive cancer, invasive special cancer, invasive non-specific cancer and other rare cancers. Among them, non-invasive cancer includes intraductal carcinoma, lobular carcinoma in situ and papillary eczema-like breast cancer (Zarbakhsh and Addeh, 2018). Early invasive carcinoma includes early invasive ductal carcinoma and early invasive lobular carcinoma. The invasive special cancers include papillary carcinoma, medullary carcinoma, tubular carcinoma, adenoid, mucinous adenocarcinoma, squamous cell carcinoma, while invasive non-specific cancers include invasive lobular carcinoma, invasive ductal carcinoma, hard cancer, medullary carcinoma, simple cancer, adenocarcinoma, etc. (Fusco et al., 2016). A large number of censuses and early diagnosis are significant for breast cancer patients. From the perspective of therapeutic effect, early breast cancer can be cured by almost 100%. Therefore, early diagnosis and treatment are the key to improve the survival rate and cure rate of breast cancer patients.
Ultrasound imaging, mammography and breast MRI are the most commonly used imaging diagnostic techniques in the world. Ultrasound imaging, mammography has some shortcomings in breast cancer diagnosis. Ultrasound examination of the breast is not sensitive to microcalcification of the breast, and the detection rate has a certain correlation with the knowledge background and technical level of the operator. Mammography is a projection type of imaging. The overlap of tissue projections is not good for multi-center lesions, and the examination of dense breasts can mask the lesions. Therefore, the diagnostic value is not mainly used for census, and it is suitable for postmenopausal women and women with low-density breasts (Tiedtke et al., 2015). The breast CT has high resolution and can display the anatomy of the breast in detail, evaluate the exact location of the lesion, the number and size of the lesion and scope of the examination is larger than that of the mammography, thus, making it sensitivity to cysts, hemorrhage, calcification and fat high. Compared with other breast examination methods, CT has high cost, radiation damage, and allergic risk when using contrast agents (Saybani et al., 2016). Although MRI has certain limitations on the display of calcification, the resolution of soft tissue signals is high. Moreover, it has high value for qualitative and localized diagnosis of breast lesions and combine the morphology of breast lesions with hemodynamics to comprehensively describe tumor features (Breunig et al., 2017).
Pathologically, breast cancer tumor cell division is uncontrolled and malignant tumor cells require a large amount of nutrients to satisfy their continuous growth and reproduction. This facilitate cancerous tissues or cells to infiltrate into the surrounding to obtain nutrients. Considering that blood supply varies heterogeneously in different tumors, the characteristics of lesion morphology and edge ambiguity in imaging diagnosis are called important evaluation indicators. The paramagnetic contrast agent diffuses with the blood entering the blood vessel and easily enters the intercellular space and tissue cells through the highly permeable capillary wall, so the concentration of the sputum in the tumor-rich region is high (Milosevic et al., 2015). This type of physiological abnormality can be observed by TIC when DCE-MRI is used for multiple imaging in different phases of the same tissue. Therefore, the static characteristics (shape, edge, enhanced form) and dynamic characteristics (initial signal rise and change) of the lesion have a great value in judging the benign and malignant tumors (Kong et al., 2016). MRI's images are clear and detailed, and can be multi-faceted, multi-angle imaging (Zhou et al., 2015). The surface coil of the breast has been put into clinical use, and the magnetic resonance imaging technology of the breast has also been improved to become clearer. Moreover, the true positive rate and the true negative rate of breast cancer diagnosis are simultaneously improved. The mammary gland DCE-MRI examination can quantitatively display the anatomical structure of the human tissue and the lesion at a higher resolution, which provides a great help for the development of the clinician's surgical plan and the objective description of the condition.
More and more studies have shown that breast ECE-MRI is one of the important means of comprehensive diagnosis of breast cancer (Lee et al., 2016)]. The non-invasive DCE-MRI examination provides detailed information on the diagnosis of mammary gland disease in the anatomy, dynamics, and three-dimensional morphology of the breast background and lesions. DCE-MRI has obvious advantages over other imaging examinations in finding the number of lesions, the blood supply around the benign and malignant lesions, the strengthening of the lesions, and the infiltration of malignant masses. In clinical testing, early breast cancer in any type of breast density background can be accurately diagnosed under DCE-MRI. Moreover, its sensitivity and staging accuracy for early breast cancer is higher than that of breast ultrasound and mammography (Zadeh et al., 2015). In addition, it has a higher sensitivity when screening for early breast cancer patients and high-risk groups in combination with lesion morphological features and hemodynamic information [13]. Both DCE-MRI and DWI can be used for the diagnosis of early breast cancer, and the accuracy of diagnosis of early breast cancer combined with DWI and DCE-MRI is higher, and the clinical effect is more significant (Tsui and Miller, 2015).
It can be seen that all of the above medical imaging methods have their own advantages and disadvantages. Therefore, it is urgent to develop a new type of auxiliary detection means that is non-radiative, inexpensive, non-squeezing and portable, and can be used as a regular routine inspection method. In the past decade, ultra-wideband microwave imaging detection technology has been proposed for early breast tumor detection, and this received extensive attention. Based on the impact characteristics, the study investigated the effective, fast and inexpensive means of breast tumor detection.
2 Material and method
2.1 Model algorithm
Since the finite-difference time domain method samples the electric and magnetic fields at discrete points in time and at spatial points, it is important to choose the sampling interval. Certain conditions must be met to ensure the stability and accuracy of the entire iterative calculation. In the FDTD method, the numerical stability depends on the CFL (Courant-Friedrchs-Lewy) condition, which requires that the time step selected in the calculation be within a range related to the spatial grid size. This condition can be expressed as:
Defining, c is the speed of light in the vacuum. For a spatial grid of cubes, the CFL condition can be written as Bohon (2017):
Even if the numerical solution is stable, the CFL condition does not necessarily make the numerical solution meet the required accuracy. Therefore, in addition to adding restrictions between the time step and the space grid, we also need to make the space grid meet certain conditions. We must note that due to the spatial dispersion, the numerical dispersion relationship of the entire problem space is different from the exact dispersion relation, which leads to the deviation between the numerical solution and the exact solution. In order to ensure accuracy, in general, the selected grid size must satisfy the following formula
That is, the size of the grid is less than 1/12 of the wavelength corresponding to the maximum frequency of the problem to be solved (Hironaka et al., 2015)
2.2 Feature extraction
Feature extraction was achieved as described by Li et al. (2015).
We define the gray level co-occurrence matrix with direction ϕ and interval d as P(i,j,d, ϕ). Among them, L is the number of gray levels of the image, and the data in this study is 16-bit data. The co-occurrence matrix is a huge matrix, which makes it difficult to calculate the post-processing. Therefore, it is necessary to compress the gray level of the data without affecting the image texture information. In this paper, we use the AUC value of single feature under different gray levels (G = 8, 16, 32, 64, 128, 256) to judge. The AUC value is an important indicator for evaluating the classification effect. The larger the AUC value, the better the feature effect (Hassan et al., 2017) (Fig. 1).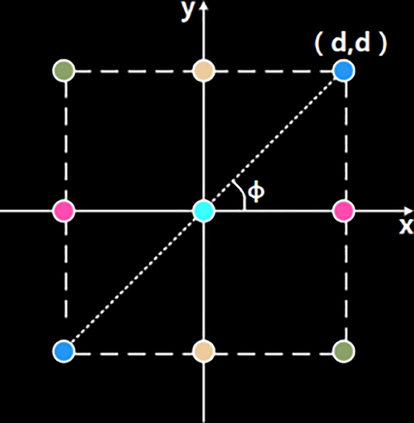
Two-dimensional spatial relationship of pixels.
The meaning of P(i,j,d, ϕ) is the probability that the starting pixel has a gray value of i and the ending gray level is j when the distance is d and the direction is ϕ. Fig. 2 shows a specific case of the calculation of the gray level co-occurrence matrix, in which Fig. 2(a) is a 5 × 5 original image. According to statistics, the gray value of the original image has three values, namely 0, 1, and 2, so the gray level co-occurrence matrix has a dimension of 3 × 3. Assuming that the direction is ϕ = 135° and the distance is d = √2, the matrix (Cvetanovic et al., 2015) shown in Fig. 2(b) is finally obtained by statistics.
Calculation of gray level co-occurrence matrix.
GLCM is able to reflect the texture of the image. Large diagonal values correspond to images with slow texture changes and vice versa. Although the symbiotic matrix has certain distinguishing characteristics, considering that different directions correspond to one symbiotic matrix, the amount of data is large. Therefore, it is not advisable to treat GLCM directly as a feature, but to calculate features based on GLCM.
Traditional texture analysis focuses on two-dimensional images or two-dimensional projection images. For 3D images, it is common practice to select the most representative slices and approximate the three-dimensional results using the analysis results of the two-dimensional slices. The downside is that extracting information from 2D slices is not ideal and ignores vertical information between slices. With the development of 3D medical images, 2D texture analysis methods can no longer satisfy the research on 3D images. Therefore, this study optimizes the 2D texture feature extraction method and uses 3D texture feature extraction method to study the image. The two-dimensional gray level co-occurrence matrix is expanded. The pixels adjacent to the center pixel in two dimensions have eight points, and there are 26 voxels extending into the three-dimensional image adjacent to the central voxel, and the shape is as shown in Fig. 3(a). In a two-dimensional plane, only one angle ϕ is needed for direction control, and when extended to three dimensions, two directions ϕ and θ need to be introduced, as shown in Fig. 3(b) (Dent et al., 2007).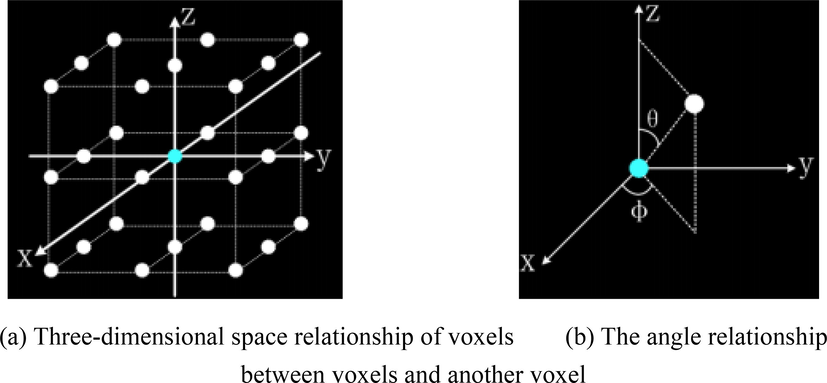
Adjacent relationship of voxels in three-dimensional space.
With the development of medical equipment and the continuous improvement of MRI technology, under the action of contrast agent, multi-temporal spatial scanning of the human body can not only obtain the gray information of a single time point, but also obtain the dynamic enhancement information of tissue and capillary by comparing at different time points. During the scanning process, the patient is required to keep the position, so that the same tissue at different time points can be easily registered according to the similarity. By calculating the enhancement ratio between the enhancement sequence and the mask, as shown in Eq. (4), the information after each voxel enhancement can be obtained. The statistical feature extraction between each enhancement sequence enhancement rate is achieved by using the enhanced information to calculate statistical features.
Among them, S0 represents the sequence of the mask and Si represents the enhanced sequence (Xiao et al., 2015). In the early stage, the image data was extracted, and the image information was reflected by the extracted features. The effect of model training is closely related to the number of input features. If the input features are too small, the features do not reflect the differences between the samples well, and the trained models are under-learned. If there are too many input features, the model is too complicated, the generalization ability of the model is weakened, and the over-fitting state occurs. Therefore, feature extraction and feature selection are all crucial aspects in machine learning. In order to fully describe the original data, sufficient features have been extracted from the aspects of texture, morphology, statistics and enhancement (Sutton et al., 2016).
The flow chart of feature selection is shown in Fig. 4 (Venter et al., 2015).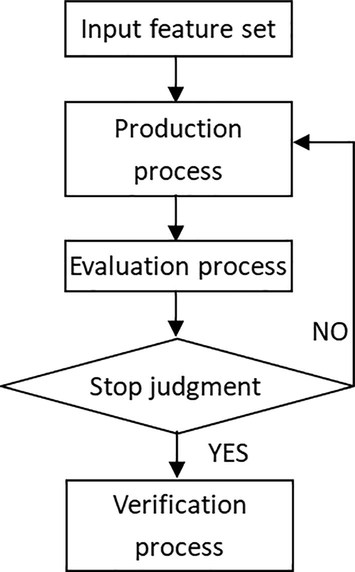
Process of feature selection.
3 Results
Fig. 5 is an MRI source diagram. It can be seen that the conventional MRI source map is blurred, and the boundaries between various types of tissues are not clear. This is caused by noise during MRI angiography and low resolution of MRI's own imaging.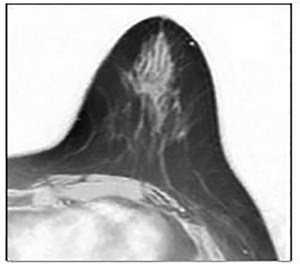
MRI original image.
Fig. 6. In order to extract more accurate boundaries, in the boundary enhancement, the fuzzy boundary information is first extracted, and then the reasonable processing makes the grayscale changes concentrated in a small interval and makes the change intense. After this step, the image boundaries become clearer, as shown in Fig. 6.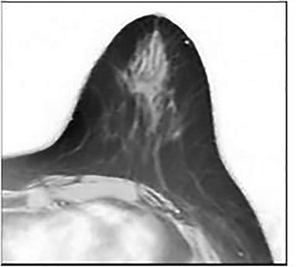
Picture after enhancement processing.
Fig. 7. Due to noise and artifacts, the same type of tissue in the MRI image does not exhibit the same gray value, and some organizations even change greatly, which makes it more difficult to define the electromagnetic properties of the tissue during simulation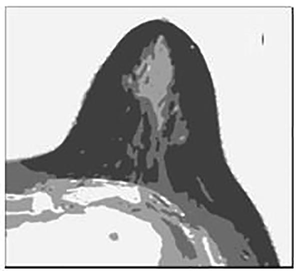
Schematic diagram after organization discretion.
Fig. 8. After discrete processing, various organizations appear to be clearly seen. Fig. 9 is a schematic diagram of a three-dimensional MRI-FDTD model of a single-sided breast: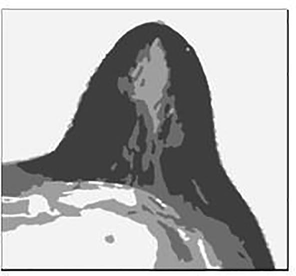
Final image after the isolated islands eliminated.
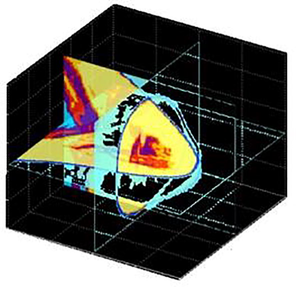
Three-dimensional MRI-FDTD model of the breast.
After FDTD simulation, the received signal is imaged by the confocal algorithm, and the breast reconstruction map is obtained as shown in Fig. 10.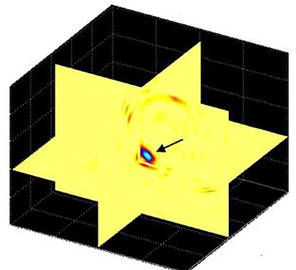
Confocal imaging results of 3D MRI-FDTD model simulation.
4 Discussion
Early stage breast cancer tumor detection is critical for treating and managing the disease condition (Zhao et al., 2017; Saidha et al., 2017). The study described in details the derivation methods, derivation processes and how they are applied in tumor detection simulation. Based on the tissue segmentation model, the effect of the number of glandular tissues on imaging outcome is examined. Studies have shown that the more glandular tissue, the worse the imaging effect in the later stages (Snehal, 2015). At the same time, based on the model, a progressive method for detecting multiple tumors is proposed. The method divides the imaging into three steps: preliminary examination, refocusing, and image optimization, and each tumor is successfully detected, and this agrees with the report of (Hala and Ali, 2010). Here, the FDTD 2D model is derived based on MRI, and its steps include breast contour extraction, tissue dispersion, and skin addition. The FDTD simulation test was carried out by using the two-dimensional model, and the applicability of the imaging algorithm in the MRI derived breast FDTD model was verified. Finally, using the interpolation method, the 3D FDTD model was derived, and the model was used to simulate the tumor detection, and the tumor was imaged. The simulation results of the above three morphologically realistic breast models show that the imaging algorithm has certain applicability in the case of non-uniform breast tissue, but the effect will be degraded (Rafael et al., 2005).
The gray values based on the MRI map are used to discretize the tissues of the breast. Air outside the breast is treated prior to tissue discretization. Due to noise, etc., the gray value of the air will be somewhat different in the MRI source map. Therefore, when discretized, air may be divided into different classes of substances. However, in the breast electromagnetic wave model, it is only necessary to define air as a substance, so that the air portion is subjected to uniform gray value processing once. The specific method is: The outline of the breast is used as a limit, and each pixel is judged from top to bottom. If the pixel does not reach the contour boundary, then the point is outside the breast, regardless of its original gray value, and is re-assigned to 0. However, when the boundary point is reached, the assignment is stopped, and the portion below the boundary retains the original gray value. In the longitudinal processing, some air that is blocked by the steeper boundary is not involved. Therefore, we use a method similar to the boundary to complete the air re-evaluation from the left and right sides of the breast to ensure that all parts of the breast are uniformly classified as air, and the gray value is zero.
The primary method of discrete processing is to set the gray value threshold. Pixels that are within a certain threshold range are grouped into the same type of organization and uniformly assigned. Since the gray value of a certain type of tissue in the MRI image may be greatly changed, the internal division of the tissue is further subdivided, for example, the gland is divided into a gland 1 and a gland 2. This method of division is consistent with reality, because the real breasts are inherently non-uniform, and even if they are medically classified as the same type of tissue, the electromagnetic parameter values may vary greatly.
A tissue-based breast model was derived based on clinical MRI medical images, and the model was used to study the effect of the number of glands on the final imaging results (Rafael et al., 2005). At the same time, based on the model, a method for detecting multiple tumors is proposed, and the effectiveness of the method is verified by simulation results. In addition to this, a two-dimensional breast model for the FDTD algorithm is derived based on clinical MRI medical images, in which a method of enabling the skin to fully conform to the breast contour is described in detail. Moreover, the model truly reflects the contours of the breast and the distribution of internal tissues. The derived 2D model is then coupled to the FDTD simulation algorithm. Finally, the two-dimensional model is used to test the FDTD simulation, and the applicability of the imaging algorithm in the MRI-derived breast FDTD two-dimensional model is verified.
By interpolating the MRI map, the corresponding MRI-FDTD two-dimensional model slices are derived and stacked to establish a three-dimensional model. Then, the derived 3D model is coupled with the FDTD simulation algorithm. Finally, using the MRI-FDTD three-dimensional model, the simulation test is carried out and the simulated signal is imaged, which verifies the applicability of the algorithm in the MRI-FDTD three-dimensional model.
It can be seen from Fig. 10 that the tumor position is basically the same as the preset condition, which indicates the applicability of the confocal algorithm in the three-dimensional MRI model, and also indicates that the model is correctly established.In conclusion, the 2D image obtained from 2D extraction feature is transformed to achieve 3D transformation, and finally the specific location of the tumor is found. The research result has shown that the model proposed in this study has certain practical effects in tumor imaging.
Funding
We got no funding for the study.
Declaration of Competing Interest
The authors declare that they have no known competing financial interests or personal relationships that could have appeared to influence the work reported in this paper.
References
- Cancer recognition and screening for common breast disorders and malignancy. Obstet. Gynecol. Clin. North Am.. 2017;44(2):257-270.
- [Google Scholar]
- MicroRNA-519a-3p mediates apoptosis resistance in breast cancer cells and their escape from recognition by natural killer cells. Cell Death Dis.. 2017;8(8):e2973
- [Google Scholar]
- Young age and pathological features predict breast cancer outcome – report from a dual Institution experience in Serbia. J. Balkan Union Oncol.. 2015;20(6):1407.
- [Google Scholar]
- Triple-negative breast cancer: clinical features and patterns of recurrence. Clin. Cancer Res.. 2007;13(15):4429-4434.
- [Google Scholar]
- Pattern recognition approaches for breast cancer DCE-MRI classification: a systematic review. J. Med. Biol. Eng.. 2016;36(4):449-459.
- [Google Scholar]
- Hala, Al-Shamlan, Ali, El-Zaart, 2010. Feature Extraction Values for Breast Cancer Mammography Images, IEEE, 978-1-4244-6775-4/10/$26.00.
- In vitro selections of mammaglobin A and mammaglobin B aptamers for the recognition of circulating breast tumor cells. Sci. Rep.. 2017;7(1):14487.
- [Google Scholar]
- P019 Histopathological features of operable breast cancer detected in women younger than 35 years. Breast. 2015;24:S32.
- [Google Scholar]
- Breast cancer discriminant feature analysis for diagnosis via jointly sparse learning. Neurocomputing. 2016;177:198-205.
- [Google Scholar]
- Accelerated Whole-breast irradiation is comparable to conventional fractionation in breast cancer patients with adverse features and is gentler in skin toxicity. Int. J. Rad. Oncol. Biol. Phys.. 2016;96(2):E39.
- [Google Scholar]
- Specific recognition of breast cancer cells in vitro using near infrared-emitting long-persistence luminescent Zn3Ga2Ge2O10:Cr3+nanoprobes. Nano-Micro Lett.. 2015;7(2):138-145.
- [Google Scholar]
- Comparative analysis of breast cancer detection in mammograms and thermograms. Biomed. Eng.. 2015;60(1):49-56.
- [Google Scholar]
- Identification of sentinel lymph nodes using contrast-enhanced ultrasound in breast Cancer. Indian J. Surg. Oncol.. 2017;6:1-7.
- [Google Scholar]
- Rafael, Llobet, Roberto, Paredes, Perez-Cortes, Juan C., 2005. Comparison of Feature Extraction Methods for Breast Cancer Detection IbPRIA 2005, LNCS 3523. pp. 495–502.
- Diagnosing breast cancer with an improved artificial immune recognition system. Soft. Comput.. 2016;20(10):4069-4084.
- [Google Scholar]
- Snehal, A., Mane, Dr., Kulhalli, K.V., 2015. Mammogram image features extraction and classification for breast cancer detection. Int. Res. J. Eng. Technol. 2(7).
- Breast cancer molecular subtype classifier that incorporates MRI features. J. Magn. Reson. Imaging. 2016;44(1):122-129.
- [Google Scholar]
- Workplace support after breast cancer treatment: recognition of vulnerability. Disabil. Rehabil.. 2015;37(19):7.
- [Google Scholar]
- Cancer-associated mutations in breast tumor kinase/PTK6 differentially affect enzyme activity and substrate recognition. Biochemistry. 2015;54(20):3173-3182.
- [Google Scholar]
- Phyllodes tumor: diagnostic imaging and histopathology findings. Rom. J. Morphol. Embryol.. 2015;56(4):1397-1402.
- [Google Scholar]
- Simultaneous topographic and recognition imaging of epidermal growth factor receptor (EGFR) on single human breast cancer cells. BBA – Biomembranes. 2015;1848(10):1988-1995.
- [Google Scholar]
- Diagnostic and prognostic values ofcontrast-enhanced ultrasound in breast cancer: a retrospective study. Onco. Ther.. 2017;10:1123-1129.
- [Google Scholar]
- Assessing the potential of thermal imaging in recognition of breast cancer. Asian Pacific J. Cancer Prevent. Apjcp. 2015;16(18):8619.
- [Google Scholar]
- Breast cancer tumor type recognition using graph feature selection technique and radial basis function neural network with optimal structure. J. Cancer Res. Ther.. 2018;14(3):625.
- [Google Scholar]
- Classification of benign and malignant breast tumors in ultrasound images with posterior acoustic shadowing using half-contour features. J. Med. Biol. Eng.. 2015;35(2):178-187.
- [Google Scholar]


