

Translate this page into:
Identification and characterization of testis-specific gene expressions in mouse tissues
⁎Corresponding author at: Zoology Department, College of Science, King Saud University, Riyadh, Saudi Arabia. malmutari@ksu.edu.sa (Mikhlid H. Almutairi)
-
Received: ,
Accepted: ,
This article was originally published by Elsevier and was migrated to Scientific Scholar after the change of Publisher.
Peer review under responsibility of King Saud University.
Abstract
The growth and fertilization of germ cells require the identification and characterization of their unique genes. Because the processes that take place in male germ cells are unique; that is, they do not occur in any other tissue. The testis is a specialized male gonad with complicated gene expressions for spermatogenesis and steroidogenesis. RT-PCR analysis was performed to determine whether the candidate genes selected from the NCBI database are true genes with testis-specific expressions in mice. In total, 20 testis-specific genes were selected randomly and examined in 15 adult mouse tissue samples, including the testis. The expression profiles of the 20 selected genes in the 15 mouse tissue samples showed 3 expression categories: ubiquitously expressed genes, which were detected in all types of mouse tissues; the testis-predominant genes, which were not detected in all mouse tissue samples, were strongly expressed in the testis and weakly expressed in a few types mouse tissue; and the testis-specific genes, which were exclusively expressed in the mouse testis, were not observed in non-testicular tissues. Of the 20 characterized genes, the testis-specific genes include Adad1, Dmrtc2, Luzp4, Prm2, Prss54, and Syce1, which may play a role in meiosis and/or spermatogenesis. Therefore, further research is required to elucidate the functional importance of these identified testis-specific genes in mouse male fertility.
Keywords
Testis-specific gene
Testis-predominant gene
NCBI database
Ubiquitously expressed gene
Mouse
Expression

1 Introduction
The testis is a unique male gonad with two main functions: spermatogenesis, the production of male haploid gametes and steroidogenesis, the synthesis of the steroid hormones that support male fertility's maturation and function (Liu et al., 2011, O'Hara and Smith, 2015, Pineau et al., 2019). Mammalian spermatogenesis is a highly complicated process with tightly regulated molecular pathways (Chocu et al., 2012, Suede et al., 2022). This process was divided into 3 phases: (1) the mitotic division of primary germ cells (spermatogonia) to differentiate into spermatocytes, (2) active division of spermatocytes by meiotic division by meiotic division to produce haploid spermatids, and (3) the differentiation of spermatids into motile mature spermatozoa (Chocu et al., 2012). This series of events is tightly controlled and regulated by a large group of genes involved in successful spermatogenesis completion (Grimes, 2004, Khan et al., 2020). Thus, the identification and characterization of these genes would shed light on the mechanisms underlying spermatogenesis (Tang et al., 2007).
In addition, studying the gene specialization of various tissues and investigating the set of core genes active in each tissue would aid in understanding how tissues differ from each another and their functions (Ramskold et al., 2009). In the testis, thousands of genes are activated and repressed to carry out testicular functions, making the highest number of tissue-specific genes in the testis (Cazin et al., 2021, Khan et al., 2018, Pineau et al., 2019, Schultz et al., 2003). These genes can be divided into three categories according to their expression specificity. First, ubiquitously expressed genes are expressed in all types of tissues, including the testis (Ramskold et al., 2009). The products encoded by these genes are essential for appropriate function in the testis and all other tissues (Grimes, 2004). Second, testis-predominant genes are expressed abundantly in the testis but weakly in other normal tissues (Choi et al., 2004, Lee et al., 2013). Third, testis-specific genes are expressed excessively in the testis but are silent in other tissues (Grimes, 2004, Khan et al., 2020, Liu et al., 2011, Tang et al., 2007).
Approximately 4000 genes are involved in spermatogenesis and are expressed in the human testis; however, only few of these genes have been extensively studied so far (Cazin et al., 2021). Furthermore, Schultz et al. (2003) and Khan et al. (2018) reported that more than 2300 genes have testis-specific or testis-predominant expression in mice (Khan et al., 2018, Schultz et al., 2003). It is also hypothesized that several of these genes have crucial roles in spermatogenesis and/or fertility. However, the functions of most of these genes remain vague and unknown. The expression specificity of various testis-specific genes has not been completely studied. Therefore, studying the expression pattern of testis-specific genes might provide the groundwork for future research focused on genes that are fundamental for spermatogenesis, reproduction (Brown, 2019, Schultz et al., 2003), and clinical application as potential targets for the diagnosis of reproductive diseases and disorders such as male infertility (Schultz et al., 2003). The primary goal of this research was to validate the expression profiles of 20 testis-specific genes selected randomly from the NCBI database in 15 tissue samples from different mouse organs, including the testis, using RT-PCR analysis to determine whether the candidate genes selected from the NCBI database are true genes with testis-specific expressions in mice.
2 Materials and methods
2.1 Ethics statement and sample collection
The ethics committee of King Abdullah International Medical Research Center ethically approved this study under institutional review board reference No. IRB/1201/22 (study No. SP22R/076/04). Mature male and female SWR/J mice aged 10–12 weeks that weighed 30–35 g were obtained from the Experimental Animal Care Center, College of Pharmacy, King Saud University, Riyadh, Saudi Arabia. Tissues were isolated from the testis, brain, spinal cord, heart, spleen, liver, stomach, small intestine, colon, kidney, urinary bladder, and prostate of male mice and from the breast, ovary, and uterus of female mice.
2.2 RNA isolation and complementary DNA (cDNA) synthesis
Approximately 30 mg of each mouse tissue was used to isolate the total RNA using an All-Prep DNA/RNA Mini Kit (80204; Qiagen). A total of 2 μg of RNA was reverse transcribed into cDNA from each sample using a High-Capacity cDNA Reverse Transcription Kit (4368814; Applied Biosystems).
2.3 Primer design for reverse transcription PCR (RT-PCR)
Within the coding sequences (CDSs) of the selected genes (available at https://www.ncbi.nlm.nih.gov/), all RT-PCR primers were designed manually by following the optimal criteria, including a primer length of 20 nucleotides, 50% G-C content for each primer, intron-spanning primers, and designing the forward and reverse primers without intermolecular or intramolecular interactions. The sequences of all the designed primers are listed with their amplicon sizes in Table 1. Abbreviations: A: adenine; T: thymine; C: cytosine; G: guanine; Chr; chromosome; Ta: annealing temperature; bp: base pair.
Gene
Chromosomal location
Category
Primer sequence (5′→3′)
Ta*
Amplicon size (bp)
Actb
Chr 5
Forward
ReverseGTATCCTGACCCTGAAGTAC GGCATAGAGGTCTTTACGGA
58 °C
698
Adad1
Chr 3
Forward
ReverseGCACGATACTCATGCAGTTG TAGGCCATCCACAATCTCCA
58 °C
664
Adam29
Chr 8
Forward
ReverseACAGGATGACTGCTACTACC ACTCCAATGGCACGAAGGTT
58 °C
693
Cabs1
Chr 5
Forward
ReverseACCACCATTGACACAGGAGA
TACCTCGATTCCACAGCAGT58 °C
515
Cabyr
Chr 18
Forward
ReverseTTGTACCCTATGGCCTCAAG ACCTAACATCTGAGCGGCAA
58 °C
524
Cpxcr1
Chr X
Forward
ReverseACACCAAATGCCTGTGAGGA
TTGGTGACATTCTGCCTGAG58 °C
513
Dmrtc2
Chr 7
Forward
ReverseACTGTTCTGCTGACTCTTCC
AGAAAGTGGAGCCGTCAGTA58 °C
698
Fthl17a
Chr X
Forward
ReverseTTACCTGTCGGAGTCTAACG
TTGAGGATCTCTACCTGCTG58 °C
405
Ldhc
Chr 7
Forward
ReverseTGCTCCAACGTAATGTCGCT
TCCTTTATCCCATGGAAGCC58 °C
529
Luzp4
Chr X
Forward
ReverseACAGTCAGAAAGCTCCAGAG
GCCATGTTGAAGCCTAACTG58 °C
517
Odf1
Chr 15
Forward
ReverseTACTGCCTCTGCTACTCCAA
TGGGTTGCAAGGATTACAGG58 °C
441
Odf3
Chr 7
Forward
ReverseACAGTGTGAACCCCAAGATC
TGCTTGATGCCAAAGGTGAC58 °C
517
Prm2
Chr 16
Forward
ReverseTAGAGGACTATGGGAGGACA
TCCTACATTTCCTGCACCTG58 °C
201
Prss54
Chr 8
Forward
ReverseCATTCTCAGCGAGTTCTGGA
GCTTGTTGGACTTAGTGGAC58 °C
764
Spata19
Chr 9
Forward
ReverseTCGGAGCATAAGGGAGAAGA
CTATTCGTTCCTGCATGACG58 °C
230
Stra8
Chr 6
Forward
ReverseCCTGGATAAGTTGCTGAAGC
CAGGAAACTTGCCACGTCAA58 °C
724
Syce1
Chr 7
Forward
ReverseGACAACCTGCAGAAGGAACT
CTCGTGGACTTCTACAGGTT58 °C
699
Sycp1
Chr 3
Forward
ReverseGCAAGTGATATGGCCCTAGA
TCGCTGATGACTGTTCTTGC58 °C
700
Tex101
Chr 7
Forward
ReverseACTGGACTTCAAAGGCTGAG
ACTGGTAACTACAGGTCTCC58 °C
507
Tex48
Chr 4
Forward
ReverseGTGAGGAACCTGTTATTGAGA
TGTTCCTGGTAGTAGCGGTT58 °C
241
Tmprss12
Chr 15
Forward
ReverseATAGGAGGTTCGCAAGCTGA
TTCGTGACCTGCACAGAATG58 °C
537
2.4 RT-PCR amplification and agarose gel electrophoresis
Each RT-PCR reaction for each gene contained 10 μL of BioMix Red (BIO-25006; BioLine), 8.4 µL of nuclease-free water, 0.8 µL of each forward and reverse primers (10 μM), and 0.8 µL of diluted cDNA. RT-PCR cycle setup and gel electrophoresis were performed as described in previous paper (Almutairi et al., 2022b). A mouse Actb was used to confirm the cDNA efficiency and the testis cDNA was used to determine the primer efficiency of all tested genes.
2.5 Sequence analysis of the RT-PCR products
The sequences of the RT-PCR amplification products were analyzed to confirm the specificity of the selected genes as described in previous work (Almutairi et al., 2022a).
2.6 Building a phylogenetic tree of the testis-specific genes
Initially, the amino acid sequences of the testis-specific genes in the different selected eutherian species were retrieved from the NCBI database. Multiple protein sequence alignments were then performed using the T-Coffee tool to determine the percent identity. The MEGA-11 online software (https://www.megasoftware.net/) was then used to generate phylogenetic trees and conduct evolutionary studies (Tamura et al., 2021).
2.7 Construction of the gene-gene interaction network
The testis-specific gene-gene interaction network and functional connections were constructed using algorithms from the GeneMANIA prediction service (University of Toronto, Toronto, Canada) to perform a network analysis of shared genes and forecast related genes (Warde-Farley et al., 2010).
2.8 Genotype-tissue expression (GTEx) database
The GTEx database (Carithers et al., 2015) was applied to validate the findings using publicly accessible data. By using the gene symbols or IDs of interest, the GTEx portal was queried, and the gene expressions were retrieved from the normalized transcripts per million (TPM) data as a heatmap. The heatmap was created using the R programming language and rendered with the heatmap package.
3 Results
3.1 Expression profiles of the selected genes in the GenBank database
In the present study, 20 testis-restricted expression genes from the Embank database were selected: Adam29, Cabs1, Cpxcr1, Fthl17a, Sycp1, Caber, Stra8, Tex101, Odf3, Tex48, Ldhc, Odf1, Spata19, Tmprss12, Adad1, Dmrtc2, Luzp4, Prm2, Prss54, and Syce1. These genes were exclusively expressed in the adult testis and were not detected in any of the other 11 mouse tissues, as shown in Table 2. Abbreviation: RPKM: reads per kilobase per million.
Official gene symbol
Expression in tissue (RPKM*)
Brain
Heart
Spleen
Liver
Stomach
Small intestine
Colon
Kidney
Urinary bladder
Prostate
Ovary
Testis
Adad1
0.0
0.0
0.0
0.0
0.0
0.0
0.0
0.0
0.0
0.0
0.0
32.6
Adam29
0.0
0.0
0.0
0.0
0.0
0.0
0.0
0.0
0.0
0.0
0.0
7.0
Cabs1
0.0
0.0
0.0
0.0
0.0
0.0
0.0
0.0
0.0
0.0
0.0
93.9
Cabyr
0.5
0.0
0.0
0.3
0.0
0.0
0.0
0.4
0.0
0.0
0.0
63.2
Cpxcr1
0.0
0.0
0.0
0.0
0.0
0.0
0.0
0.0
0.0
0.0
0.0
3.2
Dmrtc2
0.0
0.0
0.0
0.0
0.0
0.0
0.0
0.0
0.0
0.0
0.0
39.5
Fthl17a
0.0
0.0
0.0
0.0
0.0
0.0
0.0
0.0
0.0
0.0
0.0
14.6
Ldhc
0.0
0.0
0.0
0.0
0.0
0.0
0.0
0.0
0.0
0.0
0.0
1111.1
Luzp4
0.0
0.0
0.0
0.0
0.0
0.0
0.0
0.0
0.0
0.0
0.0
4.4
Odf1
0.0
0.0
0.0
0.0
0.0
0.0
0.0
0.0
0.0
0.0
0.0
1293.5
Odf3
0.0
0.0
0.0
0.0
0.0
0.0
0.0
0.0
0.0
0.0
0.0
228.7
Prm2
0.0
0.0
0.0
0.0
0.0
0.0
0.0
0.0
0.0
0.0
0.0
5910.5
Prss54
0.0
0.0
0.0
0.0
0.0
0.0
0.0
0.0
0.0
0.0
0.0
70.8
Spata19
0.0
0.0
0.0
0.0
0.0
0.0
0.0
0.0
0.0
0.0
0.0
181.3
Stra8
0.0
0.0
0.0
0.0
0.0
0.0
0.0
0.0
0.0
0.0
0.0
3.0
Syce1
0.0
0.0
0.0
0.0
0.0
0.0
0.0
0.0
0.0
0.0
0.0
109.7
Sycp1
0.0
0.1
0.2
0.0
0.0
0.0
0.1
0.0
0.0
0.0
0.1
3.6
Tex101
0.0
0.0
0.0
0.0
0.0
0.0
0.0
0.0
0.0
0.0
0.0
185.4
Tex48
0.0
0.0
0.0
0.0
0.0
0.0
0.0
0.0
0.0
0.0
0.0
177.4
Tmprss12
0.0
0.0
0.0
0.0
0.0
0.0
0.0
0.0
0.0
0.0
0.0
14.1
3.2 RT-PCR expression profiles of the ubiquitously expressed genes in the different adult mouse tissues
The selected genes from the GenBank database that showed testis-specific expressions were then investigated the testis specificity using RT-PCR analysis and 15 different tissues isolated from adult mice. These tissues are described in Section 2.1. Our results showed that the Adam29, Cabs1, Cpxcr1, Fthl17a, and Sycp1 genes were expressed in all the tested tissues, including the testis (Fig. 1). The strengths of their expressions were facultative among the mouse tissues. In other words, their expressions differed in pace between the studied tissues, which means that both thick and faint bands were observed for each gene in the different mouse tissues. The Adam29, Cabs1, Cpxcr1, Fthl17a, and Sycp1 genes showed excessive expression not only in the testis but also in other tissues. For example, the expression of the Adam29 gene was stronger in 6 of the 14 tissues other than the testis. It was also expressed as fainter bands in the brain, spinal cord, heart, liver, stomach, colon, kidney, and breast tissues. Cabs1 gene expression was stronger in the spleen, small intestine, prostate, breast, ovary, and uterus tissues than in the brain, spinal cord, heart, liver, stomach, kidney, and urinary bladder tissues. For the Cpxcr1 gene, the strongest bands in the tissues other than the testis were observed in the spleen, prostate, and breast tissue samples, while the bands in the other tissue samples were relatively within the same range. The RT-PCR amplification results of the Fthl17a and Sycp1 genes showed that they were also expressed strongly in the spleen and small intestine tissues. Overall, the Adam29, Cabs1, Cpxcr1, Fthl17a, and Sycp1 genes are non-testis specific, as indicated in the GenBank database, because they were detected in all mouse tissues. Therefore, they should be reclassified as ubiquitously expressed genes according to their expression patterns observed in all types of examined tissues.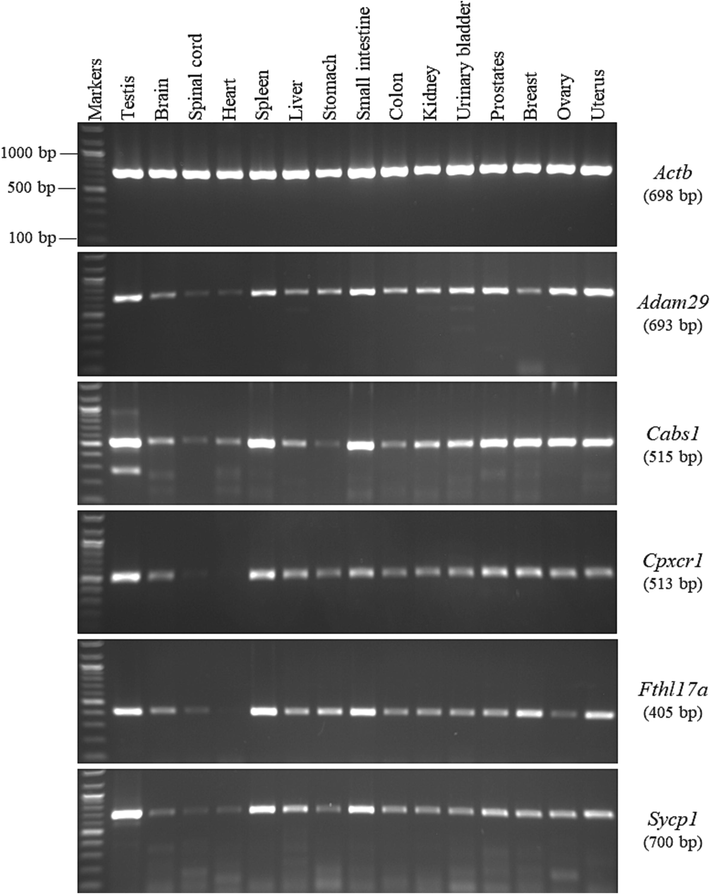
RT-PCR expression profiles of the ubiquitously expressed genes in the different mouse tissues. The agarose gel images show the RT-PCR analysis results for the Adam29, Cabs1, Cpxcr1, Fthl17a, and Sycp1 genes. To the right of the agarose gel images are the official symbols for the genes, followed by the predicted sizes of the resulting products in brackets.
3.3 RT-PCR expression profiles of the testis-predominant genes in the different adult mouse tissues
A total of 9 genes (Cabyr, Stra8, Tex101, Odf3, Tex48, Ldhc, Odf1, Spata19, and Tmprss12) were expressed strongly in the testis and weakly in other mouse tissues (Fig. 2). Thus, these genes cannot be considered as testis specific, as described in the GenBank database (Table 2). They were categorized as testis-predominant genes because their expressions were not observed in all tissues and showed strong expressions in the testis and weaker expressions in a few other mouse tissues. In detail, the gel electrophoresis result of the Cabyr gene showed a strong band in the testis and 3 faint bands in the brain, liver, and stomach. For the Stra8 gene in the testis cDNA, the anticipated RT-PCR product size was 724 bp (Table 1), but the PCR results in the stomach, small intestine, and urinary bladder revealed a band approximately 800 bp in size. However, this larger band based on the sequence analysis was related to the Stra8 gene (Table 3), which may indicate a new splice variant. Thus, the Stra8 gene was categorized as testis predominant. In the RT-PCR analysis for Tex101, a strong signal was observed in the testis and 4 weak signals were detected in the stomach, small intestine, kidney, urinary bladder, and prostate; however, no significant signal was observed in the other mice tissues. Moreover, the expression patterns of the Odf3 and Tex48 genes was found in 33% of the mouse tissues However, the strongest expressions of both genes were observed only in the testis. Likewise, Ldhc was expressed in 60% of the mouse tissues, but its expression was stronger in the testis. Furthermore, the detection frequency of the Spata19 and Odf1 genes was 60% and 53%, respectively in the mouse tissues. Spata19 was expressed in the testis, brain, heart, stomach, small intestine, kidney, urinary bladder, and prostate. However, Odf1 was expressed in the same tissues, except the brain. Tmprss12 was expressed in 60% of the mouse tissues.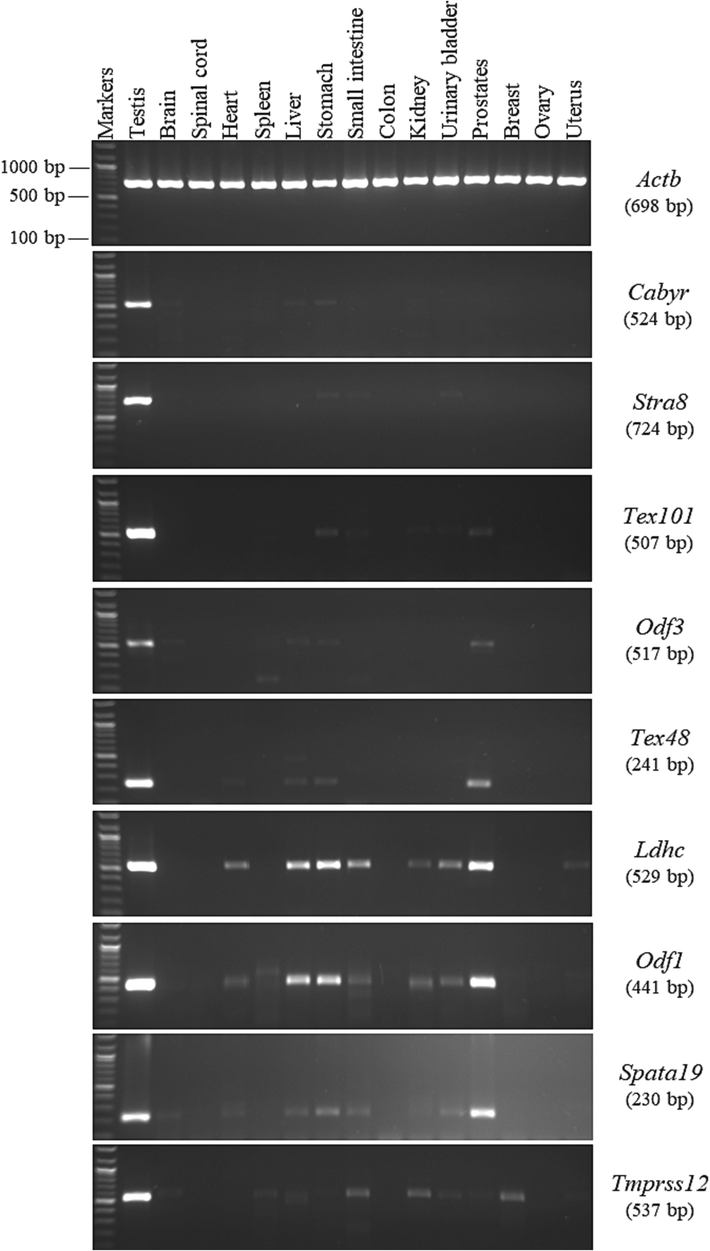
RT-PCR expression profiles of the testis-predominant genes in the different mouse tissues. The agarose gel images show the RT-PCR analysis results for the Cabyr, Stra8, Tex101, Odf3, Tex48, Ldhc, Odf1, Spata19, and Tmprss12 genes. To the right of the agarose gel images are the official symbols for the genes, followed by the predicted sizes of the resulting products in brackets.
Gene
Primer direction
Sequenced in mouse tissues
Sequence identity (%)
Adad1
Forward
ReverseSmall intestine
0.00
0.00
Forward
ReverseColon
0.00
0.00
Stra8
Forward
ReverseStomach
99.41
99.41
Forward
ReverseSmall intestine
95.63
98.66
Luzp4
Forward
ReverseProstates
0.00
0.00
Forward
ReverseBreast
0.00
0.00
Cabyr
Forward
ReverseLiver
97.82
92.95
Forward
ReverseStomach
99.78
99.58
Tex101
Forward
ReverseStomach
93.50
95.19
Forward
ReverseProstates
99.55
98.26
Tex48
Forward
ReverseStomach
98.44
98.48
Forward
ReverseProstates
98.44
98.48
Odf3
Forward
ReverseStomach
86.16
80.31
Forward
ReverseProstates
82.80
87.76
Prss54
Forward
ReverseStomach
0.00
0.00
Forward
ReverseSmall intestine
0.00
0.00
To verify the RT-PCR findings, we used DNA sequence analysis on a subset of RT-PCR products for 4 testis-predominant genes. When compared with the reference sequences in the NCBI database using the BLAST program, the DNA sequencing results for the Cabyr, Odf3, Tex101, and Tex48 PCR products in the tissues showed sequence similarity to the Cabyr, Odf3, Tex101, and Tex48 genes (Table 3). Therefore, these results are consistent with the RT-PCR results, and these genes can no longer be considered testis specific and should be included among the testis-predominant genes in mice.
3.4 RT-PCR expression profiles of the testis-specific genes in the different adult mouse tissues
By contrast, the RT-PCR screening results of the last 6 of our selected genes indicated that the expression patterns of the Adad1, Dmrtc2, Luzp4, Prm2, Prss54, and Syce1 genes in the 15 different mouse tissues were restricted to the testis, and no indication of RT-PCR expression was found in the other tissue samples (Fig. 3). The RT-PCR analysis for Adad1 analysis in the small intestine and colon tissues revealed an unexpectedly large faint band (approximately 730 bp), compared with the anticipated band in the testis (664 bp). However, the sequence of this large band was not related to the Adad1 gene (Table 3). Moreover, the sequence results of the RT-PCR amplification product of Luzp4 confirmed that the unexpected small band of approximately 420 bp that appeared in the prostate and breast tissues was not related to the Luzp4 gene compared with the anticipated band in the testis (517 bp). The RT-PCR amplification results of the Prss54 gene showed that the small faint bands of the PCR products had an unexpected size of approximately 550 bp compared with the anticipated size of 764 bp. However, these bands were not related to the Prss54 gene according to the sequence outcome. Thus, this gene is testis specific because the anticipated band was only observed in the testicular tissue, and not in the other mouse tissues. Finally, the study findings regarding the testis specificity of the Adad1, Dmrtc2, Luzp4, Prm2, Prss54, and Syce1 genes are consistent with those reported in the NCBI database. In this study, by using the RT-PCR technique, the Adad1, Dmrtc2, Luzp4, Prm2, Prss54, and Syce1 genes were identified to be the only testis-specific genes among the 20 genes selected. Thus, these testis-specific genes could have potential usefulness in several medical applications such as the diagnosis of reproductive diseases.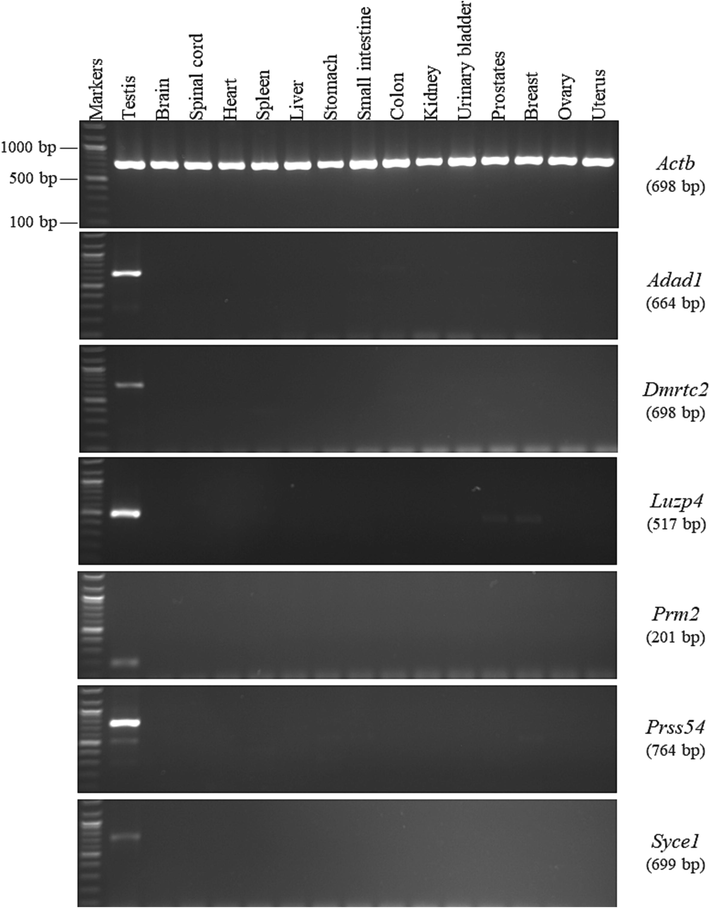
RT-PCR expression profiles of the testis-specific genes in the different mouse tissues. The agarose gel images show the RT-PCR analysis results for the Adad1, Dmrtc2, Luzp4, Prm2, Prss54, and Syce1 genes. To the right of the agarose gel images are the official symbols for the genes, followed by the predicted sizes of the resulting products in brackets.
3.5 Phylogenetic trees of the identified testis-specific genes
For phylogeny, multiple protein sequence alignments of different placental mammals for each individual testis-specific gene (Adad1, Dmrtc2, Luzp4, Prm2, Prss54, and Syce1) were applied by using ClustalW. The phylogenetic analysis of the testis-specific genes in the mouse tissues and their orthologs showed a high level of sequence resemblance, which implies that the proteins are conserved in mice and other various eutherian species. Moreover, the generated phylogenetic trees showed that the mouse and rat shared the closest evolutionary relationship among the testis-specific genes, indicating that they may have shared a common ancestor (Fig. 4).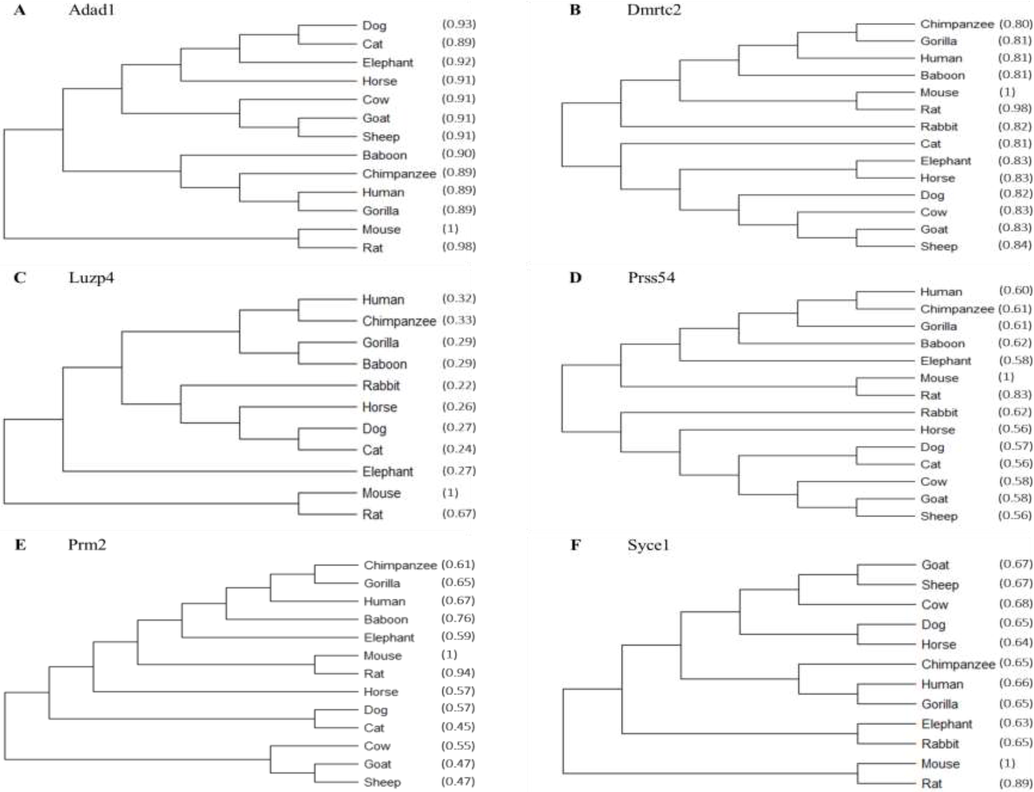
Conservation of testis-specific genes in eutherians. Multiple protein sequence alignments were carried out with the T-Coffee program, and phylogenetic trees were built using the MEGA-11 software. The phylogenies of (A) Adad1, (B) Dmrtc2, (C) Luzp4, (D) Prss54, (E) Prm2, and (F) Syce1 are shown. The percent identity of each eutherian species sequence relative to the reference sequence (mouse:1) is shown in parentheses.
3.6 Gene-gene interaction network of the identified testis-specific genes
The GeneMANIA program was used to construct the gene-gene interaction network to analyze the co-expression of the testis-specific genes that were overexpressed in the mouse testis but not in the other tissues and to identify the testis-specific genes that play critical roles in the spermatogenesis process (Fig. 5). The central network is the reference network, whereas the surrounding networks are representative of the testis-specific genes. Each network contained the core node that represented the testis-specific gene members and the 15 surrounding nodes that exemplified the most frequently adjacent genes that were strongly connected with the testis-specific genes. The testis-specific genes' interactions to their neighbors are shown in purple. The red circle indicates the spermatogenic gene that is only found in the testes.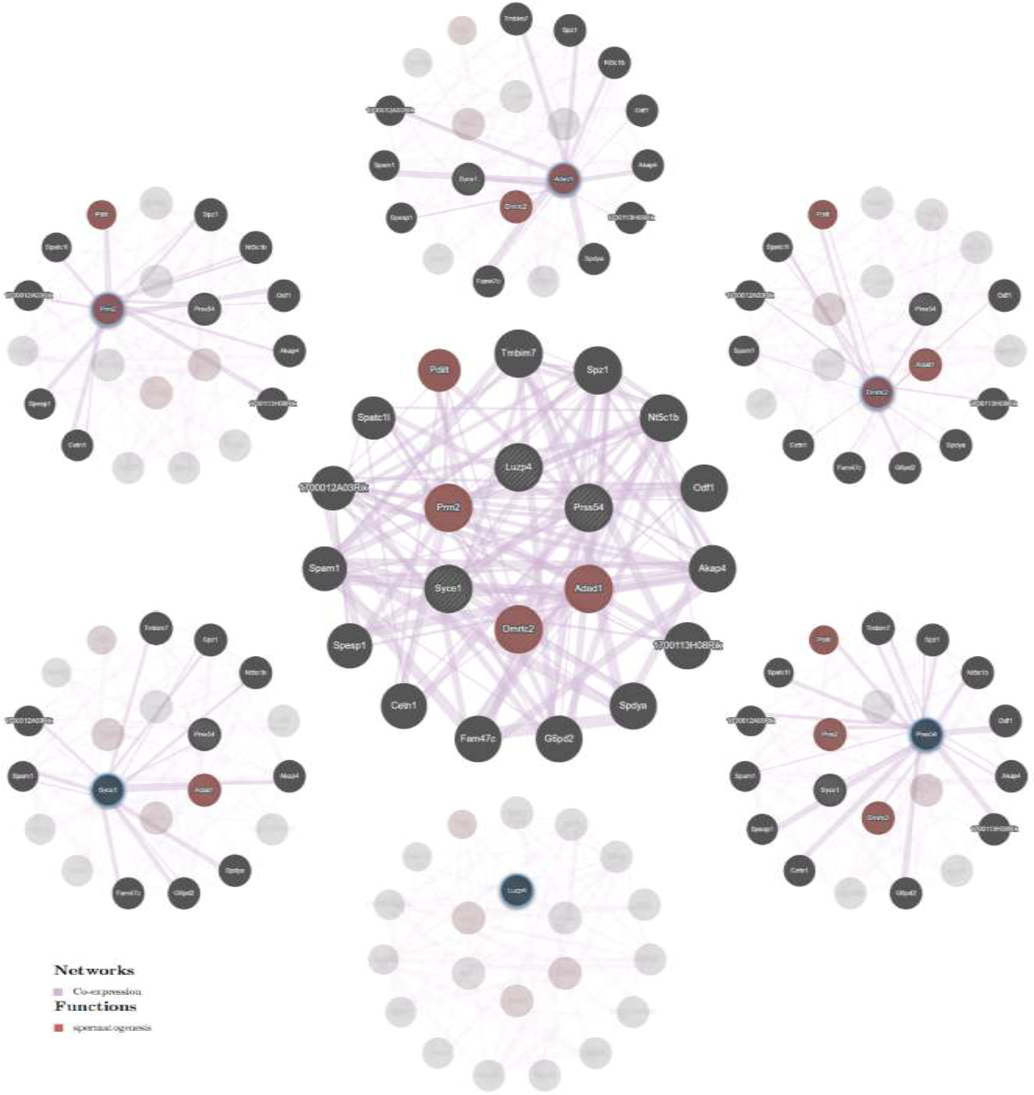
GeneMANIA database-based network of gene-gene interactions for testis-specific genes. Each central node represents the testis-specific gene (shown as circles). The top 15 most frequent adjacent genes highly connected to testis-specific genes are shown. The edges represent the interactions between the testis-specific genes and other genes (shown as lines). Genes involved in spermatogenesis are colored red.
The results of the bioinformatic analyses showed that the Prm2, Dmrtc2, and Adad1 genes of the 6 identified testis-specific genes are involved in spermatogenesis in mice, whereas the remaining 3 genes (Syce1, Prss54, and Luzp4) are not. Moreover, only Pdit among the 15 neighboring genes plays a role in spermatogenesis. Regarding the functional testis-specific genes in spermatogenesis, GeneMANIA revealed that Prm2 was co-expressed only with the Prss54 of the characterized testis-specific genes and was co-expressed with 10 of the 15 adjacent genes, including Pdit, Spz1, Nt5c1b, Odf1, Akap4, 1700113H08Rik, Cetn1, Spes1, 1700012A03Rik, and Spact1l (Fig. 5, top left). The Dmrtc2 gene was highlighted to be co-expressed with two testis-specific genes, namely Prss54 and Adad1, and 10 neighboring genes, namely Pdit, odf1, 1700113H08Rik, Spdya, G6pd2, Fam47c, Cetn1, Spam1, 1700012A03Rik, and Spact1l (Fig. 5, top right). Moreover, the co-expression network of the Adad1 gene (Fig. 5, top middle) showed that the gene-gene interaction between Adad1 and 2 testis-specific genes (Dmrtc2 and Syce1), and between Adad1 and 11 other genes (Tmbim7, Spz1, Nt5c1b, Odf1, Akap4, 1700113H08Rik, Spdya, Fam47c, Spesp1, Spam1, and 1700012A03Rik).
The GeneMANIA analysis revealed that the Syce1 gene is co-exprressed with the Press54 and Adad1 testis-specific genes and with other neighboring genes, namely Tmbim7, Spz1, Nt5c1b, Akap4, Spdya, G6pd2, Fam47c, Spam1, and 1700012A03Rik (Fig. 5, bottom left). Furthermore, the interconnected network of Prss54 confirmed that it was the most testis-specific gene with co-expression correlation with 3 testis-specific genes (Prm2, Syce1, and Dmrtc2) and 13 adjacent genes (Pdit, Tmbim7, Spz1, Nt5c1b, Odf1, Akap4, 1700113H08Rik, G6pd2, Cetn1, Spesp1, Spam1, 1700012A03Rik, and Spact1l) (Fig. 5, bottom right). However, the last testis-specific gene identified (Luzp4) did not form a co-expression network with the other testis-specific genes and the other 15 neighboring genes (Fig. 5, bottom middle). Thus, no gene-gene interaction was found between Luzp4 and the other genes according to the GeneMANIA database.
4 Discussion
Intrinsic, interactive, and extrinsic factors all contribute to gene expression in seminiferous tubules during the development of male germ cells (Eddy, 2002). The intrinsic genetic program, which is highly conserved, dictates which genes are utilized for germ cell proliferation and when they are expressed. The interactive process represents the relationships between germ and somatic cells in the seminiferous tubules. The interactive program is dependent on the extrinsic program, which reflects the hormonal control of somatic cells by testosterone and follicle-stimulating hormones (Eddy, 2002, Lee et al., 2013). These regulatory pathways provide a complete network of genes that regulate male reproduction.
Identification and functional characterization of germ cell-specific genes are necessary for a comprehensive knowledge of male germ cell development and fertilization. This is because the processes that take place in male germ cells are unique and do not occur in any other tissues. The testis is a specialized male gonad with complicated gene expressions for spermatogenesis and steroidogenesis (Liu et al., 2011). RT-PCR analysis was performed to determine whether the chosen candidate genes from the NCBI database are expressed in the testis of mice. In total, 20 testis-specific genes were randomly selected and examined in tissue samples from different mouse organs, including the testis.
The expressions of 20 genes from the NCBI database were examined in various mouse tissues and testis by RT-PCR screening. These genes were classified into three categories according to their expressions in the mouse tissue samples. Ubiquitously expressed genes were detected in all types of mouse tissues. This category included the Adam29, Cabs1, Cpxcr1, Fthl17a, and Sycp1 genes. Therefore, these 5 genes are not testis specific, as indicated in the GenBank database. A previous study found that the expression levels of ubiquitous genes varied between tissues (Ramskold et al., 2009), which is similar to the results of the present study. Testis-predominant genes were not detected in all mouse tissues and showed strong-intensity bands in the testis and weak-intensity bands in a few mouse tissues. The testis-predominant genes were also not expressed in the mature ovary. This category included the Cabyr, Stra8, Tex101, Odf3, Tex48, Ldhc, Odf1, Spata19, and Tmprss12 genes. Therefore, these 9 genes are not testis specific, as indicated in the GenBank database.
The testis-specific genes were exclusively expressed in the mouse testis and were not detected in the non-testicular tissues tested in this study. This category includes the Adad1, Dmrtc2, Luzp4, Prm2, Prss54, and Syce1 genes. The analysis results of the expressions of the 6 genes are consistent with the GenBank database results. Therefore, these genes have potential medical applications such as the diagnosis of reproductive diseases. In addition, we believe that the mouse testis-specific genes' in this study may be responsible for the unique properties of the male germ cells, which not only undergo meiosis to produce haploid gametes but also are morphologically highly specialized to accomplish the functions of fertilization once they are released from their producing epithelium cells. The results of the current study of testis-specific genes agree with the findings of prior researches. For example, Adad1 and Adad2 are testis-specific proteins required for mouse male fertility (Snyder et al., 2020). Dmrtc2 is a meiotic transcription factor and a crucial regulator of spermatogenesis in mouse testis (Odajima et al., 2016). Prm2 in rodents and primates is expressed only in the testis and is required for mature sperm (Arevalo et al., 2022). Prss54 is present in mouse testis and mature sperm (Shen et al., 2022). In addition, Syce1 was expressed at high levels in spermatogenic cells of the testis (Wang et al., 2022).
Sequence similarity detected by phylogenetic analysis between testis-specific genes (Adad1, Dmrtc2, Luzp4, Prm2, Prss54, and Syce) and their orthologs suggests that these proteins are conserved across mice and other eutherian species. The produced phylogenetic trees suggested that the mouse and the rat may have had a common ancestor since their testis-specific genes were most closely related to one another.
To validate the study findings for testis-specific genes, publicly available data from the GTEx portal were used (Carithers et al., 2015). Our analysis of the mRNA expression levels in different human tissues revealed that PRM2 and SYCE1 are testis predominant (Fig. 6). However, their expression levels are higher in the testis than in other tissues. By contrast, LUZP4, ADAD1, DMRTC2, and PRSS54 showed significantly higher expression levels in the testis but were not expressed in other human tissues. The findings on the LUZP4, ADAD1, DMRTC2, and PRSS54 genes, which have testis-specific expressions, in human, are consistent with those in mice (Lopes et al., 2013). Several mouse testis-specific genes, including as Luzp4, Adad1, Dmrtc2, Prm2, Prss54, and Syce1, have been linked to meiosis and/or spermatogenesis. To further understand the role these genes play in male mouse fertility, more study is needed.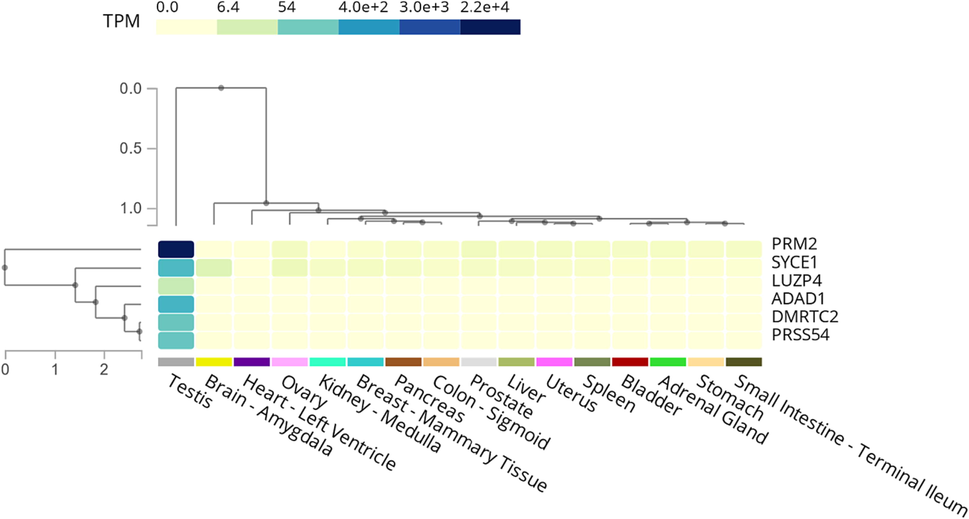
Expression heatmap of the selected genes across multiple tissues in the GTEx database. The heatmap highlights the testis-specific enrichment of LUZP4, ADAD1, DMRTC2, and PRSS54, while PRM2 and SYCE1 are shown as testis predominant.
Finally, the expression levels of each gene in each sample are ultimately responsible for the differences in band intensities across all three categories. The current investigation therefore has two limitations. First, RT-PCR was employed to determine the band intensity of each gene in each cell. However, qRT-PCR will be necessary to validate the RT-PCR results. Second, the protein concentrations of putative testis-specific genes in meiosis are also required.
5 Conclusion
In this study, genes randomly selected from the NCBI database were classified into 3 categories by RT-PCR screening of various mouse tissue samples. These categories were ubiquitously expressed, testis-predominant, and testis-specific genes. The 6 testis-specific genes could be considered promising for the diagnosis of reproductive diseases and may be used as early markers of mouse meiosis during spermatogenesis. These genes have testis-enriched expressions in mice and are conserved across most eutherian species.
Institutional review board statement
The animal study protocol was approved by the ethics committee of King Abdullah International Medical Research Center (IRB/1201/22, study No. SP22R/076/04, approved 27 June 2022).
Informed consent statement
Not applicable.
Data availability statement
Data available upon request.
Funding
This research work was supported by the Researchers Supporting Project number (RSP2023R191) at King Saud University, Riyadh, Saudi Arabia.
CRediT authorship contribution statement
Turki M. Alrubie: Methodology, Investigation, Formal analysis, Validation, Software, Writing – original draft. Jilani P. Shaik: Investigation. Abdullah M. Alamri: Formal analysis. Bader O. Almutairi: Investigation, Writing – review & editing. Mohanad A. Ibrahim: Software. Mohammad Alanazi: Resources. Mikhlid H. Almutairi: Methodology, Validation, Software, Writing – review & editing, Project administration, Supervision, Writing – original draft, Funding acquisition.
Acknowledgments
The authors extend their appreciation to the Researchers Supporting Project number (RSP2023R191), King Saud University, Riyadh, Saudi Arabia.
Declaration of Competing Interest
The authors declare that they have no known competing financial interests or personal relationships that could have appeared to influence the work reported in this paper.
References
- Cancer-Testis Gene Biomarkers Discovered in Colon Cancer Patients. Genes (Basel). 2022;13
- [Google Scholar]
- The Expression Patterns of Human Cancer-Testis Genes Are Induced through Epigenetic Drugs in Colon Cancer Cells. Pharmaceuticals (Basel). 2022;15
- [Google Scholar]
- A Novel Approach to High-Quality Postmortem Tissue Procurement: The GTEx Project. Biopreserv Biobank. 2015;13:311-319.
- [Google Scholar]
- Combined Use of Whole Exome Sequencing and CRISPR/Cas9 to Study the Etiology of Non-Obstructive Azoospermia: Demonstration of the Dispensable Role of the Testis-Specific Genes C1orf185 and CCT6B. Cells. 2021;11
- [Google Scholar]
- Spermatogenesis in mammals: proteomic insights. Syst. Biol. Reprod. Med.. 2012;58:179-190.
- [Google Scholar]
- Characterization and comparative genomic analysis of intronless Adams with testicular gene expression. Genomics. 2004;83:636-646.
- [Google Scholar]
- The evolutionarily conserved genes: Tex37, Ccdc73, Prss55 and Nxt2 are dispensable for fertility in mice. Sci. Rep.. 2018;8:4975.
- [Google Scholar]
- Evolutionarily conserved and testis-specific gene, 4930524B15Rik, is not essential for mouse spermatogenesis and fertility. Mol. Biol. Rep.. 2020;47:5207-5213.
- [Google Scholar]
- Expression and function of the testis-predominant protein LYAR in mice. Mol. Cells. 2013;35:54-60.
- [Google Scholar]
- Comparative and functional analysis of testis-specific genes. Biol. Pharm. Bull.. 2011;34:28-35.
- [Google Scholar]
- Human spermatogenic failure purges deleterious mutation load from the autosomes and both sex chromosomes, including the gene DMRT1. PLoS Genet.. 2013;9:e1003349.
- [Google Scholar]
- Proteomic Landscape of Tissue-Specific Cyclin E Functions in Vivo. PLoS Genet.. 2016;12:e1006429.
- [Google Scholar]
- Androgen receptor roles in spermatogenesis and infertility. Best Pract. Res. Clin. Endocrinol. Metab.. 2015;29:595-605.
- [Google Scholar]
- Cell Type-Specific Expression of Testis Elevated Genes Based on Transcriptomics and Antibody-Based Proteomics. J. Proteome Res.. 2019;18:4215-4230.
- [Google Scholar]
- An abundance of ubiquitously expressed genes revealed by tissue transcriptome sequence data. PLoS Comput. Biol.. 2009;5:e1000598.
- [Google Scholar]
- A multitude of genes expressed solely in meiotic or postmeiotic spermatogenic cells offers a myriad of contraceptive targets. PNAS. 2003;100:12201-12206.
- [Google Scholar]
- Testis-specific serine protease PRSS54 regulates acrosomal granule localization and sperm head morphogenesis in micedagger. Biol. Reprod.. 2022;107:1139-1154.
- [Google Scholar]
- ADAD1 and ADAD2, testis-specific adenosine deaminase domain-containing proteins, are required for male fertility. Sci. Rep.. 2020;10:11536.
- [Google Scholar]
- Histology. Treasure Island (FL): Spermatogenesis. StatPearls; 2022.
- MEGA11: Molecular Evolutionary Genetics Analysis Version 11. Mol. Biol. Evol.. 2021;38:3022-3027.
- [Google Scholar]
- Characteristics of 292 testis-specific genes in human. Biol. Pharm. Bull.. 2007;30:865-872.
- [Google Scholar]
- Syce1 and Syce3 regulate testosterone and dihydrotestosterone synthesis via steroidogenic pathways in mouse Sertoli and Leydig cells. J. Steroid Biochem. Mol. Biol.. 2022;223:106135
- [Google Scholar]
- The GeneMANIA prediction server: biological network integration for gene prioritization and predicting gene function. Nucleic Acids Res.. 2010;38:W214-W220.
- [Google Scholar]


