

Translate this page into:
Hydrocarbon generation potential of Chichali Formation, Kohat Basin, Pakistan: A case study
⁎Corresponding authors. mjavedansari@gmail.com (Mohammad Javed Ansari)
-
Received: ,
Accepted: ,
This article was originally published by Elsevier and was migrated to Scientific Scholar after the change of Publisher.
Peer review under responsibility of King Saud University.
Abstract
The Chichali Formation encountered in Chanda 01 well, located in the Shakardara Kohat, Khyber Pakhtunkhwa Province of Pakistan has been studied in detail as a source for hydrocarbon. Nine drill cuttings of the formation were subjected to geochemical analyses and organic petrography. Various screening techniques including TOC analysis by using Leco-CS analyzer, Rock Eval pyrolysis and organic petrography were used to determine the quality, quantity, maturity and depositional environment of the organic matter. The total organic carbon (TOC) of samples from Chichali Formation ranging from 0.47 to 2.76 wt% indicate fair to very good source rock. Pyrolysis parameters resulted in S1values ranging from 0.21 to 0.83 mg/g of rock, S2 0.44 to 0.61 mg/g rock, PI 0.32–0.51 and Tmax 442–448 °C. The Tmax and vitrinite reflectance data (0.72–0.84 Ro %) indicate that Chichali Formation is effective source rock and is in the process of generating hydrocarbons and falls within oil window. Geochemical parameters Hydrogen index (HI), Oxygen index (OI), Tmax along with organic petrography analyses (maceral) are used for kerogen type evaluation. The calculated HI ranges between 31 and 54 mg HC/g TOC and OI 30–96 mg O2/g TOC. Using modified Van Krevlen diagram between HI vs OI of Rock Eval pyrolysis and maceral analyses, kerogen type II/III and transition between anoxic to oxic depositional environments is interpreted for the studied Chichali Formation.
Keywords
Source rock
Chichali formation
Shakardara Kohat
Pakistan

1 Introduction
Petroleum geochemistry is one of the fundamental methods for understanding source rock characteristics and evaluating hydrocarbon productive zones. The source rock refers to an organic-rich sedimentary rock which can produce hydrocarbons due to thermal maturation (Rezaee, 2002). It is one of the main elements of a petroleum system. Therefore, it is necessary to investigate the source rock and its characteristics for identifying a region of hydrocarbon. Thermal maturity of a source rock is the primary factor that determines whether the source rock is in the oil, gas, or condensate window (Lecompte et al., 2010).
The organic matter type is an important factor, while evaluating a source rock for hydrocarbon potential. Organic matter of type I kerogen is marine in origin and responsible to generate oil, whilst terrestrial sourced, Type III kerogen has potential to predominantly generate petroleum gas upon geothermal transformation. The thermal maturity is the state of hydrocarbon generation. The generation of hydrocarbons by organic matters depends on burial depth of the sediments, temperature and time. For paleotemperature analysis various parameters are used (Tissot and Welte, 1984). Among these parameters the vitrinite reflectance and Tmax are widely used in oil exploration industry. In order to evaluate source rock various laboratory methods and/or burial history are used. Among laboratory methods, Rock-Eval pyrolysis method has been extensively used worldwide for oil and gas exploration in sedimentary basins (Behar et al., 2001). This method is also used for determining the thermal maturation of kerogen. The Rock-Eval parameters include genetic potential (GP), oxygen index (OI), hydrogen index (HI), production index (PI), S1, S2, & S3 peaks, total organic carbon (TOC), and vitrinite reflectance and maceral data used in this study which provide useful information on quantity, quality and thermal maturity of organic matters.
The present study is aimed to study the geochemically the Cretaceous Chichali Formation in Chanda-01 well, to understand the hydrocarbon generation potential in the Kohat Basin.
2 Study area
The studied well (Chanda-01) is located in Kohat Basin, with latitude and longitude 33° 13′ 40.29″ and 71° 30′ 50.93″ respectively. The Kohat Basin of northern Pakistan is a part of Himalayan Foreland Belt and is the most complex tectonic are (Gee, 1945; Ahmad, 2003) and Geologically, the Kohat Basin is bounded by the Main Boundary Thrust from North, which uplifted Mesozoic-Paleocene sediments over the Tertiary sediments, and by the Surghar Range from South as shown in Fig. 1. The Kohat Basin merges to the Bannu Basin in southwest which is mostly occupied by Siwalik sediments (Kazmi and Rana, 1982). The eastern limit of this basin is marked geographically by Indus River and to the west it is limited by the NNE-SSW oriented Kurram fault. Its western side is comprised of deformed Mesozoic sedimentary rocks, ultramafic igneous rocks (ophiolites) and accreted volcanic arcs (Kazmi and Jan, 1997; Treloar and Izatt, 1993). The Himalayan Mountain Range is an active zone representing continent–continent collision stretching from Burma in westward through Nepal and northern India into Pakistan (Ahmad et al., 2013; Ahsan and Chaudhry, 2008; Khan et al., 2013). The Himalayan Mountain Belt was formed around 45 Ma by crustal thickening between Indian and Asian plate collision (Gansser, 1964; LeFort, 1975). The trend of this belt is changes in India from northwest-southeast to the northeast-southwest in Pakistan (1997;; Ghazanfar, 1993).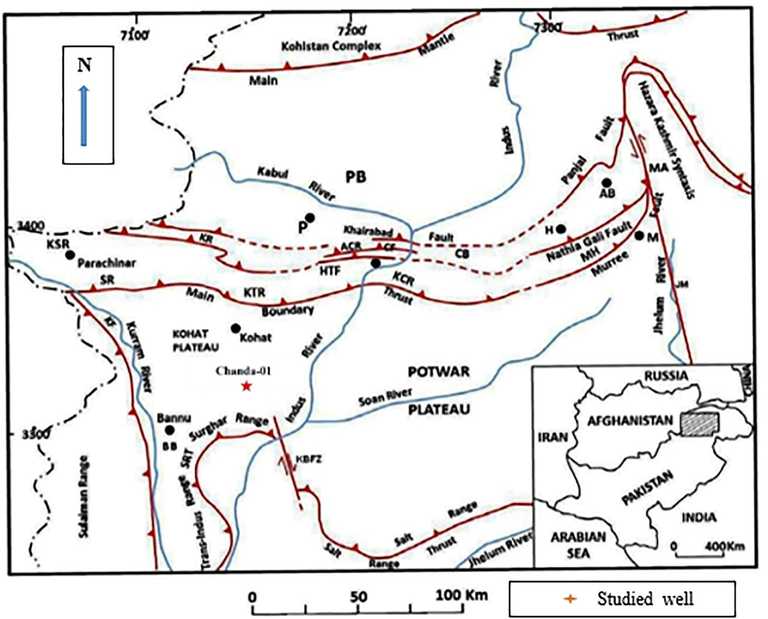
Tectonic map of northern Pakistan showing major structural features (After Kazmi and Rana, 1982).
The oldest rocks exposed in Kohat Basin are Early Eocene (Meissner et al., 1974). A thick Mesozoic-Paleozoic successions are exposed in south of the Kohat Basin in Surghar Range. These deposits are therefore inferred to underlying Eocene succession in the intervening Kohat (Fatmi, 1973; Khan et al., 1986; Meissner et al., 1974). As the rocks exposed in Kohat Basin are ranging in age from Econe to Recent but the Chanda deep-01 well was drilled up to Triassic rocks (Malghani, 2013), so this indicates that in subsurface older rocks are also present in this basin. The thrust system in Kohat Basin emplaces the Eocene Evaporites sequence over Miocene Molasse sediments. In central Kohat Basin, these evaporites (Bahadar Khel Salt, Jatta Gypsum) are exposed in narrow elongated belt where they termed as Kohat Salt Zone (Khan et al., 1986). The formations encountered in the studied well are ranging from Jurassic to Pliocene as shown in Table 1.
Age
Formation
Lithology
DEPTH (m)
Pliocene
Nagri
Sandstone
0
Miocene
Late
Chinji
Sandstone
438
Middle
Kamlial
Sandstone
2042
Early
Murree
Sandstone & shale
2681
Eocene
Middle
Kohat
Limestone
3965
Early
Kuldana
Sandstone
3971
Jatta gypsum
Gypsum/limestone
4098
Paleocene
Late
Patala
Shale
4134
Lochkart
Limestone
4268
Early
Hangu
Sandstone & shale
4475
Cretaceous
Early
Lumshiwal
Sandstone & shale
4525
Chichali
Shale/sandstone
4543
Jurassic
Late
Middle
Samana Suk
Limestone
4577
Early
Shinawri
Sandstone & limestone
4662
Datta
Sandstone and shale
4751
3 Materials and methodology
The total nine drill cuttings from Chichali Formation in Chanda-01 were studied for source rock potential using various screening techniques including TOC measurement, Rock Eval pyrolysis and organic petrography. The samples were prepared and analyzed in Hydrocarbon Development Institute of Pakistan (HDIP) labs for geochemical and vitrinite reflectance (Ro %) measurements. The TOC, Rock Eval pyrolysis and organic petrography were carried out to assess the organic matter types, quantity and thermal maturity.
The total organic carbon (TOC) was measured by Leco CS-300 analyzer. Before performing TOC analysis, the rock samples were washed with water, dried, crushed and then decarbonized by acid treatment to remove the inorganic carbon. The 100 mg crushed samples were heated in a furnace of CS- analyzer due to which CO2 liberated as a result combustion of organic carbon at 950 °C. The amount of CO2 produced during this process was detected which is proportional to the organic carbon in a sample (Espitalie et al., 1977). This process resulted the TOC values for samples ranges from 0.47 wt% to 2.76 wt%.
The pyrolysis was conducted by using Rock-Eval-6 unit. The Rock Eval pyrolysis resulted in various parameters including S1, S2, S3, hydrogen index (HI), oxygen index (OI) and temperature of maximum pyrolysis yield (Tmax). The HI & OI have been used for kerogen type analysis, S1 & S2 for genetic potential and Tmax and production index data for thermal maturity of the formation. The decarbonized powdered samples of 100 mg were heated in Leco furnace and kept initially isothermally at 300 °C for three minutes during which the already generated volatized hydrocarbon were evolved and detected by flame ionization detector (FID) in the assembly. Further the temperature was then increased up to 850 °C which resulted the cracking of kerogen released hydrocarbons and measured as S2 peak. The temperature parameter (Tmax) at which maximum S2 generated was also obtained. The CO2 released from thermal cracking of kerogen during temperature range 300 °C–390 °C was trapped and detected on a TCD as S3 peak in the furnace.
Three selected samples of the formation were studied using the spectrometer system MCS CCD Z1M Zeiss microscope based on the high organic contents for maceral types and vitrinite reflectance (Ro %) measurements. The appropriate amount of crushed sample of about 0.8–0.2 mm was mounted with araldite (epoxy resin) and dried to allow it to harden. Further the sample was grinded using oil on successively finer carborundum paper and then polished with finer alumina powders. The samples were examined for maceral types and amount of reflectance by the vitrinite maceral in white and blue light using oil immersion objectives and a filter under reflected light using Zeiss Z1M Microscope.
4 Results
4.1 Total organic carbon (TOC)
The source rock generation potential is evaluated by geochemical screening techniques such as total organic carbon and pyrolysis yields S1 & S2. The minimum acceptable TOC value for clastic rocks indication source rock is 0.5 wt% (Tissot and Welte, 1984) but most of the geochemists consider rocks as organically lean containing less than 1 wt% TOC. In the current research total nine (9) shale samples of 18 m thick Chichali Formation at depth 4525 m in the studied well were subjected for TOC measurements. The TOC results are variable with high organic carbon upto 2.76 wt% and low value 0.47 wt% of only one sample among them as shown in Fig. 2.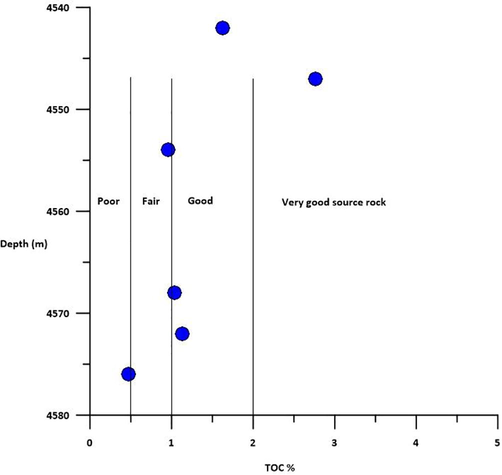
TOC wt. % of the Chichali Formation.
4.2 Types of kerogen & thermal maturity
In the current research the types of kerogen contained by the studied samples were assessed by using standards cross plots between Rock Eval parameters such as hydrogen index (HI) vs oxygen index (OI) and HI vs Tmax (Espitalie, 1979) and organic petrography study. The hydrogen indices (HI) of the analyzed samples ranged between 31 and 54 and oxygen index (OI) from 44 to 96.
In the current study Rock Eval parameters Tmax & production index, vitrinite reflectance were used to evaluate thermal maturity level of the studied samples.
4.3 Depositional setting (Environment of Kerogen)
Organic matter is broadly classified into two types based on its origin called as sapropelic and Humic. The sapropelic is the product of planktonic algae and herbal components deposited in sub aquatic (marine & lacustrine) under oxygen restricted conditions (Hunt, 1979). The Humic refers to peat formation primarily from land plants deposited in swamps in the presence of different levels of oxygen. Marine organic matter is rich in amorphous material containing hydrogen rich organic components, while terrestrial organic matter is rich in woody materials containing oxygen rich organic content. As a result, the oxygen index (OI) value will be high in case of Humic organic matter while will be low in sapropelic matter. To evaluate the depositional environment of the Chichali Formation sediments Van Krevlen plot of hydrogen index vs. oxygen index (HI, OI) was used and it shows transitional between anoxic to anoxic as shown in Fig. 7.
4.4 Organic petrography
Two samples were subjected for maceral analysis of the depth intervals 4545–4558 m and 4572–4578 m of the Chichali shale. Bituminite is the major maceral in the first interval, solid Bitumen is the second and vitrinite is the third main maceral present in the form of Vitrodetrinite and Collotelinite. Intertinite is present in small amount. In the depth interval 4572–4578 m Vitrinite is the main maceral in the samples which is mainly viteroderinite. Liptinite is the second maceral type and composed of alginite, resinite, liptodetrinite and bituminite. Few particles of solids bitumen are also observed, Inertinite is also present in the form of inertodetrinite. Three samples were subjected to vitrinite reflectance measurements to evaluate the thermal maturity status of the formation. The values of these samples ranging from 0.72 to 0.84% Ro showing that the samples are mature for liquid hydrocarbon generation.
5 Discussion
The analyzed samples of the studied formation had TOC values ranged from 0.47 wt% to 2.67 wt% as shown in Table 2. According to Bacon (2000) classification of source rock based on TOC, the studied formation falls in class of fair to very good source rock. Most of the analyzed samples fall in good category i.e. having TOC values > 1 wt% except the deeper sample (0.47 wt%). The TOC alone seldom evaluates a source rock sufficiently as with increasing temperature the organic carbon is decreases (Selley and Sonnenberg, 2014; Khan, 2016). So, the resulted lower values of TOC representing comparatively high maturity level (Tmax and Ro %) comparing with others. The Espitalié et al. (1986) has also found that TOC alone is not sufficient to evaluate the sediments for source rock potentiality, where it contains inertinite dominantly. The same studied formation is a potential source rock in other areas too i.e. Kalachitta Range (0.5 wt% to 1.64 wt%), Surghar Range (1.2 wt%), According to Bacon (2000) classification of source rock based on TOC, the studied formation is classified as fair to very good source rock, while most of the samples fall in good to very good categories i.e. having TOC values > 1 wt% except the deeper sample of 0.47 wt%. The TOC alone seldom evaluates a source rock sufficiently as with increasing temperature the organic carbon is decreases (Selley and Sonnenberg, 2014; Khan, 2016). In our results the samples of lowest TOC values representing comparatively high maturity level (Tmax and Ro %) comparing with others, so resulted low TOC values. The Espitalié et al. (1986) also found that TOC alone is not sufficient to evaluate the source rock potentiality, where the sediments is mainly comprising inertinite. So therefore, the Rock-Eval pyrolysis data and organic petrography study is necessary to be interpreted to evaluate the source sediments more precisely. The studied Chichali Formation is a potential source rock in other areas too i.e. Kalachitta Range (0.5 wt% to 1.64 wt%), Surghar Range (1.2 wt%), Mela-05 wells, fair to good source rock, Chonai-1 and Pezu-1 wells show moderate to good source potential (Zeb et al., 2020; Shahzad, 2007; Iqbal et al., 2012; Quad Consulting Limited, 1996). Overall, the Chichali Formation of Cretaceous age act as a good source rock in the studied basin except some outcrop samples in Surghar Range of the basin extremity yielded very poor organic carbon, which may be due to weathering effect on organic matter (Zeb et al., 2020).
S. No
Samples Interval
TOC (wt %)
S1 (mg/g rock)
S2 (mg/g rock)
S3 (mg/g rock)
GP (mg/g rock)
HI (mg/g TOC)
OI (mg/g TOC)
P.I (S1/S1 + S2)
Tmax (°C)
Ro (%)
1
4541–42
1.63
0.72
2
4545–47
2.76
0.76
3
4548–54
0.96
4
4550–52
0.96
0.83
0.61
1.92
1.44
31
96
0.58
442
5
4560–62
0.65
0.28
0.58
0.32
0.86
54
30
0.32
448
6
4568–70
1.04
7
4570–72
1.04
0.21
0.44
0.44
0.65
44
44
0.32
442
8
4572–74
1.13
9
4576–78
0.47
0.84
The organic matter types evaluation is important as the sediments containing high inertinite (TOC) will not generate hydrocarbon even upon thermal maturation. The evaluation has been carried out by different parameters of Rock Eval pyrolysis. The organic matter having HI value < 150 mg H/ g TOC contains gas potential, 150–300 mg/g TOC contains oil & gas, while > 300 mg/g TOC are considered oil prone (Peters, 1986). The low hydrogen contents (HI) in the sediments is either due to depositional setting or thermal transformation. Based on HI and OI results and their comparison with published source rock standards (Peters, 1986; Makky et al., 2014; Espitalie et al., 1977) the Chichali Formation in the studied well contained mixed II /III kerogen as shown in Fig. 3. Gakkhar et al. (2012) has also been proposed algal origin for the organic contents in the formation. According to Zeb at al (2020) the Chichali Formation contains mainly type III kerogen in Mela-05 well in the same basin and fall at the boundary of gas-oil zone.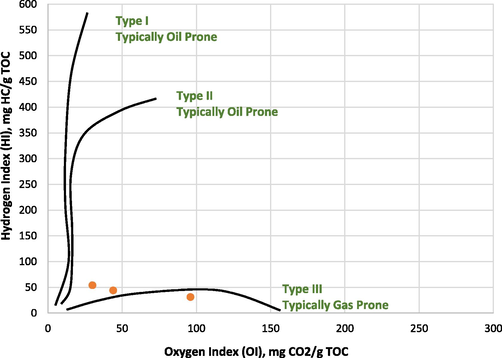
Quality of Organic matter (Kerogen) in Chichali Formation.
In hydrocarbon evaluation the determination of maximum temperature to which source sediments are subjected is prime importance. The thermal maturity is determined by pyrolysis Tmax, PI, pollens and spore coloration and clay minerology and vitrinite reflectance (Selley, 1985). The Ro% values ranges from 0.5 to 1.5 indicate oil window, while 1.6 –2.6 values indicate the gas window and 2.0–3.0 suggest the dry gas hydrocarbon potential depending on types of kerogen and presence of pyrite mineral and asphalt contents (Selley, 1985; Hunt, 1995). Vitrinite with values higher than around 3.0 indicate over maturation and a zone devoid of hydrocarbons (Selley, 1985; Hunt, 1995). Tmax is the maximum temperature at which maximum hydrocarbon generates due to thermal cracking of kerogen. It depends on organic matter types and maturation level (Tissot and Welte, 1984). The value of Tmax below 435 °C is considered as thermally immature & 435 °C to 470 °C is the range mature stage for liquid hydrocarbon production. Three samples were subjected to vitrinite reflectance (Ro%) ranging from 0.72 to 0.84% without any anomalies value. Based on Ro% and Tmax vs HI plot and PI data the Chichali Formation is a mature source rock for the liquid hydrocarbon generation in the studied well as shown in Figs. 4–6 (Ibrahimbas and Reidiger, 2004; Espitalié et al., 1986; Bacon et al., 2000).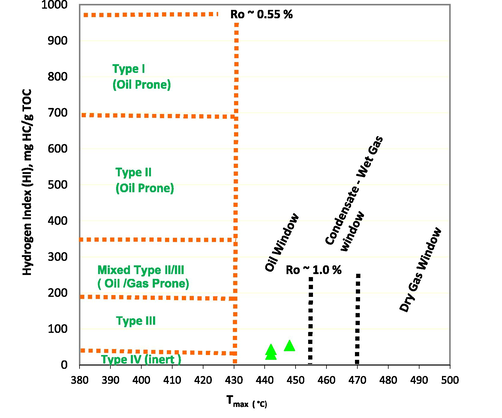
Maturity and types of Kerogen of Chichali Formation.
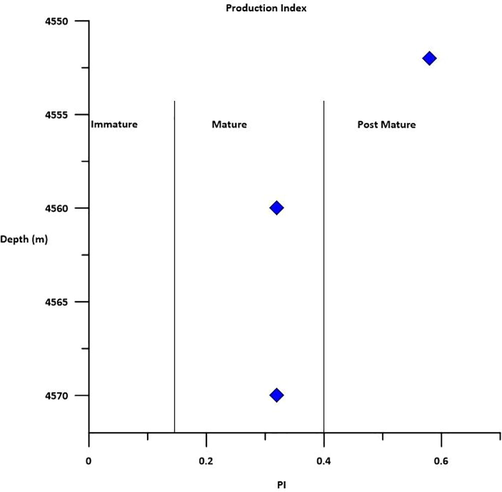
Production index (PI) results of the Chichali Formation.
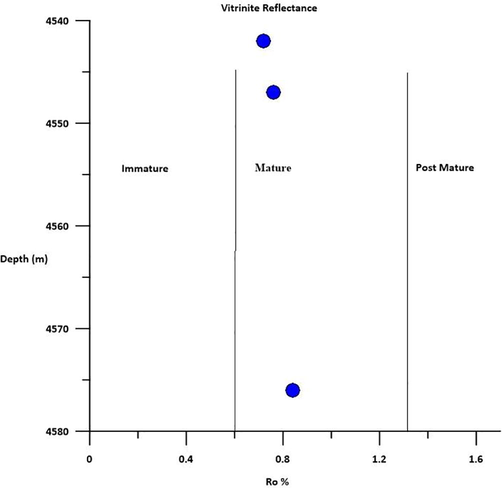
Vitrinite reflectance (Ro %) versus depth of the Chichali Formation.
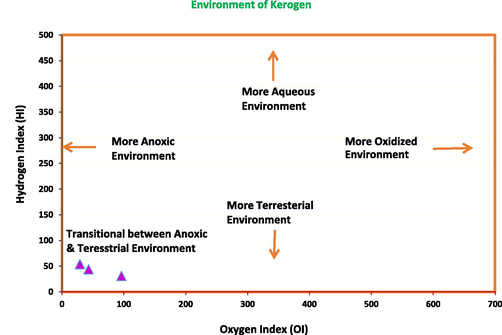
Depositional environment of organic matter in Chichali Formation.
6 Conclusions
Based on TOC the studied Chichali Formation has been classified as fair to good source rock. The Chichali Formation is mature for oil and immature for gas generation evaluated by using Tmax and vitrinite reflectance (Ro %) results and it falls within oil window. The Chichali Formation consists of mixed type II/III kerogen based on hydrogen index (HI) versus oxygen index (OI) cross plot and maceral data. Transitional environment between anoxic to oxic has been interpreted for organic matter in Chichali Formation.
Acknowledgments
Directorate General of Petroleum Concession Pakistan (DGPC) for providing ditch cuttings and Higher Education Commission Pakistan (HEC) for financial support are highly acknowledged. This research was supported by Researchers Supporting Project number (RSP-2020/249), King Saud University, Riyadh, Saudi Arabia.
Declaration of Competing Interest
The authors declare that they have no known competing financial interests or personal relationships that could have appeared to influence the work reported in this paper.
References
- Structural observations along the Main Boundary Thrust, Margalla Hills, North Pakistan. In: International conference on conventional hydrocarbon potential of Pakistan. 2013. p. :10.
- [Google Scholar]
- Geology of Hettangian to Middle Eocene Rocks of Hazara and Kashmir Basins, Northwest Lesser Himalayas. Pakistan. Geol. Bull. Punjab Univ.. 2008;43:131-152.
- [Google Scholar]
- A comparative study of structural styles in the Kohat Basin, NW Himalayas, NWFP. Pakistan Ph.D. thesis, NCE Geology, University of Peshawar Pakistan.. 2003;120p
- [Google Scholar]
- The Petroleum Potential of Onshore Tasmania: a review. Geol. Survey Bullet.. 2000;71:1-93.
- [Google Scholar]
- Rock-Eval 6 Technology: Performances and Developments, Oil & Gas Science and Technology Rev. IFP. 2001;56(2):111-134.
- [Google Scholar]
- Rock-Eval pyrolysis and its applications. Part III. Revue de l’Institut Français du Petrole. 1986;41(1):73-89.
- [Google Scholar]
- Methode rapid de caracterisation des rocks meres, de leur potential petrolier et leur degree devolution. Rev. Inst. Fr. Petrol.. 1977;32:23-42.
- [Google Scholar]
- Lithostratigraphic units of the Kohat-Potwar Province Indus Basin, Pakistan. Mem. Geol. Surv. Pak.. 1973;10:1-180.
- [Google Scholar]
- Gakkhar, R.A., Bechtel, A., and Gratzer, R., 2012. Source-rock Potential and Origin of Hydrocarbons in the Cretaceous and Jurassic Sediments of the Punjab Platform (Indus Basin) Pakistan
- Gansser, A., 1964. Geology of the Himalayas. Inter-science Publishers (J. Wiley and Sons), London, P 289.
- Petrotectonic elements and tectonic frame work of Northwest Himalaya. University of the Punjab; 1993. p. :1-380. (Ph.D. thesis)
- The age of the saline series of the Punjab and Kohat: India Natl. Acad. Sci., Proc., Sec, B.. 1945;v. 14, pt. 6:269-310.
- [Google Scholar]
- Petroleum geochemistry and geology. San Francisco: WH Freeman; 1979.
- Petroleum Potential of Kalachitta-Margala Hills Range. Pakistan: and Adjoining Peshawar-Hazara Basin; 2012.
- Hydrocarbon source rock potential as determined by Rock-Eval 6/TOC Pyrolysis. Northeast British Columbia and Northwest Alberta, Resource Development and Geosciences Branch: British Columbia Ministry of Energy and Mines; 2004. p. :718.
- Geology and tectonics of Pakistan 1–554.Karachi. Graphic Publisher; 1997.
- Kazmi, A. H., Rana, R. A., 1982. Tectonic map of Pakistan, at a scale of 1:200000.Geological Survey of Pakistan, Quetta.
- Hydrocarbon source rock potential evaluation of the Early Jurassic Datta Formation Salt Range, Pakistan; MS Thesis. In: National Centre of Excellence in Geology. Pakistan: University of Peshawar; 2016.
- [Google Scholar]
- Geochemical characterization and petrogenesis of Niat-Jal amphibolites, southeast Kohistan, Pakistan. Iran. J. Sci. Tech.. 2013;37:147-159.
- [Google Scholar]
- Khan, M.A., R. Ahmed, H.A. Raza and A. Kemal., 1986. Geology of petroleum in Kohat-Potwar depression, Pakistan. Bull.Amer.Assoc.Petrol. Geol., v. 70, no.4. P.369-414.
- Lecompte, B., Hursan, G., and Hughes, B., 2010. Quantifying Source Rock Maturity from Logs: How to Get More Than TOC from Delta Log R, SPE Annual Technical Conference and Exhibition held in Florence, Italy, 19–22 September 2010.
- Himalaya: the collided range; present knowledge of the continental arc. Am. J. Sci.. 1975;275 A:1-44.
- [Google Scholar]
- Source rock evaluation of some upper and lower Cretaceous sequences, West Beni Suef Concession, Western Desert, Egypt. Egypt. J. Pet.. 2014;23(1):135-149.
- [Google Scholar]
- Source rock evaluation and reservoir characterization of Chanda oil and gas field, Upper Indus Basin, Pakistan (MS thesis): Bahria University. Pakistan: Islamabad; 2013.
- Stratigraphy of the Kohat Quadrangle, Pakistan. US. Geol. Surv. Prof. Paper. 1974;716-D:1-30.
- [Google Scholar]
- Guidelines for evaluating petroleum source rock using programmed pyrolysis. AAPG Bull. 1986;70:318e329
- [Google Scholar]
- Geological and Geophysical Evaluation of Block-35 and Adjacent Areas. Northern Pakistan Pakistan Petrol. Ltd. 1996:1-47.
- [Google Scholar]
- Rezaee, R., 2002. Petroleum Geology, Alavi Publication, 479p.
- Selley, R. C and Sonnenberg, S. A., 2014. Elements of petroleum geology; 3rd edn, Academic Press, San Diego, pp. 10–35, 342–382
- Elements of Petroleum Geology, 449 pp. Freeman and Company: New York, W.H; 1985.
- Shahzad, A., 2007. Identification of potential hydrocarbon source rocks using biological markers in Kohat Basin North Pakistan, M.Phil. thesis, NCE Geology, University of Peshawar Pakistan.
- Petroleum Formation and Occurrence (2nd Ed.). New York: Springer Verlag; 1984.
- Treloar, P. J., and C.N. Izatt., 1993. Tectonics of the Himalayan collision between the Indian Plate and the Afghan Block: A synthesis. In: Treloar, P.J., and Searle, M.P. (Eds.) Himalayan Tectonics, Geol. Soci. Lond, 74: 69-87.
- Integrated geochemical study of Chichali Formation from Kohat sub–basin, Khyber Pakhtunkhwa, Pakistan. J. Petrol. Explor. Prod. Technol.. 2020;10:2737-2752.
- [Google Scholar]


