

Translate this page into:
Human health risk assessment for exposure to heavy metals in finfish and shellfish from a tropical estuary
⁎Corresponding authors at: Department of Fisheries and Marine Science, Noakhali Science and Technology University, Noakhali 3814, Bangladesh. mbhnstu@gmail.com (Mohammad Belal Hossain), a.habib@umt.edu.my (Ahasan Habib)
-
Received: ,
Accepted: ,
This article was originally published by Elsevier and was migrated to Scientific Scholar after the change of Publisher.
Abstract
This investigation measured the extent of heavy metal concentrations (Cr, Pb, Fe, Zn and Ni) in nine finfish and shellfish species from a tropical estuary to determine the degree of pollution and evaluate the human health risk from the exposure to heavy metals through consumption of fish. The hierarchy of mean concentrations (mg/kg) of the heavy metals were: Zn (398.47) > Fe (83.015) > Cr (0.906) > Ni (0.233) > Pb (0.128). The metal concentrations in the edible tissues were ranked in the following sequence: A. bato > C. cirrhosus > A. grammepomus > M. dobsoni > P. paradiseus > O. pama > M. rosenbergii > N. smithi > S. phasa. The results demonstrated that the concentration of Cr and Zn was considerably higher than the guideline values of FAO. Estimated daily intake (EDI), hazard quotient (HQ), hazard index (HI), and cancer risk (CR) values were within the acceptable threshold for both adults and children. However, the EDIs of local consumers in the research area for both adults and children were lower than the recommended daily amount (RDA), following the order of Zn > Fe > Cr > Ni > Pb. The HQs of the elements followed the order of Zn > Cr > Fe > Pb > Ni. The investigated HI was not exceeding the recommended limit.
Keywords
Bioaccumulation
Metals
Cancer risk
Coastal River
Health hazard

1 Introduction
Heavy metals (HMs) in the aquatic ecosystem are one of the most important concerns globally because of their potentially harmful effects and bioaccumulation in aquatic ecosystems (Hossain et al., 2022; Kahal et al., 2020). Thus, it can damage aquatic species diversity and ecosystems (Ayanda et al., 2019; Qian et al., 2020). The concern is becoming increasingly severe worldwide, particularly in developing countries such as Bangladesh (Hossain et al., 2019). Pollution by HMs in natural water bodies adversely affects aquatic life and carries many environmental risks and concerns (Alahabadi and Malvandi, 2018; Ullah et al., 2019). Furthermore, the availability of HMs in fish weakens the consumer's health and interrupts the activities of beneficial compounds of the human body (Mahboob et al., 2020). Therefore, the increasing degree of pollution in the aquatic ecosystems is a threat to both fish and human health (Ustaoğlu and Islam, 2020; Yang et al., 2020).
HMs can occur through natural and anthropogenic activities in the estuarine environment (Liu et al., 2020; Siddiqui and Pandey, 2019). Anthropogenic activities include wastewater discharge, industrial wastewater, agricultural and coastal land runoff, while physical and chemical weathering of rocks, erosion and atmospheric deposition are considered as natural activities (Kang et al., 2019; Qu et al., 2018). In addition, any changes in environmental conditions such as pH, oxidation–reduction potential (Eh), salinity, and organic matter, then heavy metals can be dissolved into water and fixed into sediments which create secondary contamination (Islam et al., 2015; Lee et al., 2017; Nour et al., 2018). Sea temperature also affects the biological production rate, hence, the impact on fish abundance, distribution and migration pattern (Habib, 2010; Islam et al., 2020). Some industrial sources such as petroleum combustion, nuclear power stations, high voltage lines, coal burning in power plants, metal processing in refineries, plastics, textiles, microelectronics, wood preservation, and paper processing plants are also responsible for HMs discharges (Akindele et al., 2020).
Fish and shellfish are a significant part of the human diet, particularly in coastal areas (Ahmed et al., 2019a; Ali et al., 2020; Hossain et al., 2019) and on smaller islands, providing all the essential elements necessary for life processes in a balanced way (El-Sorogy et al., 2018). Furthermore, shellfish, particularly shrimps, is also the main exportable item in countries such as Bangladesh and is therefore closely linked to the country's economy (Hossain et al., 2019; Islam et al., 2016). Therefore, it is important to investigate the heavy metal levels in these organisms in order to assess whether the concentration is within the permissible levels and the potential to pose any health risks to consumers (Ali et al., 2019; Lee et al., 2019). Subsequently, fish have often been considered the most suitable organisms among aquatic ecosystem bioindicators because they occupy a high trophic level and are an essential food source for human population (Ahmed et al., 2019a Zhu et al., 2020). Therefore, metal contents in fish tissues and organs indicate the levels of metals in water and their accumulation in food chains (Ali et al., 2019; Liu et al., 2020).
Karnaphuli River in Bangladesh is the largest industrial River in Chittagong (the second most populous city in Bangladesh with nearly four million people) and maritime port area. The Karnaphuli River estuary plays an important role in breeding, feeding, and nursery ground for various aquatic species alongside the Bay of Bengal. As the estuary is located in the catchment area of a heavily industrially developed area, Chattagram port city, it has been polluted receiving discharges from multiple point and non-point sources e.g., solid waste from household and commercial activities, effluents from textile and cement industries, ship recycling, oil refineries, tanneries, spinning mills, paint manufacturing and dyeing plants, paper and rayon mills, cotton mills, ships, steel and engineering factories, fertilizer and other chemical industries (Ali et al., 2016). These solid and liquid wastes contain almost all of the hazardous metals and metalloids, including arsenic (As), chromium (Cr), cadmium (Cd) and lead (Pb) (Ahmed et al., 2019a).
Several studies have attempted to assess the status of heavy metal contamination from Bangladesh's River and estuarine environment (Ahmed et al., 2019b; Ali et al., 2018; Bhuyan et al., 2017; Hossain et al., 2019; Islam et al., 2017). A few studies have been conducted on the Karnaphuli River with limited metal analysis, and most of them are only in sediment and water (Ahmed et al., 2019a; Ali et al., 2016). Moreover, that River is potential for many aquatic species for their breeding, feeding and nursery ground purposes (Ahmed et al., 2019a). But there has been no limited investigation conducted on the Karnaphuli River estuary to assess the extent of heavy metal concentration in finfish and shellfish. Therefore, the present study was performed to determine the degree of heavy metal pollution in Karnaphuli River estuary, their sources and assess health risk for humans through fish and shellfish consumption.
2 Materials and methods
Ethical statement
Fish and shellfish samples were collected from the study area/stations. Those species are not on the IUCN list of endangered or protected species. The permission was taken from Research Cell, Noakhali Science and Technology University to catch specimens. The letter number is RCNSTU/2019/82.
2.2 Description of the study area
The study area is located on the Karnaphuli River, passing through Chittagong City, near the Bay of Bengal. This River is Chittagong 's largest River, native to the Lushai hills in India's Mizoram State. The finfish and shellfish samples were collected from various Karnaphuli River estuary stations (Fig. 1).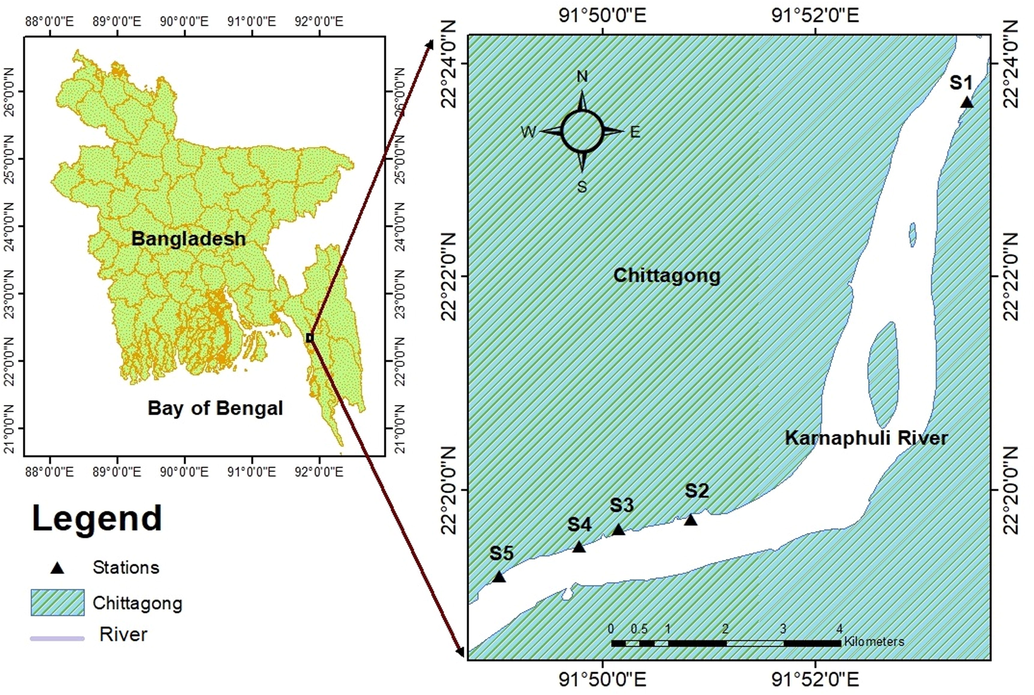
Sampling locations in the study area (Karnaphuli River estuary).
2.3 Sample collection
Nine finfish and shellfishes were selected for assessing their metal levels. The studied species were selected based on their habitat preferences (e.g., surface, mid or bottom), feeding habits (e.g., carnivores/ herbivores/omnivores) and economic importance. A total of 27 samples of nine fish and shellfish species were collected from different stations of the Karnaphuli River estuary (marked as S1, S2, S3, S4, S5) (Table 1, Fig. 1) in August 2019. By storing them in an ice box, all samples were kept frozen, and transported to the laboratory as soon as possible. After measuring each fish's physical parameters (weight and length), the scales, bones, and viscera were removed to fillet. Next, they rinsed the samples with purified water to remove foreign particles. After that, the samples were dried in an oven at 60 °C for 48 h, grounded into powder, and homogenized.
Local name
Scientific name
Feeding habit
Length (cm)
Weight (gm)
Poa
Otolithoides pama
Carnivorous
22.9 ± 1.714
83.68 ± 11.332
Baila
Awaous grammepomus
Omnivorous
23.93 ± 0.665
111.37 ± 23.11
Faisa
Setipinna phasa
Omnivorous
19.6 ± 0.565
36.816 ± 3.152
Taposi
Polynemus paradiseus
Carnivorous
18.0 ± 0.707
34.77 ± 3.282
Mrigal
Cirrhinus cirrhosus
Herbivorous
30.26 ± 1.934
249.7 ± 48.903
Chiring
Apocryptes bato
Carnivorous
10.0 ± 0.0816
6.276 ± 1.472
Golda chingri
Macrobrachium rosenbergii
Omnivorous
15.0 ± 0.408
26.706 ± 2.727
Gosha chingri
Metapenaeus dobsoni
Omnivorous
6.6 ± 0.993
1.973 ± 0.977
Daga Shamuk
Neritina smithi
Herbivorous
2.2 ± 0.081
6.486 ± 0.564
2.4 Determination of heavy metal contents
The AAS (Model: AA-700, SHIMADZU, JAPAN) was used to analyze the collected finfish and shellfish samples using the standard analytical procedure. The analyses of the trace elements were carried out in the laboratory in the Bangladesh Council for Scientific and Industrial Research (BCSIR), Dhaka. Recommended clean powder-free latex gloves and lab coats were used to avoid contamination during handling of the samples. Chromic acid solution and distilled water were used to clean the glassware properly. The present study utilized analytical-grade chemicals and reagents. Blank determinations were used as a control for obtaining the correct instrument readings.
2.5 Sample preparation
In a Teflon vessel with a mix of 5 ml of hydrofluorinated-nitric-perchloric acid, a known amount (0.5 g) of dried powder was digested. The reaction blend was heated to dryness at 80 °C. The residue was dissolved in 3 ml (Merck, supra-pure) diluted hydrochloric acid. Then, the digested solution was filtered through a filter paper of Whatman No. 42 and diluted to 10 ml with 2% HCl, used for Atomic Absorption Spectrophotometer metal determination (AA-7000 SHIMADZU, Japan). Triple estimates were made, and the results were expressed as mg / kg or ppm dry.
2.6 Sample analysis
A spectrophotometer for atomic absorption was developed with a flammable condition, and observance absorption optimized for testing. Then in AAS (AA-7000 Model SHIMADZU) the blanks (demonized water), standards, sample blank and samples were sucked into the flame. The curves of calibration for concentration vs. absorption. Data were statistically analyzed using the least square method to fit a straight line. There was also a blank reading, and necessary corrections were made in calculating the concentration of different elements. The wavelength and instrumental detection limit (mg/l) for different heavy metals are presented in Table 2.
Elements
Wavelength(nm)
Instrumental detection limit(mg/L)
Pb
217.0
0.013
Cr
357.9
0.1
Ni
232.0
0.01
Zn
213.9
0.1
Fe
248.3
0.1
2.7 Quality control
All instruments, glassware, and plastics were washed in a nitric acid solution for 15 min before being rinsed with deionized water. Throughout the study, analytical grade reagents (Merck; Germany) and de-ionized water were used for analysis. The certified reference material (CRM 320, Merck KGaA, Darmstadt, Germany) was used for validation and accuracy. In the applied analytical method, the recovery rate of the studied metals ranged from 72 to 105 percent. Furthermore, contamination had no effect on the analytical process, and the relative standard deviation (RSD) for all tests was 10%0.5.
2.8 Human health risk assessment
2.8.1 Metal pollution index (MPI)
The MPI was calculated following (Usero & González-Regalado, 1996) the equation 1 (Abdel-Khalek et al., 2016). The equation is as follows:
2.8.2 Estimated daily intake (EDI) and lifetime daily dose (LADD)
The estimated daily intake (EDI) value was estimated by using the equation (USEPA, 2008; Varol et al., 2017; Wei et al., 2014).
2.8.3 Hazard quotient (HQ)
THQ was estimated by the ratio of EDI and oral reference dose (RfD). The value of ratio < 1 indicates a non-significant risk effect (Abtahi et al., 2017). The THQ calculated followed by (Baki et al., 2018; Heshmati et al., 2018).
× 10-3 (3).where Ed indicates the total exposure duration in the whole life (65 years) (USEPA, 2008), Ep indicates exposure frequency (365 days/ year) (Ahmed et al., 2015), and it indicates the average time for the non-carcinogenic element (Ed × Ep).
2.8.4 Hazard index (HI)
Hazard index (HI) was calculated for the multiple elements (Hg, As, Mn, and Cr) found in the fish samples and the equation is as follows (Hossain et al., 2019; Xiao et al., 2018).
2.8.5 Cancer risk (CR)
The cancer-causing risk is assessed for the impact of exposure to the substantial pollutants that may develop cancer over a lifetime period. The risk limit is 10–6 to 10–4 (FAO, 2014; USEPA, 2000; Yin et al., 2015), which is standard and acceptable. Once CRs are higher than reported range (10–4), chances are higher of cancer-causing risk effect (Hu et al., 2017; USEPA, 2010). The CR is assessed from the method of slope factor as follows (Zhu et al., 2020).
× 10-3 (5).where CSF indicates oral slope factor of specific pollutant (mg/kg-day) (USEPA, 2000).
2.8.6 Statistical analysis
Statistical analyses such as cluster analysis (CA), correlation matrix (CM), PCA were performed by using the program, called PAST (PAleontological Statistics, Ver. 2.1). The CA of metals based on arbitrary Bray–Curtis similarity values was performed to plot elements in a separate cluster, thereby differentiating the contamination status of the samples. The CM and PCA were used to determine the correlation between heavy metals in order to identify potential metal sources.The mean values and standard deviations of the heavy metal concentrations in finfish and shellfish samples were calculated. Other calculations were performed by Microsoft Excel 2016.
3 Results
3.1 Concentrations of heavy metals
Concentrations of five heavy metals Cr, Pb, Fe, Zn, and Ni in fish tissues of six finfish and three shellfish species from Karnaphuli River were presented in Table 3. The mean heavy metal concentration of Cr, Pb, Fe, Zn and Ni in the tissues of fish and shellfish species was 0.906 ± 0.052 (0.059 to 1.605 mg/kg); 0.128 ± 0.032 (0.025 to 0.385 mg/kg); 83.015 ± 1.166 (42.13 to 133.85 mg/kg); 398.47 ± 1.154 (31.543 to 1458.68 mg/kg) and 0.233 ± 0.026 mg/kg (0.023 to 0.355 mg/kg) mg/kg respectively. In this present study, the ranking order of mean concentrations of the heavy metals in the muscle of fish and shellfish collected from Karnaphuli River estuary were Zn > Fe > Cr > Ni > Pb.
Species name
Heavy metals (mean ± SD) mg/kg
Cr
Pb
Fe
Zn
Ni
O. pama
1.525 ± 0.049
0.14 ± 0.028
80.846 ± 0.738
31.543 ± 1.275
0.225 ± 0.007
A. grammepomus
1.605 ± 0.136
0.183 ± 0.208
50.42 ± 1.285
393.93 ± 0.557
0.057 ± 0.004
S. phasa
0.09 ± 0.001
0.028 ± 0.001
133.85 ± 1.854
36.108 ± 1.15
0.17 ± 0.197
P. paradiseus
1.036 ± 0.005
0.165 ± 0.02
65.643 ± 1.458
33.24 ± 0.98
0.345 ± 0.007
C. cirrhosus
0.71 ± 0.016
0.385 ± 0.007
103.8 ± 0.469
1457.2 ± 2.16
0.023 ± 0.001
A. bato
0.709 ± 0.014
0.086 ± 0.008
103.27 ± 1.34
1458.7 ± 1.42
0.255 ± 0.007
M. rosenbergii
1.17 ± 0.212
0.025 ± 0.002
84.2 ± 1.09
70.34 ± 1.26
0.325 ± 0.007
M. dobsoni
1.25 ± 0.036
0.056 ± 0.008
82.98 ± 0.72
69.05 ± 0.41
0.34 ± 0.000
N. smithi
0.059 ± 0.004
0.086 ± 0.008
42.13 ± 1.54
36.15 ± 1.178
0.355 ± 0.007
Range
0.059–1.605
0.025–0.385
42.13–133.85
31.54–1458.68
0.023–0.355
Mean ± std
0.906 ± 0.052
0.128 ± 0.032
83.015 ± 1.166
398.47 ± 1.154
0.233 ± 0.026
The highest value of Cr was 1.605 ± 0.136 mg/kg found in A. grammepomus and the lowest value of Cr concentration was 0.059 ± 0.004 mg/kg) found in N. smithi. On the other hand, the highest amount of Pb was found in the fish sample of C. cirrhosis (0.385 mg/kg) and the lowest amount of Pb was found in M. rosenbergii (0.025 mg/kg). In this study, S. phasa contains the highest Fe (133.85 ± 1.854 mg/kg), whereas N. smithi. contains the lowest value of Fe concentration (42.13 ± 1.54 mg/kg). Additionally, the highest and lowest amount of Zn was found in A. bato (1458.68 mg/kg as dry wt.) and O. pama (31.543 mg/kg), respectively. The highest amount of Ni was found in the shellfish sample of N. smithi (0.355 mg/kg as dry wt.), the lowest amount of Ni was found in the fish sample of C. cirrhosis (0.023 mg/kg).
The estimated MPIs varied from 1.16 mg/kg to 4.72 mg/kg with the mean of 2.71 mg/kg (Fig. 2). The maximum MPI value (4.72 mg/kg) was linked to A. bato, followed by C. cirrhosis (3.94 mg/kg), A. grammepomus (3.19 mg/kg), M. dobsoni (2.67 mg/kg), P. paradiseus (2.64 mg/kg), O. pama (2.62 mg/kg), M. rosenbergii (2.24 mg/kg), N. smithi (1.22 mg/kg) and S. phasa (1.16 mg/kg) due to greater concentration level.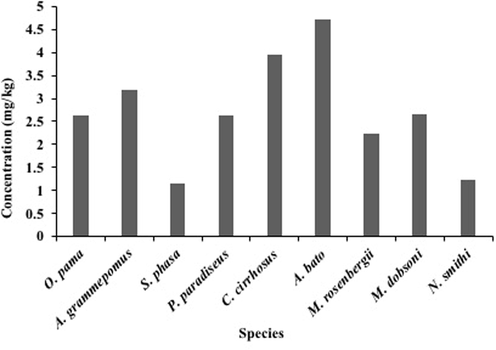
Metal Pollution Index (MPI) of studied metals in the Karnaphuli River estuary.
3.2 Sources identification
Table 4 presents the interrelations among metals as a Pearson correlation matrix. Pb displays a significant relationship with Ni that could have been originated from anthropogenic sources like industrial effluents from various industries such as printing, dyeing, and textile around Chittagong City. Other metals have no significant correlation between them. That means they probably come from different sources. If there is any significant relationship between two metals with the same pollution level, they release from the same source, mutual dependence, and individual character through River flow. Note: *p < 0.05 is significant (Bold value represents significant correlation).
Cr
Pb
Fe
Zn
Ni
Cr
1
Pb
0.14658
1
Fe
−0.32004
−0.057289
1
Zn
−0.10581
0.58233
0.33631
1
Ni
−0.1188
−0.6796*
−0.28604
−0.52413
1
PCA is the simplest of the eigenvector-based multivariate analysis presented in Fig. 3. In the Table 5, the result with eigenvalue, the variance of 100%, and cumulative variance for each factor is summarized. PC1 has the highest eigenvalue of 2.275. It suggests that PC1 is the most prevalent factor, and it contributes 45.502% variance having a high loading on Zn 0.552, which is not significant. PC2 contributes 28.019% of the total variance and has a high load on Cr 0.6862, which is significant. PC2 has an eigenvalue of 1.401. PC3 contributes 13.844% of total variance having a high load on Cr (0.6574) which is less significant. This factor has an eigenvalue of 0.692. PC4 has an eigenvalue of 0.436. It contributes 8.710% variance with high loading on metal Zn 0.7429, which is significant. PC5 contributes 3.924% of the total variance, having a high load on Pb (0.6840) which is significant. This factor has an eigenvalue of 0.196. Note: *p < 0.05 is significant.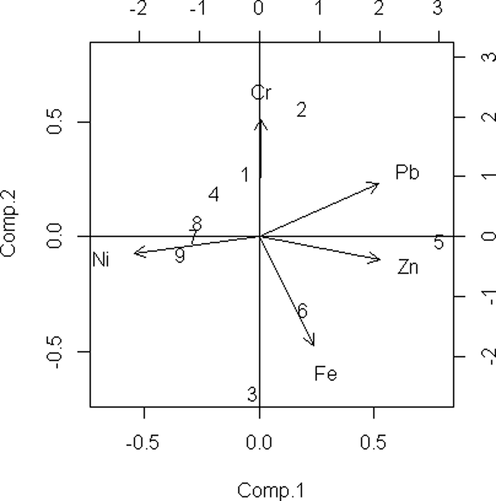
Principal component analysis of studied metals in the Karnaphuli River estuary.
Variable
PC 1
PC 2
PC 3
PC 4
PC 5
Cr
0.0087
0.6862*
0.6574
0.3035
0.0695
Pb
0.5491
0.3104
−0.3347
−0.14926
0.6840*
Fe
0.2480
−0.6362
0.6161
0.0069
0.3925
Zn
0.5522
−0.1358
−0.1762
0.74297*
−0.3057
Ni
−0.5761
−0.0979
−0.2127
0.57754
0.5288
Eigenvalue
2.275
1.401
0.692
0.436
0.196
Variance (%)
45.502
28.019
13.844
8.7101
3.924
Cumulative of Variance (%)
45.502
73.52
87.36
96.07
99.99
The Ward-Linkage method was used with Euclidean distance to execute hierarchical cluster dendrograms, resulting in three distinct clusters (Fig. 4). Cluster 1 contains Fe and Zn, while Cluster 2 contains Cr, Pb, and Ni. The metals associated with Cluster 1 could have come from anthropogenic activities such as chemical factories, the discharge of industrial effluents from diverse industries such as printing, dyeing, oil refineries, and textile around KEPZ. The metals, Cr, Pb, and Ni linked to cluster 2 could have been associated with the textile industry, fertilization, dying, tanning industries and oil leaking from the boats/ships in the study site.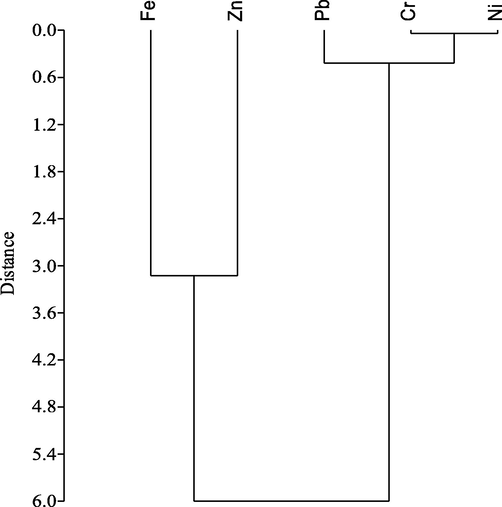
Hierarchical cluster (Dendrogram) of heavy metals (Variables) (Ward-Linkage).
3.3 Health risk evaluation
3.3.1 Estimated daily intake (EDI)
The studied EDI of two concerned age groups, adults and children, is presented and summarized in Table 6. For intake, the results for adults and children in the study area were lower the recommended daily allowance (RDA), following the descending order of Zn > Fe > Cr > Ni > Pb. EDIs, lower than RDA, indicated that the targeted groups of people could experience a possible lower health effect.
Element
Mean concentration (mg/kg)
Recommended daily allowance (mg/kg/person)
EDIs (mg/day per person)
Adult
Child
Cr
0.906
0.23
0.0007
0.003
Pb
0.128
0.25
0.0001
0.0004
Fe
83.015
__
0.066
0.2905
Zn
398.470
70
0.316
1.395
Ni
0.233
0.35
0.0002
0.0008
3.3.2 Hazard quotient (HQ) and hazard index (HI) for noncarcinogenic risk
THQs in the adult group induced to Cr, Pb, Fe, Zn and Ni were 0.0002, 2.0E-05, 0.0002, 0.001 and 2.0E-06, respectively, while the values for children were 0.0011, 0.0001, 0.001, 0.004 and 5.0E-05, respectively (Table 7). In addition, the rank of the THQs of the studied metals was as follows: Zn > Cr > Fe > Pb > Ni. Children were 5–6 times more vulnerable than adults for the cumulative state of HI. However, the examined HI was not exceeded the suggested boundary (Table 7).
Species
THQ (Cr)
THQ (Pb)
THQ (Fe)
THQ (Zn)
THQ (Ni)
HI
Adult
Child
Adult
Child
Adult
Child
Adult
Child
Adult
Child
Adult
Child
O. pama
0.0004
0.0018
0.00
0.0001
0.0002
0.0009
0.000
0.0004
0.00
0.000
0.0006
0.0033
A. grammepomus
0.0004
0.0018
0.00
0.0002
0.0001
0.0005
0.001
0.0045
0.00
0.000
0.0016
0.008
S. phasa
0.000
0.0001
0.00
0.000
0.0003
0.0015
0.0001
0.0004
0.00
0.000
0.0004
0.002
P. paradiseus
0.0003
0.0012
0.00
0.0002
0.0002
0.0008
0.000
0.0004
0.00
0.000
0.0005
0.0027
C. cirrhosus
0.0002
0.0008
0.00
0.0003
0.0002
0.0012
0.0038
0.017
0.00
0.000
0.0044
0.0193
A. bato
0.0002
0.0008
0.00
0.0001
0.0002
0.0012
0.0038
0.017
0.00
0.000
0.0043
0.0192
M. rosenbergii
0.0003
0.0013
0.00
0.00
0.0002
0.001
0.0002
0.0008
0.00
0.0001
0.0007
0.0032
M. dobsoni
0.0003
0.0014
0.00
0.0001
0.0002
0.001
0.0002
0.0008
0.00
0.0001
0.0007
0.0035
N. smithi
0.00
0.0001
0.00
0.00
0.0001
0.0004
0.0001
0.0004
0.00
0.0001
0.0002
0.001
Mean
0.0002
0.0011
0.00
0.0001
0.0002
0.001
0.001
0.004
0.00
0.00
0.0015
0.0069
3.3.3 Cancer risk (CR)
Exposure of CR was calculated only for specific metals (Table 8). The CR values of Cr, Pb and Ni were ranged from 2.34E to 08 – 6.05E-07, 1.68E-10 – 3.0E-09 and 3.1E-08 – 5.0E-07 respectively in adults and 1.03E-07 – 3.0E-06, 7.43E-10 – 1.0E-08 and 1.37E-07 – 2.1E-06 in children. The findings suggested that children were more susceptible to higher CRs than adults. Despite this, the CR values for both age groups were far away from the risk, as the standard range is 10–6 to 10–4.
Species
CR (Cr)
CR (Pb)
CR (Ni)
Adult
Child
Adult
Child
Adult
Child
O. pama
6.05E-07
2.67E-06
9.43E-10
4.0E-09
3.0E-07
1.0E-06
A. grammepomus
6.0E-07
3.0E-06
1.0E-09
5.0E-09
8.0E-08
3.0E-07
S. phasa
4.0E-08
2.0E-07
2.0E-10
8.0E-10
2.0E-07
1.0E-06
P. paradiseus
4.0E-07
2.0E-06
1.0E-09
5.0E-09
5.0E-07
2.0E-06
C. cirrhosus
3.0E-07
1.0E-06
3.0E-09
1.0E-08
3.1E-08
1.37E-07
A. bato
2.8E-07
1.24E-06
5.8E-10
2.55E-09
3.43E-07
1.52E-06
M. rosenbergii
4.64E-07
2.04E-06
1.68E-10
7.43E-10
4.38E-07
1.93E-06
M. dobsoni
4.96E-07
2.19E-06
3.7E-10
1.67E-09
4.58E-07
2.02E-06
N. smithi
2.34E-08
1.03E-07
5.8E-10
2.55E-09
4.78E-07
2.1E-06
Mean
4.0E-07
2.0E-06
8.71E-10
3.59E-09
3.14E-07
1.33E-06
4 Discussion
4.1 Heavy metals concentration and source identification
In the present study, fish and shellfishes were collected from different stations and the concentration of metals follows the order as: Zn (398.47) > Fe (83.015) > Cr (0.906) > Ni (0.233) > Pb (0.128). A. grammepomus had the highest concentration of Cr, whereas C. cirrhosus exhibited the maximum level of Pb and Zn, and N. smithi had the highest concentration of Ni. S. phasa has shown the highest concentration of Fe and A. bato has shown the highest concentration of Zn. The metal concentrations in the edible tissues were ordered: A. bato > C. cirrhosus > A. grammepomus > M. dobsoni > P. paradiseus > O. pama > M. rosenbergii > N. smithi > S. phasa (Table 3). The data from the earlier studies exhibited that metal concentrations in fish and shellfish tissues extensively varied subject to the location and species (Table 9). Note: NA- not analyzed.
Sample area
Sample
Cr
Pb
Fe
Zn
Ni
Reference
Eastern Mediterranean Sea
Wet wt. (mg/kg)
0.0007–0.24
0.003–0.071
NA
3.418–7.625
0.01–0.327
Copat et al., (2013)
Pearl River Delta, China
Wet wt. (mg/kg)
0.20–0.65
0.03–8.62
NA
15.2–29.5
0.44–9.75
Leung et al., (2014)
Bangshi River
Dry wt. (mg/kg)
0.47– 2.07
1.76– 10.27
NA
42.83– 418.1
0.69– 4.36
Rahman et al., (2012)
Mediterranean and Aegean Sea (Turkey)
Wet wt. (mg/kg)
0.07– 1.48
0.21– 1.28
NA
3.51–53.5
0.03– 1.72
Turkmen et al., (2009)
Iskenderun Bay, Turkey
Dry wt. (mg/kg)
0.07–6.46
0.09–6.95
0.82–27.35
0.60–11.57
0.11–12.88
Turkmen et al., (2005)
Hooghly River (India)
Dry wt. (mg/kg)
0–3.89
12.40– 19.96
NA
12.13– 44.74
2.20– 3.69
De et al., (2010)
Rivers (Bangladesh)
Dry wt. (mg/kg)
NA
0.29– 10.05
31.80–296.2
33.01– 286.5
1.20– 6.10
Sharif et al., (1993)
Buriganga River
Wet wt. (mg/kg)
1.59–16.05
0.47–4.55
NA
58.56–187.04
0.36–5.75
Ahmed et al., (2015)
Meghna River Estuary
Dry wt. (mg/kg)
0.62–1.19
2.76–4.63
NA
NA
NA
Ahmed et al., (2019b)
Karnaphuli River Estuary
Dry wt. (mg/kg)
0.059–1.605
0.025–0.385
42.13–133.85
31.54–1458.6
0.023–0.355
Present Study
In the fish and shellfish species, except for S. phasa, C. cirrhosus, A. bato, and N. smithi, the mean Cr contents were greater than the recommendation value of 1.0 mg/kg (MOFL, 2014). Furthermore, all fish and shellfish species except S. phasa and N. smithi surpassed the FAO's recommended threshold of 0.15 mg/kg (FAO, 1983). The findings of this study were roughly 18 times greater than those of Copat et al., (2013), who found 0.049 mg/kg of Cr in the Eastern Mediterranean Sea. Furthermore, average Cr concentrations in this study were greater than in previous investigations (Islam et al., 2013; Leung et al., 2014) (Table 5). Cr in the diet affects lipid and glucose absorption in a significant way (Ahmed et al., 2015; Ali et al., 2018). Cr deficiency can cause slowed progress and denature lipid, protein, and glucose absorption (Calabrese et al., 1985). Excessive Cr consumption, on the other hand, might result in acute respiratory diseases (Ahmed et al., 2016; Forti et al., 2011), as well as damage of potential organs like the liver, lungs, and kidneys (Ali et al., 2020).
The recommended maximum permissible concentration limit for Fe is 100 mg/kg (WHO, 2000). Thus, the concentrations of Fe in the fish and shellfish samples analyzed did not exceed the maximum permissible limit (WHO, 2000), except S. phasa (133.85 mg/kg). However, mean concentrations of Fe in all species were higher than fishes from Iskenderun Bay, Turkey (Türkmen et al., 2005). The FAO maximum guideline for Zn is 30 mg/kg (FAO, 1983). The rank denotes that the highest concentration of Zn (1458.68 mg/kg) was detected in A. bato, and O. pama represented the lowest Zn concentration level (31.54 mg/kg). However, the concentration level of Zn in the fish and shellfish species was mostly similar to the reported value of the Bangshi River (Rahman et al., 2012). Moreover, from Table 5, the average concentrations of Zn in all specimens were higher than other related studies (Ahmed et al., 2015; Copat et al., 2013). Thus, through the consumption of these organisms, these metals posed a threat. Toxicity due to excessive Zn intake causes electrolyte imbalance, nausea, anemia, and lethargy (Prasad, 1984). In this present study, Ni concentrations in Karnaphuli River water fish and shellfishes were below the established safe level of 5.5 mg/kg by Western Australian Food and Drug Regulations (Plaskett and Potter, 1979). The ranking order of mean concentrations of Ni in the muscle of fish and shellfish were, N. smithi > M. dobsoni > P. paradiseus > M. rosenbergii > A. bato > O. pama > S. phasa > A. grammepomus > C. cirrhosus (Table 3). However, the concentrations of Ni in the fish and shellfish species were similar to the reported value of (Copat et al., 2013), who found the range of Ni level as 0.011–0.327 mg/kg (ww). The concentration of Ni was reported in the range of 1.20– 6.10 mg/kg in fish species from the freshwater River of Bangladesh (Sharif et al., 1993), which exceeded the present study findings. Moreover, average concentrations of Ni in the present study area was lower than other recognized studies (De et al., 2010; Leung et al., 2014) (Table 5). Nickel occurs typically at very low levels in the environment, and it can cause a variety of pulmonary adverse health effects, such as lung inflammation, fibrosis, emphysema, and tumors (Forti et al., 2011).
The correlation analyses revealed that the sources of the metals in the corresponding specimens were perhaps similar (Table 5). According to Pearson correlation coefficients, values with a confidence level of 95 percent (significance level at p = 0.05), a significant correlation was found between Pb and Ni. Both of them probably have a common anthropogenic sources. It was found by various indices that the study site is moderately polluted by Cr and Zn. Table 9 shows that the heavy metal concentration of the Karnaphuli River estuary is higher than Eastern Mediterranean Sea (Copat et al., 2013). Heavy metal concentrations in the Rivers like Bangshi River and Buriganga River are higher than Karnaphuli River estuary. Though it was found that Cr and Zn moderately pollute the estuary, the degree of contamination by other metals is not so high in the study site. Till now, we can say the Karnaphuli River estuary doesn’t contain any high contaminants, and the metal concentration doesn’t possess an increased risk for humans, other animals, and the environment.
4.2 Human health risk evaluation
EDIs evaluate both the non-carcinogenic risk (THQ) and the carcinogenic risk (CR) of targeted metals ingestion in aquatic foodstuffs (Liu et al., 2018). Table 6 shows the EDIs of local people in the current study area for the selected brackish and shellfish species. In terms of intake, the results for adults and children were all below the recommended daily allowance (RDA) and in the following descending order: Zn > Fe > Cr > Ni > Pb. Because EDIs were lower than RDA, it was assumed that the targeted groups of persons would have a reduced health effect. For example, the results were significantly below the proposed tolerance level (Table 4). Given the increased buildup of metals in fish specimens, the long-term health implications would be considered (Ali et al., 2020).
The target hazard quotient (THQ) for ingestion of targeted specimens of fish and shellfish was shown in (Table 7). For THQ, the standard threshold limit is 1, recommended by USEPA (USEPA, 2011). The present study described that the THQ means of all fish and shellfish species were below 1, both for adults and children. None of these exceeded the guideline limit for the every metal in all specimens. However, the examined HI did not exceed the recommended limit, indicating that consumers (adults and children) would not suffer non-carcinogenic health effects from consuming selective fish and shellfish species.
In fact, humans are vulnerable to undergo the detrimental effects of combined pollutants simultaneously (Li et al., 2013a; Li et al., 2013b). Due to the lack of a certain level of concentration, THQ, and HI are still not measured a direct measure of risk alarm described by USEPA (USEPA, 1999). Cr, Pb, and Ni carcinogenic risk (CR) was calculated in (Table 8), due to the availability of the cancer-causing power slope factor for those metals. The CR values below 10-6 indicate a negligible health risk, while the 10-6–10-4 range values are in the acceptable belt (Baki et al., 2018). CRs above 10-4 are likely to increase the likelihood of affecting carcinogenic risk (Hu et al., 2017; USEPA, 2010). All exposures to CR had been negligible in the study. Additionally, for both adults and children, CR of Pb was less than the negligible limit. The results also indicated that children are more vulnerable to exposure to CR than adults. Similar findings were consistent with previous literatures (Liu et al., 2018; Saha et al., 2016).
5 Conclusions
This study ranked the average concentrations of heavy metals in fish and shellfish muscle as follows: Zn > Fe > Cr > Ni > Pb. Results showed that Cr and Zn concentration was significantly higher than standard FAO recommended values. In A. bato, the mean Zn content was the highest, exceeding the maximum FAO recommendations. The mean Cr concentration in this study demonstrated the highest concentration level in A. grammepomus, which slightly exceeded Bangladesh 's guidelines on food safety. Because EDIs are lower than RDA, they imply that the targeted groups of people may have a lesser health effect. THQ was conducted on both adults and children and concluded that none of them had a non-carcinogenic effect on health. On the other hand, CR values for adults and children were less than the threshold limit (10–4), indicating that CR was negligible for all consumers. Pearson's correlation showed significant correlations between Pb and Ni, indicating they had the same source, either natural or anthropogenic. Carcinogenic risk assessment, however, suggested that for the time being, local consumers were free from the risk of cancers; still, they may be affected in the future when fish from the studied region are consumed. As the levels of some metals (e.g., Cr, Zn) were found higher than the standard limit, continuous monitoring is suggested and untreated discharge of solid or liquid waste must be stopped.
6 Animal ethics
No field permit or ethics approval was needed since no rules and regulations were set by the University and/or local authorities.
Funding
This work was financially supported by the Universiti Brunei Darussalam under the Faculty/Institute/Center Research Grant (No. UBD/RSCH/1.4/FICBF(b)/2020/029) and (No. UBD/RSCH/1.4/FICBF(b)/2021/037. Also supported by Researchers Supporting Project Number (RSP2022R410), King Saud University, Riyadh, Saudi Arabia.
Acknowledgements
The authors acknowledge the Bangladesh Council of Scientific and Industrial Research (BCSIR) laboratory, Dhaka, for the provision of instrumental and laboratory facilities. The author would like to thank the editor and anonymous reviewers for the improvement of the manuscript. The authors would like to extend their sincere appreciation to the Researchers Supporting Project Number (RSP2022R410), King Saud University, Riyadh, Saudi Arabia.
Declaration of Competing Interest
The authors declare that they have no known competing financial interests or personal relationships that could have appeared to influence the work reported in this paper.
References
- Assessment of metal pollution around sabal drainage in River Nile and its impacts on bioaccumulation level, metals correlation and human risk hazard using Oreochromis niloticus as a bioindicator. Turkish J. Fish. Aquat. Sci.. 2016;16(2):227-239.
- [Google Scholar]
- Heavy metals (As, Cr, Pb, Cd and Ni) concentrations in rice (Oryza sativa) from Iran and associated risk assessment: a systematic review. Toxin Rev.. 2017;36(4):331-341.
- [Google Scholar]
- Bioaccumulation and heavy metal concentration in tissues of some commercial fishes from the Meghna River Estuary in Bangladesh and human health implications. Mar. Pollut. Bull.. 2019;145:436-447.
- [Google Scholar]
- Bioaccumulation of heavy metals in some commercially important fishes from a tropical river estuary suggests higher potential health risk in children than adults. Plos One. 2019;14(10)
- [Google Scholar]
- Human health risk assessment of heavy metals in tropical fish and shellfish collected from the river Buriganga. Bangladesh. Environ. Sci. Pollut. Res.. 2015;22(20):15880-15890.
- [Google Scholar]
- Human health risks from heavy metals in fish of Buriganga river. Bangladesh.. 2016;SpringerPlus5(1):1-12.
- [Google Scholar]
- Heavy metal toxicity in the water column and benthic sediments of a degraded tropical stream. Ecotoxicol. Environ. Saf.. 2020;190:110153
- [Google Scholar]
- Contamination and ecological risk assessment of heavy metals and metalloids in surface sediments of the Tajan River. Iran. Mar. Pollut. Bull.. 2018;133:741-749.
- [Google Scholar]
- Preliminary assessment of heavy metals in water and sediment of Karnaphuli River, Bangladesh. Environ. Nanotechnol. Monit. Manag.. 2016;5:27-35.
- [Google Scholar]
- Assessment of toxic metals in water and sediment of Pasur River in Bangladesh. Water Sci. Technol.. 2018;77(5):1418-1430.
- [Google Scholar]
- Assessment of trace elements in the demersal fishes of a coastal River in Bangladesh: A public health concern. Thalassas: Int. J. Mar. Sci.. 2020;36(2):641-655.
- [Google Scholar]
- Heavy metal concentrations in commercially valuable fishes with health hazard inference from Karnaphuli river, Bangladesh. Human Ecol. Risk Assess. Int. J.. 2019;26(10):2646-2662.
- [Google Scholar]
- Determination of selected heavy metal and analysis of proximate composition in some fish species from Ogun River. Southwestern Nigeria. Heliyon. 2019;5(10):e02512
- [Google Scholar]
- Concentration of heavy metals in seafood (fishes, shrimp, lobster and crabs) and human health assessment in Saint Martin Island. Bangladesh. Ecotoxicol. Environ. Saf.. 2018;159:153-163.
- [Google Scholar]
- Heavy metal contamination in surface water and sediment of the Meghna River, Bangladesh. Environ. Nanotechnol. Monit. Manag.. 2017;8:273-279.
- [Google Scholar]
- Heavy metals concentrations in fish and shellfish from eastern Mediterranean Sea: consumption advisories. Food Chem. Toxicol.. 2013;53:33-37.
- [Google Scholar]
- Trace element concentration and its risk assessment in common kilka (Clupeonella cultriventris caspia Bordin, 1904) from southern basin of Caspian Sea. Toxin Rev.. 2017;36(3):222-227.
- [Google Scholar]
- Level of heavy metals in some edible marine fishes of mangrove dominated tropical estuarine areas of Hooghly River, North East Coast of Bay of Bengal. India. Bull. Environ. Contamin. Toxicol.. 2010;85(4):385-390.
- [Google Scholar]
- Distribution and metal contamination in the coastal sediments of Dammam Al-Jubail area, Arabian Gulf, Saudi Arabia. Mar. Pollut. Bull.. 2018;128:8-16.
- [Google Scholar]
- Health risk assessment induced by chloroform content of the drinking water in Iran: systematic review. Toxin Rev.. 2017;36(4):342-351.
- [Google Scholar]
- Compilation of legal limits for hazardous substances in fish and fishery products. FAO Fish Circ. 1983;464:5-100.
- [Google Scholar]
- The State of the World Fisheries and Aquaculture. Opportunities and Challenges. Rome, Italy: FAO Fisheries and Aquaculture Dept.; 2014. p. :243.
- In vitro evaluation of the toxicity induced by nickel soluble and particulate forms in human airway epithelial cells. Toxicol. Vitro. 2011;25(2):454-461.
- [Google Scholar]
- Possible economic impact on coastal fish stock resources in Bangladesh in the case of climate change. Norway: Universitetet i Tromsø; 2010. p. :37. MSc thesis
- Risk assessment of benzene in food samples of Iran's market. Food Chem. Toxicol.. 2018;114:278-284.
- [Google Scholar]
- Baseline study of heavy metal contamination in the Sangu River estuary, Chattogram. Bangladesh. Mar. Pollut. Bull.. 2019;140:255-261.
- [Google Scholar]
- Metals Bioaccumulation in 15 Commonly Consumed Fishes from the Lower Meghna River and Adjacent Areas of Bangladesh and Associated Human Health Hazards. Toxics. 2022;10:139.
- [CrossRef] [Google Scholar]
- Assessment of heavy metal pollution and health risks in the soil-plant-human system in the Yangtze River Delta, China. Int. J. Environ. Res. Public health.. 2017;14(9):1042.
- [Google Scholar]
- Climate change impacts on a tropical fishery ecosystem: Implications and societal responses. Sustainability. 2020;12(19):7970.
- [Google Scholar]
- Heavy metals in sediment and their accumulation in commonly consumed fish species in Bangladesh. Arch. Environ. Occupat. Health.. 2017;72(1):26-38.
- [Google Scholar]
- Preliminary assessment of heavy metal contamination in surface sediments from a river in Bangladesh. Environ. Earth Sci.. 2015;73(4):1837-1848.
- [Google Scholar]
- Health risk assessment due to heavy metal exposure from commonly consumed fish and vegetables. Environ. Syst. Decis.. 2016;36(3):253-265.
- [Google Scholar]
- Contamination and ecological risk assessment of the Red Sea coastal sediments, southwest Saudi Arabia. Mar. Pollut. Bull.. 2020;154:111125
- [Google Scholar]
- Assessment of Zn pollution sources and apportionment in agricultural soils impacted by a Zn smelter in South Korea. J. Hazard. Mater.. 2019;364:475-487.
- [Google Scholar]
- Enrichment and geochemical mobility of heavy metals in bottom sediment of the Hoedong reservoir, Korea and their source apportionment. Chemosphere. 2017;184:74-85.
- [Google Scholar]
- Source identification of arsenic contamination in agricultural soils surrounding a closed Cu smelter, South Korea. Chemosphere. 2019;217:183-194.
- [Google Scholar]
- Assessment of heavy metals/metalloid (As, Pb, Cd, Ni, Zn, Cr, Cu, Mn) concentrations in edible fish species tissue in the Pearl river delta (PRD) China. Mar. Pollut. Bull.. 2014;78(1-2):235-245.
- [Google Scholar]
- Potential risk assessment of heavy metals by consuming shellfish collected from Xiamen, China. Environ. Sci. Pollut. Res.. 2013;20(5):2937-2947.
- [Google Scholar]
- Assessing the hazardous risks of vehicle inspection workers’ exposure to particulate heavy metals in their work places. Aero. Air Qualit. Res.. 2013;13(1):255-265.
- [Google Scholar]
- Accumulation and ecological risk of heavy metals in soils along the coastal areas of the Bohai Sea and the Yellow Sea: A comparative study of China and South Korea. Environ. Int.. 2020;137
- [Google Scholar]
- Ecological risk assessment and distribution of potentially harmful trace elements in lake sediments of Songnen Plain, NE China. Ecotoxicol. Environ. Saf.. 2018;163:117-124.
- [Google Scholar]
- Toxicological effects of heavy metals on histological alterations in various organs in Nile tilapia (Oreochromis niloticus) from freshwater reservoir. J. King Saud University-Science. 2020;32(1):970-973.
- [Google Scholar]
- Assessment of sediment quality using different pollution indicators and statistical analyses, Hurghada area, Red Sea coast. Egypt. Mar. Pollut. Bull.. 2018;133:808-813.
- [Google Scholar]
- Heavy metal concentrations in the muscle tissue of 12 species of teleost from Cockburn Sound, Western Australia. Mar. Freshwater Res.. 1979;30(5):607-616.
- [Google Scholar]
- Discovery and importance of zinc in human nutrition. Federation Proc.. 1984;43(13):2829-2834.
- [Google Scholar]
- Assessment of metal mobility in sediment, commercial fish accumulation and impact on human health risk in a large shallow plateau lake in southwest of China. Ecotoxicol. Environ. Saf.. 2020;194
- [Google Scholar]
- Risk analysis of heavy metal concentration in surface waters across the rural-urban interface of the Wen-Rui Tang River. China. Environ. Pollut.. 2018;237:639-649.
- [Google Scholar]
- Study on heavy metals levels and its risk assessment in some edible fishes from Bangshi River, Savar, Dhaka. Bangladesh. Food Chem.. 2012;134(4):1847-1854.
- [Google Scholar]
- Seasonal investigation of heavy metals in marine fishes captured from the Bay of Bengal and the implications for human health risk assessment. Food control. 2016;70:110-118.
- [Google Scholar]
- Trace element concentrations in ten species of freshwater fish of Bangladesh. Sci. Total Environ.. 1993;138(1–3):117-126.
- [Google Scholar]
- Assessment of heavy metal pollution in water and surface sediment and evaluation of ecological risks associated with sediment contamination in the Ganga River: a basin-scale study. Environ. Sci. Pollut. Res.. 2019;26(11):10926-10940.
- [Google Scholar]
- Heavy metals in three commercially valuable fish species from Iskenderun Bay, Northern East Mediterranean Sea. Turkey. Food Chem.. 2005;91(1):167-172.
- [Google Scholar]
- Evaluation of possible human health risk of heavy metals from the consumption of two marine fish species Tenualosa ilisha and Dorosoma cepedianum. Biol. trace elem. res.. 2019;191(2):485-494.
- [Google Scholar]
- Screening Level Ecological Risks Assessment Protocol for Hazardous Waste Combustion Facilities. Appendix E: Toxicity Reference Values; 1999.
- Risk-based Concentration Table. Washington DC, Philadelphia: US EPA; 2000.
- Integrated Risk Information System. Washington, DC, USA: United States Environmental Protection Agency; 2008. https://www.epa.gov/iris. (accessed on 25 August 2020)
- USEPA. 2010. Integrated Risk Information System (IRIS); United States Environmental Protection Agency: Washington, DC, USA. Available online: http://www.epa.gov/ncea/iris/index.html (accessed on 15 August 2020).
- USEPA. 2011. USEPA Regional Screening Level (RSL) Summery Table: November 2011. http://www.epa.gov/regshwmd/risk/human/Index.htm.
- Potential toxic elements in sediment of some rivers at Giresun, Northeast Turkey: A preliminary assessment for ecotoxicological status and health risk. Ecol. Indicat.. 2020;113 106237
- [Google Scholar]
- Heavy metal and arsenic concentrations in rainbow trout (Oncorhynchus mykiss) farmed in a dam reservoir on the Firat (Euphrates) River: Risk-based consumption advisories. Sci. Total Environ.. 2017;599:1288-1296.
- [Google Scholar]
- Contamination, ecological risk and source apportionment of heavy metals in sediments and water of a contaminated river in Taiwan. Ecol. Indicat.. 2017;82:32-42.
- [Google Scholar]
- Metal concentrations in various fish organs of different fish species from Poyang Lake. China. Ecotoxicol. Environ. Saf.. 2014;104:182-188.
- [Google Scholar]
- WHO. 2000. WHO technical report series. Evaluation of certain food additives and contaminants. Fifty-third report of the joint FAO/WHO expert committee on food additives (JECFA). World Health Organization Geneva, Switzerland. http://www.Who. Int/foodsafety/publications/jecfa-reports/en/, (accessed 14 August 2020).
- Influencing factors and health risk assessment of microcystins in the Yongjiang river (China) by Monte Carlo simulation. PeerJ. 2018;6:e5955
- [Google Scholar]
- Spatial distribution of perfluoroalkyl acids (PFAAs) and their precursors and conversion of precursors in seawater deeply affected by a city in China. Ecotoxicol. Environ. Saf.. 2020;194:110404
- [Google Scholar]
- Heavy metal pollution in the surface water of the Yangtze Estuary: a 5-year follow-up study. Chemosphere. 2015;138:718-725.
- [Google Scholar]
- Evaluation of ecosystem health and potential human health hazards in the Hangzhou Bay and Qiantang Estuary region through multiple assessment approaches. Environ. Pollut.. 2020;264
- [Google Scholar]


