

Translate this page into:
How environmental factors affecting COVID-19 transmission? case study: Riyadh region in Saudi Arabia
-
Received: ,
Accepted: ,
This article was originally published by Elsevier and was migrated to Scientific Scholar after the change of Publisher.
Peer review under responsibility of King Saud University.
Abstract
The effects of environmental factors on COVID-19 spread in Saudi Arabia (Riyadh region) and the distribution and population size of disease vectors. Extracted daily environmental data (e.g., minimum temperature, maximum temperature, average temperature, rainfall, wind speed, and relative humidity) over Riyadh region of Saudi Arabia. Spearman's rank correlation coefficient used to analyze the data. Average temperatures, minimum temperatures, maximum temperatures, and relative humidity were significantly correlated with a COVID-19 epidemic. This research will enable advanced understanding of how natural climatic environmental parameters affect the spread of COVID-19 in Saudi Arabia (Riyadh region).
Abstract
In this study, I have conducted non-medical, non-clinical-care research that will enable immediate exploring of how environmental factors affect spread of COVID-19 in Kingdom of Saudi Arabia (KSA). It focusses on climatic environmental factors that affect the distribution and population size of disease vectors and the relationship(s) between each of these environmental variables that provided from National Center for Metrology and COVID-19 infected cases from Ministry of Health in KSA. I used daily environmental data, including minimum, maximum, and averages temperatures (°C), rainfall amounts (mm), wind speed (KTS/Deg) and relative humidity (%) over the Riyadh region in Saudi Arabia. Spearman's rank correlation coefficient used to analyze the data. The results showed that average temperatures, minimum temperatures, and maximum temperatures were significantly correlated with a COVID-19 epidemic, (r = 0.527; 0.509; 0.530 respectively). A negative correlation was found with relative humidity (r = -0.475). These findings will be used as lessons learned as well as best practices in the future to help decision makers to understand the factors controlling COVID-19′s spread in KSA.
Keywords
COVID-19
Riyadh
Temperatures
Wind speed
Rainfall and humidity
Spearman-Rank correlation test

1 Introduction
The emergence of viral pandemics poses significant threats to human and society health as well as the global economy. During the month of December 2019, China has recently been reported to have a newly discovered Coronavirus disease (COVID-19) (Huang et al., 2020; Wu et al., 2020). COVID-19 has reached a pandemic level (Ahn et al., 2020). On November 20th, 2022, more than 642 million cases are infected globally; of which more than 6 million death cases are reported (Worldmeters, 2022). COVID-19 is known to cause respiratory infections in humans and animals (Chen et al., 2020; Chan et al., 2020). The current situation of COVID-19 has resulted in more than 549,412 infected cases and 8,822 death cases in Saudi Arabia (CDC, 2020; worldmeters, 2021). It is important to continue to study and identify this epidemic even though recovery rates have been excellent (97.994 % as of Sehhty 2021) so that we can be ready for any mutations caused by this virus that might arise in the future.
COVID-19 has high variability in behavior and properties, which makes it difficult for researchers to determine how it spreads across different environments. Several studies have found an association between COVID-19 cases and climatic parameters. Results of such studies might indicate optimum climatic setting for the viral transmission.
Several studies have suggested a strong correlation between climatic parameters and factors affecting the COVID-19 mortality (Onder et al., 2020). In lower temperature conditions, Wang et al (2020) concluded that factors such as average temperatures, minimum temperatures, and maximum temperatures increased the number of COVID-19 cases by 0.83, 0.82, and 0.83 respectively, with every 1 °C increase. There were fewer cases overall by 0.86 per degree Celsius as the minimum temperature increased under higher weather conditions. Ma et al (2020) found a positive correlation of COVID-19 daily death counts with diurnal temperature range (r = 0.44). A negative correlation was found with relative humidity (r = − 0.32). Increases in COVID-19 deaths were only associated with a 2.92 % increase in a 1℃ diurnal temperature ranges. As temperatures and relative humidity increased, COVID-19 deaths decreased. As a result of a 1 °C rise in the mean temperature, Xie and Zhu (2020) found that COVID-19 cases rose 4.861 % per day. Tosepu et al (2020) found correlation is positive between the average temperature (°C) compared with COVID-19 (r = 0.392; p < 0.01) in Indonesia.
Temperature and humidity are influenced by the population density and the climate are major factors in virus transmission (Usmani et al. 2022, Dalziel et al., 2018). The public and decision makers do not yet have a comprehensive understanding of how the natural environment affects COVID-19 spread, which is why this research is necessary.
Saudi Arabia covers five different climatic zones (Said and Al-Zaharnah, 1994, 1991) “Fig. 1” A subtropical climate has Mediterranean subzones and mountainous regions, hot and dry maritime subzones, cold and dry desert subzones, and hot and dry desert subzones. These climatic zones have their own sets of climatic settings, including minimum temperatures, maximum temperatures, average temperatures, rainfall, wind speed, and relative humidity. In this study, I have conducted research that will enable immediate exploring of how climatic factors affect spread of COVID-19 in Riyadh the capital of Saudi Arabia which is has the highest number of COVID-19 total cases in KSA (105, 414 total cases, Corona-V, 2021: sehhty, 2021). I particularly focused on climatic and environmental factors that affect the distribution and population size of disease. COVID-19 cases have been extracted from Ministry of Health in KSA (sehhty, 2021). Environmental climatic data extracted from National Center for Meteorology in KSA (NCM, 2021).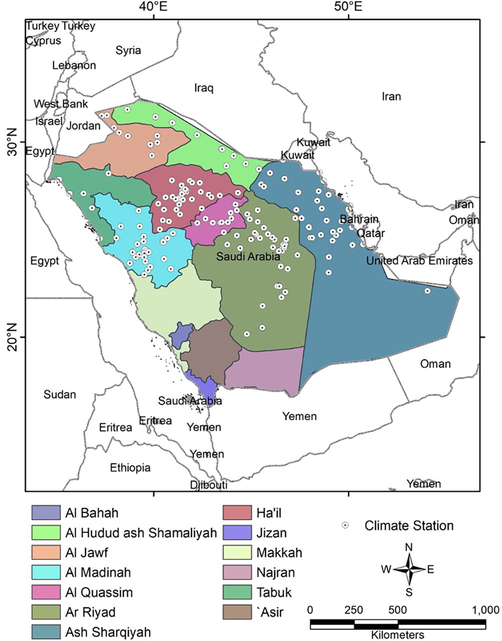
Spatial distribution of climate stations over Administrative Regions in Saudi Arabia.
2 Data and methods
2.1 Study area
The capital city of Saudi Arabia, Riyadh, the city has one of the highest population densities in KSA, with 7.6 million inhabitants residing in an area measuring 1,973 square kilometers (762 square miles) and lying between 24°38′N 46°43′E. “Fig. 1″.
2.2 Statistical analysis
An analysis of the Spearman correlation examines the monotonic relationship between two continuous or ordinal variables. When variables change in a monotonic relationship, they do so in a continuous manner, but not necessarily at the same rate. It uses ranked values for each variable instead of raw data to calculate the Spearman correlation coefficient. In statistics, Spearman's correlation coefficient measures how strongly paired data have a monotonic relationship by using the following formula:
ρ = Spearman's rank correlation coefficient.
di = difference between the two ranks of each observation.
n = number of observations.
COVID-19 dataset of reported cases in Riyadh is a combination of data from March 3, 2020 - August 31, 2021, taken from the Ministry of Health in Saudi Arabia COVID-19 data archive. A climate indicator dataset was obtained from the National Center for Metrology in Saudi Arabia. The dataset contains four climate indicators: temperature, humidity, wind speed and rainfall. Spearman rank correlation tests were used as a measure of correlation between variables since the data do not follow a normal distribution.
3 Results and discussion
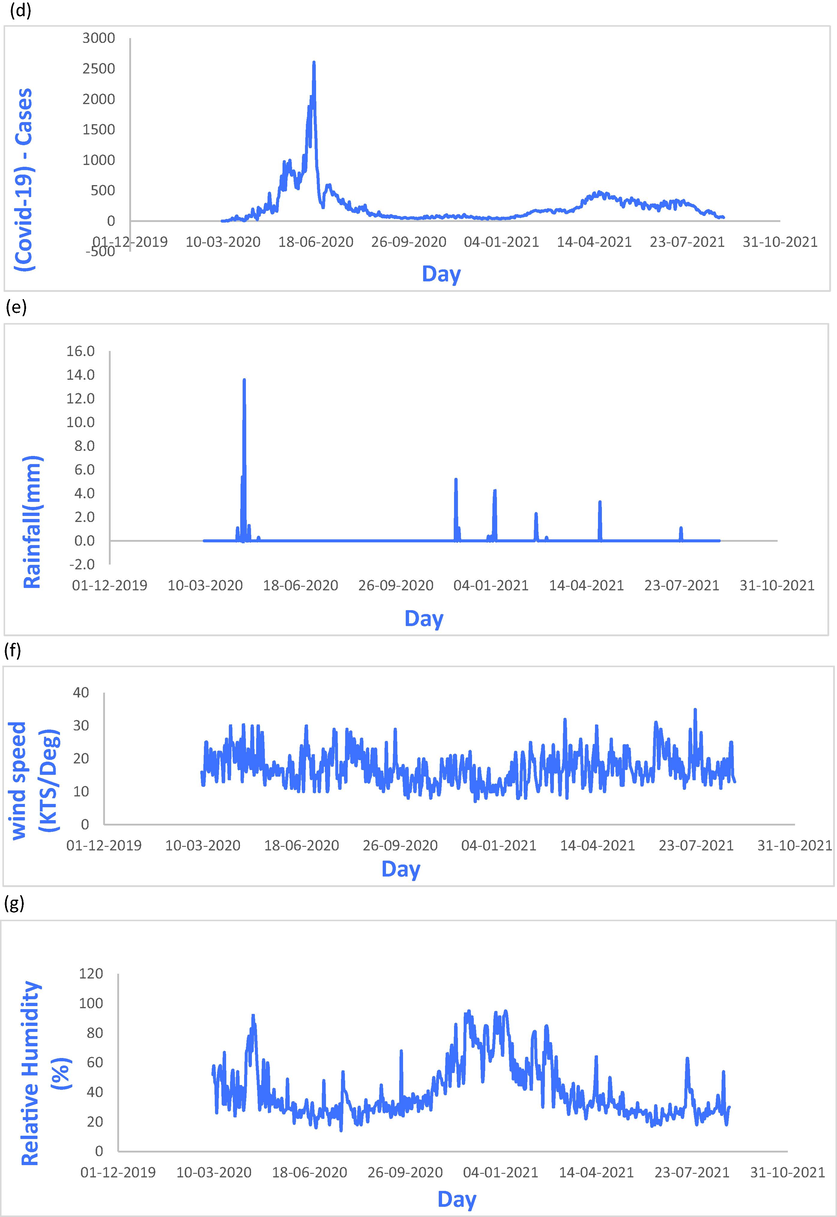
As shown in “Fig. 2(d)”, cases are increasing rapidly of COVID-19 was seen in Riyadh. The first report of one case was on March 9, 2020, followed by a second report of 49 cases, and by the end of the month the total cases numbered 574. In Fig. 2(a, b, and c), On Jan 13,2021, the minimum temperature was 2.6 °C (highest minimum temperature of 34.1 °C on Apr 28,2021), the highest maximum temperature was 49 °C on Jul 12,2021(the lowest maximum temperature of 14.1 °C), and the lowest average temperature was 9.6 °C on Feb 1,2021 (highest average temperature of 40.8 °C on July 21, 2020). July 21, 2020, had the lowest relative humidity of 14 % (with the highest level of 95 % on December 2, 2020) as shown in Fig. 2(g), and 0.0 mm of rainfall was most of the study period (with the highest level of 13.6 mm on April 20, 2020, showing in Fig. 2(e). The highest wind speed was 35 KTS/Deg on July 22,2021, and the lowest was 7 KTS/Deg on December 11,2020, as shown in Fig. 2(f).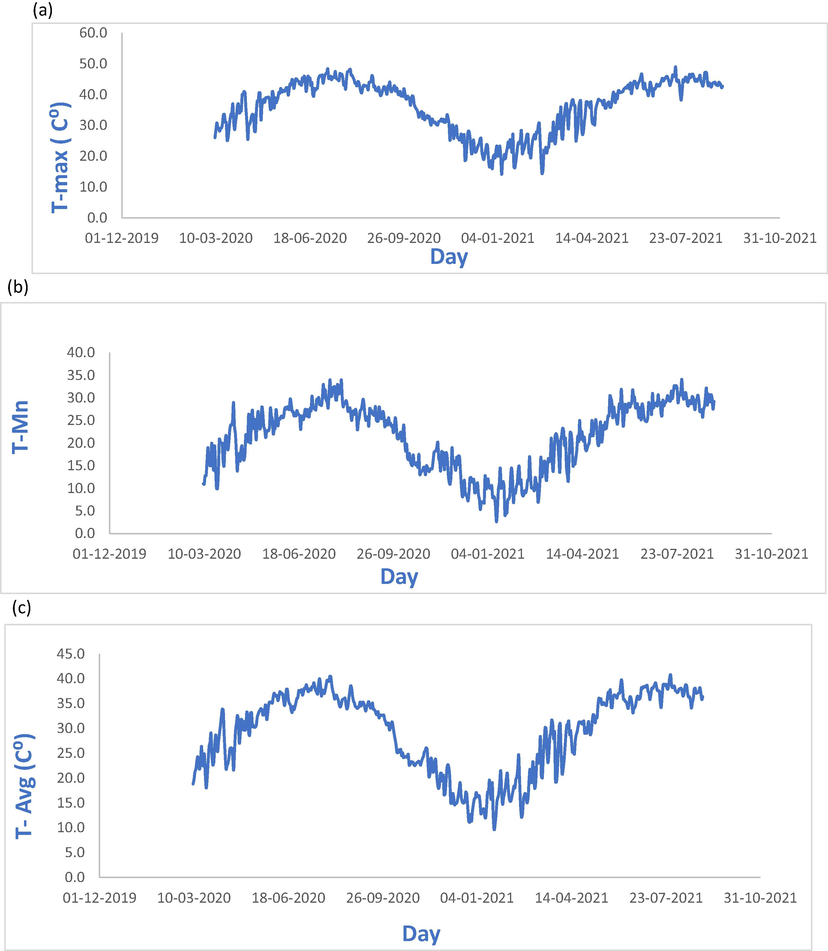
(a) maximum temperatures(°C), (b) minimum temperatures(°C), (c) average temperatures(°C), (d) cases of COVID-19 in Riyadh, (e) rainfall (mm), (f) wind speed (KTS/Deg), and (g) relative humidity (%) in Riyadh region (KSA) from March 3, 2020 - August 31, 2021.
(a) maximum temperatures(°C), (b) minimum temperatures(°C), (c) average temperatures(°C), (d) cases of COVID-19 in Riyadh, (e) rainfall (mm), (f) wind speed (KTS/Deg), and (g) relative humidity (%) in Riyadh region (KSA) from March 3, 2020 - August 31, 2021.
Based on Table. 1, average temperatures, minimum temperatures, and maximum temperatures were correlates strongly with COVID-19 (r = 0.527; 0.509; 0.530 respectively; p < 0.001). A negative correlation was found with relative humidity, r = -0.475 which is indicate that when the number of cases increase the relative humidity decrease and vice versa. Correlations are not significant between wind speed or rainfall and COVID-19. In this study Covid-19 was correlated only with the lowest and the highest temperature 2.6 °C and 49 °C respectively, and the rate of changing in humidity degrees. Weather transmission has previously been linked to both Respiration Syncytial Virus (RSV) (Vandini et al., 2013) and SARS (Tan et al., 2005). SARS transmission is influenced by temperature, wind speed, and relative humidity according to the regression equation (Yuan et al., 2006). Furthermore, covid-19 outbreaks in China have been linked to temperature (Shi et al., 2020).
Climate Variables
Spearman-Rank correlation coefficient
Temperature maximum
0.530
Temperature minimum
0.509
Temperature average
0.527
Relative Humidity
−0.475
Wind Speed
−0.071
Rainfall
0.187
Saudi Arabia's capital city, Riyadh, is home to nearly 8 million people according to the General Authority for Statistics, the population expected to exceed 8.3 million by 2030. The population in Riyadh’s is 23 % of the total population in the whole country 35,013,414 million people (General authority for statistics, 2021). Many cases are caused by a high rate of mobility among residents in Riyadh, in addition to the temperature changes. Riyadh's population density is very high and this a good environment to allow covid-19 transmitted very fast. Another reason most of the population comes from outside the city of Riyadh, and generally they choose the area for its quality of jobs when choosing a place to live.
R values are significantly affected by relative humidity and temperature, according to Wang et al. (2020a). Humidity and temperature are strongly and consistently correlated with the seasonal distribution of respiratory viruses (Sajadi et al., 2020). According to Chen et al., 2020 have shown that weather variables can have high correlations (r2 greater than 0.6) with real disease incidence from Ministry of Health in KSA (sehhty, 2021).
Several studies have found that outbreaks and weather are correlated, and when the weather becomes warmer, outbreaks are suppressed (Guo et al., n.d.). Visibility, wind speed and humidity can affect virus viability and stability. Air temperature also plays a role in spreading the epidemic. Ma et al., 2020 found that humidity and air temperature have a significant impact on covid-19 survival. In this study, they found that increasing diurnal temperature was associated with an increase in COVID-19 deaths, whereas increasing humidity was associated with a decrease in COVID-19 deaths.
Climate latitude and temperature are related to Covid-19 distribution (Poole, 2020). The study also included that the seasonal temperature variation may be primarily caused by atmospheric radiation, which is also a primary cause of apparent seasonal variation in COVID-19. Since solar radiation on the planet is proportional to latitude for a given date, the amount of solar radiation experienced at a given location depends largely on the daily solar radiation budget, which is the primary factor influencing temperature and seasonal thermal variability. According to this study, a common, shared driver of solar radiative bombardment could explain the correlation between temperature and virus communicability. Through reflection and scattering, clouds dramatically reduce the amount of solar radiation reaching the surface. Increasing humidity is caused by clouds reflecting and scattering solar radiation, reducing the amount that reaches the surface.
Even though this study has significant findings about the weather in covid-19, it still has limitations. Due to the virus that causes the illness, several factors must be examined, including virus resistance, migration patterns, and population endurance. In addition to evaluating factors related to personal health, such as handwashing habits, personal hygiene, and hand sanitizer, it is important to examine factors related to personal hygiene.
4 Conclusion
Covid-19 incidence rates in Riyadh are correlated with average temperatures, minimum temperatures, maximum temperatures, and relative humidity which proves that the weather is a significant factor. Understanding the impact of environmental parameters on COVID-19 spread will be enhanced by this research. Information and education about virus transmission in different natural environments will be provided to the public and decision makers. Therefore, it will be easier for decision makers to optimize their prevention and intervention strategies if they have a better understanding of the factors controlling COVID-19′s spread. These findings will be used as lessons learned as well as best practices in the future.
Funding information
I acknowledge the Deanship of Scientific Research (DSR), King Abdulaziz University, Jeddah.
Acknowledgment
This work was funded by the Deanship of Scientific Research (DSR), King Abdulaziz University) KAU, Jeddah, Saudi Arabia has funded this Project under grant no (G:103-135-1443). Therefore, I acknowledge with thanks DSR technical and financial support.
Declaration of Competing Interest
The authors declare the following financial interests/personal relationships which may be considered as potential competing interests: Othman A. Fallatah reports financial support was provided by King Abdulaziz University.
References
- Current Status of Epidemiology, Diagnosis, Therapeutics, and Vaccines for Novel Coronavirus Disease 2019 (COVID-19) J. Microbiol. Biotechnol.. 2020;30:313-324.
- [CrossRef] [Google Scholar]
- CDC, 2020. https://www.cdc.gov/coronavirus/2019-ncov/cases-updates/cases-in-us.html. Accessed 21 Nov 2021.
- National Center for Metrology. Available at https://ncm.gov.sa/ar/Pages/default.aspx. Accessed 2 Nov 2021.
- A familial cluster of pneumonia associated with the 2019 novel coronavirus indicating person-to-person transmission: a study of a family cluster. Lancet. 2020;395:514-523.
- [CrossRef] [Google Scholar]
- Chen B, Liang H, Yuan X, Hu Y, Xu M, Zhao Y, et al. Roles of meteorological conditions in COVID-19 transmission on a worldwide scale. medRxiv 2020.
- Corona-V, 2021. https://corona-v.com/. Accessed 21 Nov 2021.
- Urbanization and humidity shape the intensity of influenza epidemics in US cities. Science. 2018;362(6410):75-79.
- [Google Scholar]
- Guo, X.-J., Zhang, H., Zeng, Y.-P. Transmissibility of COVID-19 and its Association with Temperature and Humidity.
- Clinical features of patients infected with 2019 novel coronavirus in Wuhan, China. Lancet. 2020;395:497-506.
- [CrossRef] [Google Scholar]
- Effects of temperature variation and humidity on the death of COVID-19 in Wuhan. China. Sci. Total Environ.. 2020;724:138226
- [CrossRef] [Google Scholar]
- Onder, G., Rezza, G., Brusaferro, S., 2020. Case-Fatality Rate and Characteristics of Patients Dying in Relation to COVID-19 in Italy. JAMA - J. Am. Med. Assoc. https://doi.org/10.1001/jama.2020.4683.
- Poole, L., 2020. Seasonal Influences on the Spread of SARS-CoV-2 (COVID19), Causality, and Forecastabililty (3-15-2020). Causality, and Forecastabililty (3-15-2020). (March 15, 2020).
- An analysis of climatic variables for thermal design of buildings in Khamis Mushayt, Saudi Arabia. Build. Environ.. 1991;26:363-369.
- [CrossRef] [Google Scholar]
- Development of comfort zone charts using the isopleth chart technique. Build. Environ.. 1994;29:13-20.
- [CrossRef] [Google Scholar]
- Sajadi, M.M., Habibzadeh, P., Vintzileos, A., Shokouhi, S., Miralles-Wilhelm, F., Amoroso, A., 2020. Temperature and Latitude Analysis to Predict Potential Spread and Seasonality for COVID-19. Available at SSRN 3550308.
- Sehhty is a direct statistic of Corona cases and the world directly. Retrieved November 20, 2022, from https://sehhty.com/en/.
- Shi, P., Dong, Y., Yan, H., Li, X., Zhao, C., Liu, W., et al., 2020. The Impact of Temperature and Absolute Humidity on the Coronavirus Disease 2019 (COVID-19) Outbreak-Evidence from China. medRxiv.
- An initial investigation of the association between the SARS outbreak and weather: with the view of the environmental temperature and its variation. J. Epidemiol. Community Health. 2005;59:186-192.
- [Google Scholar]
- Correlation between weather and Covid-19 pandemic in Jakarta. Indonesia. Sci. Total Environ.. 2020;725:138436
- [CrossRef] [Google Scholar]
- Asymmetric Relationship between Ambient Air Temperature and Incidence of COVID-19 in the Human Population. Am J Trop Med Hyg.. 2022 Jan 28;106(3):877-885. PMID: 35090138; PMCID: PMC8922505
- [CrossRef] [Google Scholar]
- Respiratory syncytial virus infection in infants and correlation with meteorological factors and air pollutants. Ital. J. Pediatr.. 2013;39(1):1.
- [Google Scholar]
- Wang, M., Jiang, A., Gong, L., Luo, L., Guo, W., Li, Chuyi, Zheng, J., Li, Chaoyong, Yang, B., Zeng, J., Chen, Y., Zheng, K., Li, H., 2020. Temperature significant change COVID-19 Transmission in 429 cities. medRxiv 2020.02.22.20025791. https://doi.org/10.1101/2020.02.22.20025791.
- Clinical Characteristics of 138 Hospitalized Patients with 2019 Novel Coronavirus-Infected Pneumonia in Wuhan, China. JAMA - J. Am. Med. Assoc.. 2020;323:1061-1069.
- [CrossRef] [Google Scholar]
- Worldometer - real time world statistics. (n.d.). Worldometer. Retrieved November 20, 2022, from http://www.worldometers.info/.
- A new coronavirus associated with human respiratory disease in China. Nature. 2020;579:265-269.
- [CrossRef] [Google Scholar]
- Association between ambient temperature and COVID-19 infection in 122 cities from China. Sci. Total Environ.. 2020;724:138201
- [CrossRef] [Google Scholar]
- A climatologic investigation of the SARS-CoV outbreak in Beijing. China. Am. J. Infect. Control. 2006;34:234-236.
- [Google Scholar]
Appendix A
Supplementary material
Supplementary data to this article can be found online at https://doi.org/10.1016/j.jksus.2022.102465.
Appendix A
Supplementary material
The following are the Supplementary data to this article:


