

Translate this page into:
Histopathological changes and expression of transforming growth factor beta (TGF-β3) in mice exposed to gliotoxin
⁎Corresponding author. batoolomran@yahoo.com (Batol Imran Dheeb) batolimrandheeb@yahoo.com (Batol Imran Dheeb)
-
Received: ,
Accepted: ,
This article was originally published by Elsevier and was migrated to Scientific Scholar after the change of Publisher.
Peer review under responsibility of King Saud University.
Abstract
Background
Gliotoxin (GT) is the prototype of a class of epipolythiodioxopiperazines (ETPs) which are secondary metabolites made by fungi organisms only e.g., Aspergillus fumigatus, characterized by a disulfide bridge across a piperazine ring with low molecular weight (326 Da),and its sulphur bridge imparts all known toxicity of these molecules. Its name was derived from its identification as a metabolite of Gliocladium fimbriatum as it is previously isolated. It had histopathological effects of human and animals tissues and thus may alter the immune response.
Objectives
The current study aimed to evaluate the effect of GT on immunological and histological changes in lung, liver, and kidney in addition to morphological changes in colon using animal models.
Methodology
Mature male BALB/c mice were used in this study, animals were provided by Biotechnology researches center of Al-Nahrain University. To study the histological changes and expression of Transforming growth factor beta (TGF-β3) in mice, animals were injected intraperitoneally (i.p.) with acute dose of both sample and standard gliotoxin with control group (received i.p. one dose of methanol 10%) and the mice of each group were sacrificed at day seven, each mouse was dissected and the organs lung, liver and kidney were collected then sectioned. Mice of another groups were administrated with one dose of sample gliotoxin through the lumen of the colon using a vinyl catheter positioned 5 cm from the anus, and the control group received methanol 10%, the mice were killed on day seven of administration to study the morphological changes in the colon.
Results
Gross-examination showed clear pathological changes in examined organs of mice treated intraperitoneally with gliotoxin (i.p.) injection during seven days, lesions were seen in examined organs with groups of all concentrations of both sample and standard gliotoxin in comparing with control. After intrarectal administration, many signs for mycotoxicosis were observed, like shivering, redness around the anus and bristling of hair. Although of the aggressive behavior of mice and loss of activity at the day 6 of treatment was also reduced. In both sample and standard GT groups, the elevation at the high concentrations of the gliotoxin gave over TGF-β3 expression in liver, lung, and kidney.
Conclusions
It can be concluded that both of sample and standard gliotoxin showed the same effectiveness in vivo to induce histopathological changes and the immunohistochemical studies revealed that the increasing of TGF-β3 expression was in a significant relationship between the immunoreactive cell and its intensity with number and size of lesion in the same tissue at probability (P value) < 0.05 level, so further investigations are required to evaluate the acute and /or chronic effect of gliotoxin on other cytokines and further histopathological studies of acute and/or chronic effect of gliotoxin on other organs such as muscles, heart, brain, spleen and intestine are required.
Keywords
Gliotoxin
Histopathological effect
TGF-β3
Immunohistochemical technique

1 Introduction
Fungi and their mycotoxins are ubiquitous in the environment and, once produced, these contaminants are adsorbed onto airborne dusts, leading to major public health issues (Eshetu et al., 2016). Gliotoxin can enter into the food chain, leading to adverse effects on animal and human health at low concentrations (Bossouet al., 2017). It had many histopathological effects of human and animals cells and tissues such as brain (Bertossi et al., 2003), colon (Pan and Harday, 2007) and apoptotic Hepatic non-parenchymal cells (NPCs) (Nejak-Bowen et al., 2013) and capable of inhibiting function and inducing apoptotic cell death in macrophages and thus may alter the immune response (Sondhauss, 2014). Many of previous studies in histopathological effect of gliotoxin were performed with the producer of this mycotoxin (Banderet al., 2015). The mold Aspergillus fumigatus (Al Hizab, 2014; Abdulrahman et al., 2014).
TGF-β was originally named because of its ability to stimulate fibroblast growth in soft agar; but it can also serve as a potent inhibitor of epithelial cell proliferation and macrophage (Xavier et al., 2008). TGF-β3 was isolated from a cDNA library of human rhabdomyosarcoma cell line (Kubiczkova et al., 2012; Al-Tekreeti et al., 2017); it is virtually secreted by all type of cells and has overlapping receptor usage (Massague, 1998). The essential function of TGF-β3 in normal palate and lung morphogenesis and implicated in epithelial-mesenchymal interaction and its mRNA is present in lung adenocarcinoma and kidney carcinoma cell lines (Dheebet al., 2016). Interestingly umbilical cord expresses the very high level of TGF-β3 (Kubiczkovaet al., 2012). TGF-β3 signaling controls a diverse set of functions mainly those related to cell proliferation, development, differentiation, adult hemostasis and disease (Massague, 1998). TGF-β3 also plays an essential role in controlling the development of lungs in mammals by regulating cell adhesion and Extracellular matrix (ECM) formation; Lung tissue is one of the tissues that express TGF-β3 insignificant levels (Bandyopadhyayet al., 2006). Therefore, this study aimed to evaluate the effect of gliotoxin on histopathological effects in lung, liver, and kidney and immunological changes using immunohistochemistry IHC technique.
2 Methodology
2.1 Gliotoxin preparation
-
Standard gliotoxin
Stock solution of gliotoxin was prepared with concentration 1 mg ml−1 by dissolving 5 mg of the gliotoxin standard (Sigma-Aldrich, Germany) in 5 ml of absolute methanol, and stored at −70 °C in the deep freeze (Nouri et al., 2014).
-
B.
Sample gliotoxin
Gliotoxin extraction from its producing Aspergillus fumigatus isolate was achieved: The isolate of A. fumigatus was grown on Sabouraud Dextrose Agar slant for 2 days at 37 °C and the conidia were then harvested with sterile saline with 0.1% polysorbate 80 (Tween® 80), then adjusted to a concentration of 107 conidia/mL in distilled water based on haemocytometer counts. 2 ml volumes of this conidial suspension were used to inoculate 100 ml of liquid medium Yeast Extract Sucrose in 250 ml flasks. The culture was incubated at 32 °C for 15 days; flask was shaken manually at least twice a day. After the incubation time, the biomass was extracted with 50 ml of chloroform and cut up in small pieces with the electric homogenizer at 3.500 rpm for 10 min. The biomass and the culture fluid was then filtered by Whatman No.1 filter paper in separate Buchner funnels and extracted with 50 ml of chloroform, and filtered through anhydrous Sodium Sulphate. Chloroform fraction was collected and evaporated to dryness in the petri dish at 60 °C in the dark cabinet using the electric dryer. Dried extracts were dissolved in 500 μL chloroform and stored in tightly wrapped vial at +4 °C until gliotoxin was analyzed (Hussain et al., 2017).
The detection of sample gliotoxin was performed by High Performance Liquid Chromatography (HPLC) analysis using standard curve of the pure compound in comparison with standard gliotoxin which was dissolved in the mobile phase as conducted to determine retention time RT and relative peak area. A standard curve of the relationship of peak area quantity (µg) injected was constructed and used for sample concentration of gliotoxin (Kupfahl et al., 2007).
2.2 Animal models
Mature male BALB/c mice, weighted (21.6–22.28) gram were used in this study. Animals were isolated in a relatively controlled environment at a temperature of about 25 °C, in the animal house of Biotechnology researches center of Al-Nahrain University. The animals were housed and fed with suitable diet to grow maintenance.
2.3 Experimental design
The concentration of acute toxic effects of the sample and standard GT were170.5, 341 and 682 µg kg−1 body weight (125, 250 and 500 µg mL−1) of each one according to the determinate median lethal dose LD50as follows: Thirty six mice were divided into six groups, each group intraperitoneally injected with different concentration of GT as follows: 1000 µg/ml, 900 µg/ml, 750 µg/ml, 600 µg/ml, 500 µg/ml and control group (treated with10%methanol). After 24 hrs, all treated mice were examined to determine the concentration which killed half of animals and was considered as median lethal dose (LD50). To Determine LD50 for mice treated with sample gliotoxin, thirty mice were used and divided to five groups. However Table 1 show LD50 determination (Makun et al., 2010).
Groups
Standard gliotoxin
Sample gliotoxin
Concentration
(µgml−1)No. of mice
No. of dead mice
after 24 hrs.Percentage of death %
Concentration
(µg ml−1)No. of mice
No. of dead mice
after 24 hrs.Percentage of death %
1
1000
6
6
100
1000
6
6
100
2
900
6
5
83.3
900
6
4
66.7
3
750
6
3
50
750
6
3
50
4
600
6
1
16.7
600
6
0
0
5
500
6
0
0
500
6
0
0
Control
0.0
6
0
0
0.0
6
0
0
To study the histopathological and immunological effect of GT on mice, twenty- one of male albino BALB/c mice were randomly divided in to seven groups (3 mice for each group); Three groups received one dose of sample GT intraperitoneally (30 µL) at the various concentrations of 500, 250 and 125 µg mL−1 (682, 341 and 170.5 µg kg−1 mouse) and three groups received the same dose and concentrations of standard gliotoxin. Group seven (control) receive done dose intraperitoneally of methanol 10% as a solvent instead of the gliotoxin solution. All mice were sacrificed at the day seven.
To study the acute effects of gliotoxin on mice colon, three groups of mice (3 mice per group) were administrated 100 µL of sample gliotoxin with one dose at various concentrations of 500, 250 and 125 µg mL−1 (682, 341 and 170.5 µg kg−1 mouse) through the lumen of the colon using a vinyl catheter positioned 5 cm from the anus. The fourth group (control) received methanol 10%. The mice were killed on day 7 of administration (Dheeb, 2014).
2.4 Histopathological study
After pulling the blood from anesthetized animals, each mouse was dissected. Lungs, livers and kidneys were collected and put in the petri dish containing physiological solution with pH adjusting to 7(prepared according to Benson (2001) by dissolving 8.5 g of NaCl in 1000 ml of sterilized distilled water D.W) to remove adipose and connective tissues. The histopathological preparation was done according to Bancroft and Stevens (1982).
Samples were fixed in 10% formalin for 24 hrs then placed in 70% ethanol overnight and then dehydrated by graded series of alcohol (70%, 90% and 100% ethanol) for two hrs for each concentration. After that, organs samples were cleared in xylene for 2 hrs, embedded in paraffin (with melting point 58 °C) for 2–3 hrs at 60–70 °C in the oven and cut into sections by a microtome 3–4 µm in thickness.
Tissue sections were fixed on slides by using Mayer's albumin and left to dry in the oven at 37 °C for 1–2 hrs. Tissue section on slides was dewaxed by Xylene, and washed shortly in 3 changes of absolute alcohol, then 95% and 70% alcohol. After washed in water for 5 min, slides were stained with Hematoxylin and Eosin for 10–15 sec and washed in water for 2–3 min, dipped in acid alcohol for 1%. The sections were then dehydrated in (70, 80 and 95%) alcohol, few sec for each and 2 changes of absolute alcohol, the slides were left to dry. Finally slides were put in xylene 15–30 min, and cover slipped with Distyrene-Plasticizer-Xylene DPX. Histological analysis was performed using light microscope equipped with a digital camera and digital imaging computer software.
2.5 Estimation of TGF-β3usingthe immunohistochemical technique
For immunohistochemical (IHC) evaluations of affected liver, kidney and lung, the sections were deparaffinized in the hot air incubator at 80 °C for 70 min using adhesion microscope positively charged slides and then rehydrated in graded alcohols. Backed slides were immersed sequentially at room temperature for the indicated times in the following solutions: Xylene for 30 min, Fresh xylene for 30 min, absolute ethanol for 5 min, 90% ethanol for 5 min, 70% ethanol for 5 min, 50% ethanol for 5 min and distilled water for 5 min. These sections were subjected to IHC evaluations using polyclonal anti-TGF-β3 antibody (Abcam, 2013). The slides were cooled for 20 min at room temperature, and then the edges surrounding the sections were marked by a liquid blocker pap pen to avoid the distribution of the materials out of the sections during the run of the IHC staining. Then, the slides were transferred quickly to the stainer racks to avoid drying of samples. Enough drops of Hydrogen Peroxide were added and blocked to cover the sections then incubated for 10 min and washed two times in the buffer then 20 µL of Protein block was applied and incubated for 10 min at room temperature to block nonspecific background staining then washed one time in the buffer 40 μL of primary antibody (anti-TGF-β3) was placed onto the tissue section and incubated for 30 min at 37 °C in a humid chamber. The slides were drained and blotted gently and then transferred to the refrigerator for 24 hrs. After 24 hrs, the slides were placed in washing buffer bath for 5 min, drained and blotted gently, and 20 μL of the secondary antibody (the complement) was applied onto the sections, and the slides were placed in a humid chamber and incubated at 37 °C for 10 min, rinsed and placed in washing buffer bath as before, excess buffer drained and blotted gently. After that, 20 μL of HRP conjugate was placed onto each tissue section and incubated for 15 min at 37 °C in a humid chamber; the slides were placed in washing buffer bath for 5 min, drained and blotted gently.
DAB Chromogen was added to DAB Substrate (one drop to 50 drops) then mixed by swirling, and then applied to the tissue and incubated for 1–10 min, then rinsed 4 times in buffer. The slides were immersed in a bath of Mayer's Hematoxylin for 1 min and washed three times in distilled water, 1 min each; then drained and blotted gently and dehydrated by placing the prepared slides in the following solutions: 50% ethanol for 5 min, 70% ethanol for 5 min, 90% ethanol for 5 min, absolute ethanol for 5 min, xylene for 5 min and fresh Xylene for 5 min. Finally, a drop of DPX was applied to the xylene wet sections and covered with cover slips gently to remove excess and air bubbles then left to dry overnight (Abcam, 2013).
2.6 Evaluation of immunostaining for TGF-β expression
The expression of TGF-β protein was measured by counting the number of positive cells with brown (DAB) cytoplasmic staining under light microscopy 40X. For the evaluation of TGF-βexpression, immunostaining was assessed semi quantitatively using a scoring system for both intensity and the extent of staining as shown in Table 2 (Hussain, 2010).
TGF-β
Score
Intensity
Stained cells (%)
Negative
0
No staining
<10
Positive
1
Weak
10–30
2
Moderate
31–50
3
Strong
>50
3 Results
Histological examination of the liver section from control mice showed normal architecture of hepatocytes and central vein (Fig. 1a). While, histopathological examination of liver from the mouse treated with 125 µg mL−1 of sample GT showed granulomatous lesion consisting from aggregation of kupffer cells and lymphocytes (Fig. 1b), another section shows expression of cells division with dark chromatin of hepatocytes or disappear of their nuclei. Necrotic area in their parenchyma was also observed. While, the animal treated with 125 µg mL−1 of standard GT expressed proliferation of kupffer cells (Fig. 1c). The main lesions in the liver treated with 250 µg mL−1 of sample GT consisting of multiple granuloma (Fig. 1d), other sections showed proliferation of kupffer cells and necrotic hepatocyte characterized by pyknotic nuclei. A granulomatous lesion was shown in the liver of animal treated with 250 µg mL−1 of standard GT (Fig. 1e) and another section showed the proliferation of kupffer cells. Using 500 µg mL−1 of sample GT resulted in aggregation of mononuclear cells in liver parenchyma and necrosis of hepatocytes (Fig. 1f). Other field showed divided cell, proliferation of kupffer cells and vacuolar degeneration (data not shown). The liver of 500 µg mL−1 of standard GT revealed inflammatory cells infiltration particularly mononuclear cells in their capsular region (Fig. 1g) In addition, granulomatous lesion, vacuolar degeneration, mononuclear cells and megakaryocytes in sinusoids with proliferation of kupffer cells as well as mild fatty changes were also noted (data not shown). In lung: Histological examination of the control lung showed the normal structure of alveoli and normal lung tissue (Fig. 2a). Histopathological examination of mouse lung treated with 125 µgm L−1 of sample gliotoxin revealed mononuclear cells infiltration in the interstitial tissue and in the alveolar spaces (Fig. 2b). While, treatment with 125 µg mL−1 standard GT showed the increased thickness of interalveolar septa due to congested capillaries with mononuclear cells infiltration (Fig. 2c). The lung of animal treated with 250 µg mL−1 sample GT showed fibrin networks, inflammatory cells particularly neutrophils and mononuclear cells in alveolar spaces (Fig. 2d), in dilated blood vessels and in the inter alveolar septa was also observed. In addition to emphysema (data not shown). While, the main lesions in the lung of animal treated with 250 µg mL−1 of standard GT showed inflammatory cells infiltration in the interalveolar septa and in the alveolar spaces (Fig. 2e) with congested blood vessels. The lung of the mouse treated with 500 µg mL−1 of sample GT expressed inflammatory cells in dilated congested blood vessels with mononuclear cells infiltration in the interalveolar septa (Fig. 2f). While, the lesions in animal treated with 500 µg mL−1 of standard GT expressed hemorrhage in the pleura with increasing thickness of interalveolar septa due to mononuclear cells infiltration (Fig. 2g).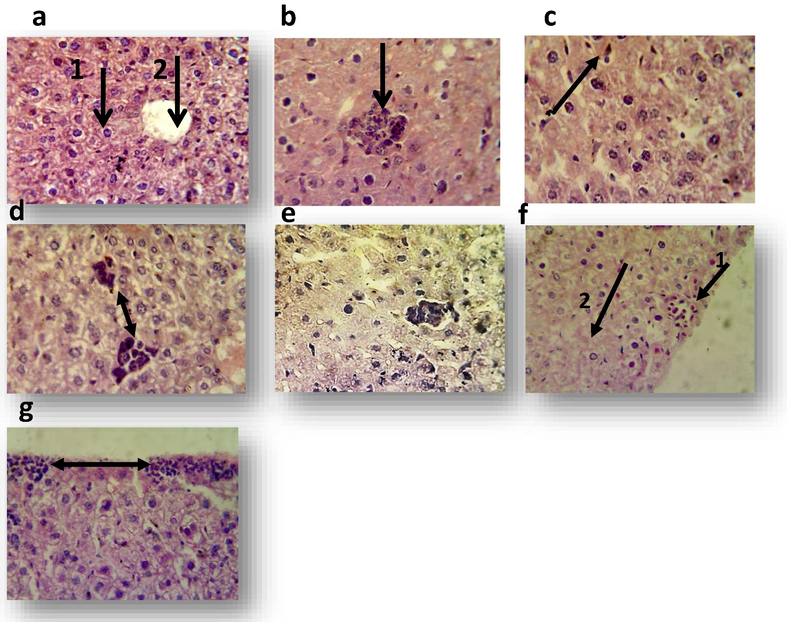
Liver sections of albino mice treated with one dose of methanol 10%(control), sample gliotoxin and standard gliotoxin for 7 days (H&E stain40X). a: liver section of control albino mouse shows normal hepatocyte 1 and central vein 2, b: liver section of mouse treated with 125 µg mL−1 of sample gliotoxin shows granulomatous lesion consist of aggregation of kupffer cells and lymphocytes c: liver section of mouse treated with 125 µg mL−1 of standard gliotoxin shows proliferation of kupffer cells, d: liver section of mouse treated with 250 µg mL−1 of sample shows multiple granulomas, e: liver section of mouse treated with 250 µg mL−1 of standard gliotoxin shows granulomatous lesion 1 with proliferation of kupffer cells2, f: liver section of mouse treated with 500 µg mL−1of sample gliotoxin shows aggregation of mononuclear cells 1 and necrosis 2, g:liver section of mouse treated with 500 µg mL−1 of standard gliotoxin shows mononuclear cells infiltration in their capsular region.
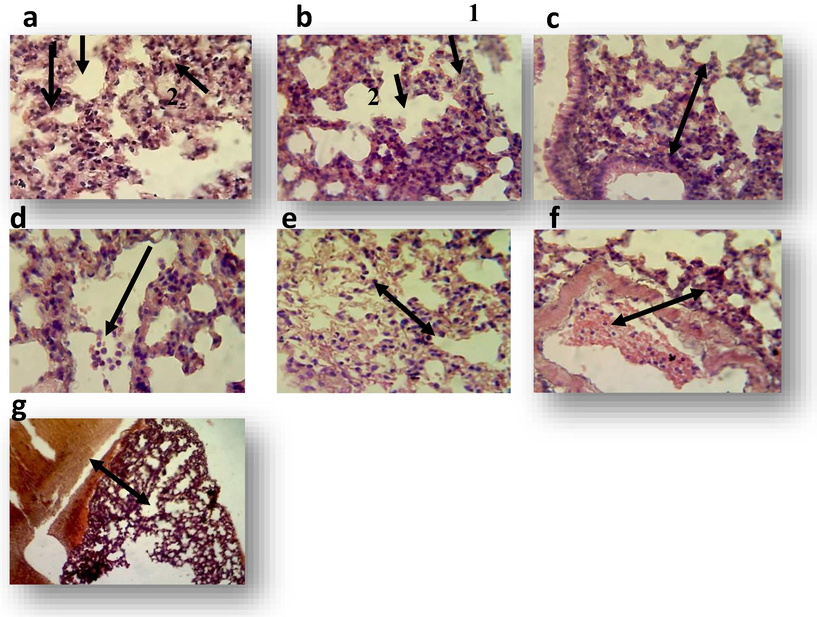
Lung sections of albino mouse treated with one dose of methanol 10% (control), sample gliotoxin and standard gliotoxin for 7 days (H&E stain40X). a: transverse section of lung control albino mouse shows normal structure of alveoli and the alveoli wall 1 and normal lung tissue2; b: lung section of mouse treated with 125 µg mL−1 of sample gliotoxin shows mononuclear cells infiltration in the interstitial tissue 1 and in the alveolar spaces 2, c: lung section of mouse treated with 125 µg mL−1 of standard gliotoxin shows increase thickness of interalveolar septa, d: lung section of mouse treated with 250 µg mL−1 of sample shows neutrophils and mononuclear cells in the interalveolar septa, e: lung section of mouse treated with 250 µg mL−1 of standard gliotoxin shows neutrophils and mononuclear cells infiltration in the interalveolar septa and in alveolar spaces, f: lung section of mouse treated with 500 µg mL−1 of sample gliotoxin shows inflammatory cells in dilated congested blood vessels with mononuclear cells infiltration in the interalveolar septa, g: Section in the lung o lung section of mouse treated with 500 µg mL−1 of standard gliotoxin shows hemorrhage in the pleura with increase thickness of interalveolar septa.
3.1 The effect in Kidney
Kidney section of control mice showed normal renal tubules and normal glomerulii (Fig. 3a). Histopathological sections of the kidney in treated mice with 125 µg mL−1 of sample GT revealed marked cloudy swelling of epithelial cells lead to narrowing or occlusion of renal tubules lumen (Fig. 3b). While the kidney of treated animals with 125 µg mL−1 of standard GT showed acute cellular degeneration of epithelial lining cells of renal tubules with hyaline casts in their lumen (Fig. 3c). In mouse treated with 250 µg mL−1 of sample GT, the kidney also expressed marked cloudy swelling of epithelial cells of renal tubules with hyaline casts in their lumen (Fig. 3d). While in animal treated with 250 µg mL−1 of standard GT, the kidney expressed marked cloudy swelling of epithelial cells lead to narrowing or occlusion of renal tubules with hyaline casts in the lumen of renal tubules (Fig. 3e).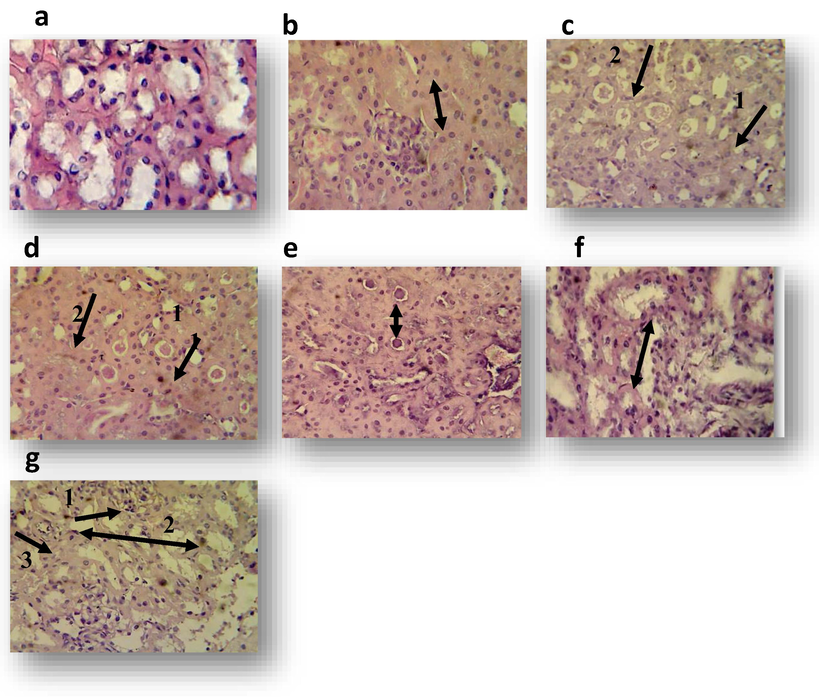
Transverse section of kidney of albino mouse treated with one dose of methanol 10% (control), sample gliotoxin and standard gliotoxin for 7 days (H&E stain40X) a: kidney section of control albino mouse shows normal glomeruli, b: kidney section of mouse treated with 125 µg mL−1 of sample gliotoxin shows marked cloudy swelling of epithelial cells c: kidney section of mouse treated with 125 µg mL−1 of standard gliotoxin shows acute cellular degeneration of epithelial cells lining of renal tubules 1 with hyaline casts in their lumen 2, d: Section in the kidney of mouse treated with 250 µg mL−1 of sample shows marked cloudy swelling of epithelial cells of renal tubules with hyaline casts in their lumen, e: kidney section of mouse treated with 250 µg mL−1 of standard gliotoxin shows marked cloudy swelling of epithelial cells and narrowing or occlusion of renal tubules, f: kidney section of mouse treated with 500 µg mL−1 of sample gliotoxin shows acute cellular degeneration characterized by vacuolation or sloughing of epithelial cells of renal tubules, g:kidney section of mouse treated with 500 µg mL−1 of standard gliotoxin shows 1, Hypercellularity of glomerular tuft 2, vacuolation of epithelial cells and cystic dilatation of renal tubules with necrosis 3.
The histopathological section in the kidney of the mouse treated with 500 µg mL−1 of sample GT showed acute cellular degeneration characterized by vacuolation or sloughing of epithelial cells of renal tubules (Fig. 3f). Hypercellularity of glomerular tuft with marked vacuolation of epithelial cells and cystic dilatation of renal tubules were recorded in the kidney of animal treated with 500 µg mL−1 of standard GT (Fig. 3g).
3.2. Influence of rectal administration dosage of gliotoxin in some proprieties of mouse colon
After intrarectal administration with one dose of different concentrations of sample GT and with10% Methanol alone as control, many signs for mycotoxicosis were observed, like shivering, redness around the anus and bristling of hair. Mice were killed on day seventh and the macroscopic analysis was monitored in mouse colon. The morphological features appeared as the inflammatory response with congestion at concentration 500 µg/ml as compared with control (Fig. 4).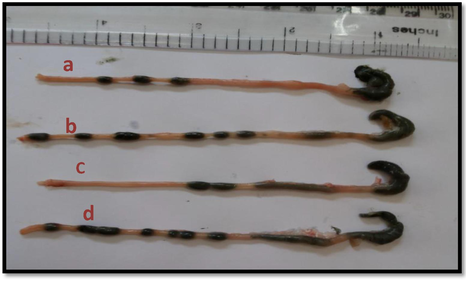
Effect of sample gliotoxin on mouse rectum under different concentrations: a: 500 µg mL−1, b: 250 µg mL−1, c: 125 µg mL−1, d: Control (10% methanol).
3.3 Immunohistopathological study
The histopathological examinations were extended further but in terms of Immunohistochemical elevation for the expression of some immunological markers. However, the relationship between the produced GT by A. fumigatus and these markers are not well demonstrated in Iraq. In this study, we used immunohistochemistry technique which is the best detective tool to determinate the degree of GT effect in immune response. So we evaluate the level of TGF-β3 in liver, lung and kidney tissue section after 7 days of mice treatment with GT. Immunohistochemical signal specificity was demonstrated by the absence of immunostaining in the negative control slides and its presence in recommended positive controls. By applying IHC procedure, the studied parameter was scored and considered as categorical data thus they presented as count and percentage. The level of significance was 0.05. Positive TGF-β3immunostaining was detected as brown staining of the cell (DAB produce brown staining and counterstained by hematoxylin). Positive IHC expression was found in all tissue sections as illustrated in both sample and standard GT groups, the high concentrations of the mycotoxin resulted in over expression of TGF-β3 in liver. In lung, the expression of TGF-β3decreased at 250 µg mL−1 then increased with the higher GT concentration. While in kidney highest expression of TGF-β3was at 250 µg mL−1. The distribution of TGF-β3in the liver of control and mice treated with 125, 250 and 500 µg mL−1 of sample and standard GT was shown in Fig. 5. The distribution of TGF-β3 in the lung control and mice treated with 125, 250, 500 µg mL−1 of the sample and standard GT was shown in Fig. 6.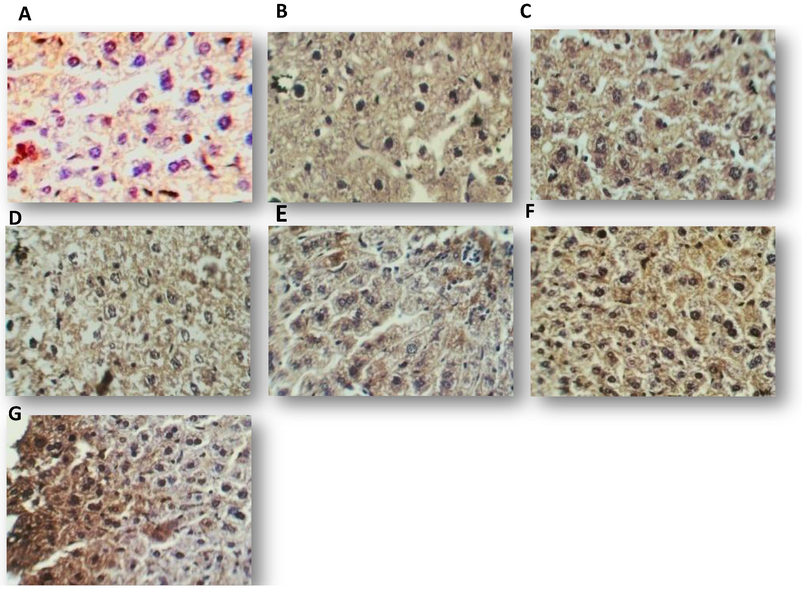
Distribution of TGF-β3 in liver of mice treated for 7 days with one dose of: methanol 10% (A), 125 µg mL−1 of sample gliotoxin (B), 125 µg mL−1 of standard gliotoxin (C), 250 µg mL−1 of sample gliotoxin (D), 250 µg mL−1 of standard gliotoxin (E), 500 µg mL−1 of sample gliotoxin (F), 5000 µg mL−1 of standard gliotoxin (G), DAB staining (brown), counter stained by hematoxylin (40X).
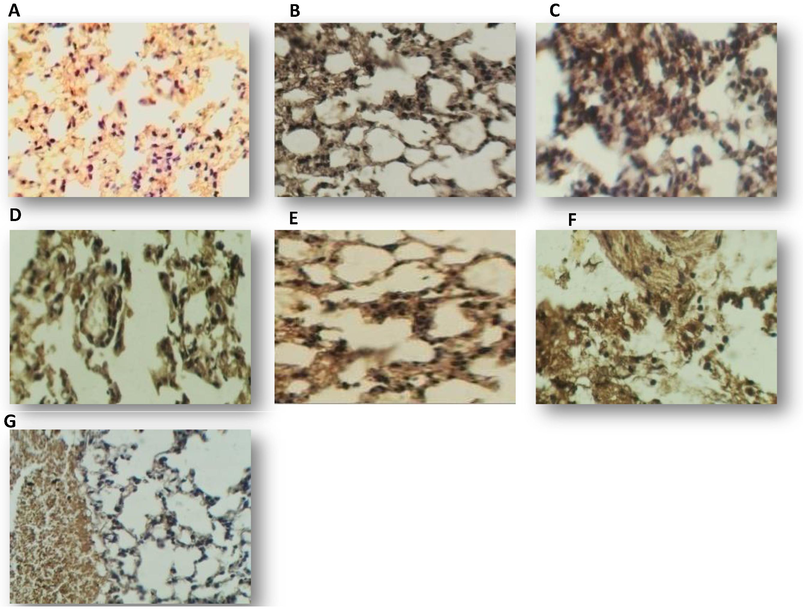
Distribution of TGF-β3 in lung of mice treated for 7 days with one dose of (A): methanol 10% (A), 125 µg mL−1 of sample gliotoxin (B), 125 µgmL−1 of standard gliotoxin (C), 250 µg mL−1 of sample gliotoxin (D), 250 µg mL−1 of standard gliotoxin (E), 500 µg mL−1 of sample gliotoxin (F), 5000 µg mL−1 of standard gliotoxin (G), DAB staining (brown), counter stained by hematoxylin (40X).
Mice included in this study were suffering from histopathological symptoms caused by GT. Positive IHC expression was found in all tissues as illustrated, the results showed increased TGF-β3 expression in all three tissues with similar results in both sample and standard GT (Fig. 7) .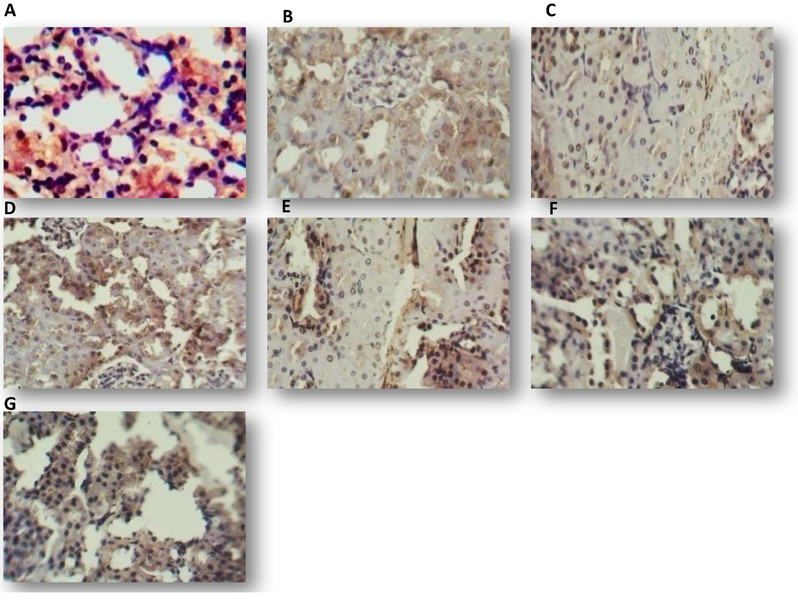
Distribution of TGF-β3 in kidney of mice treated for 7 days with one dose of: methanol 10% (A), 125 µg mL−1 of sample gliotoxin (B), 125 µg mL−1 of standard gliotoxin (C), 250 µg mL−1 of sample gliotoxin (D), 250 µg mL−1 of standard gliotoxin (E), 500 µg mL−1 of sample gliotoxin (F), 5000 µg mL−1 of standard gliotoxin (G), DAB staining (brown), counter stained by hematoxylin (40X).
4 Discussion
Pathogenicity of GT to animals was shown in many studies; In rats, Anselmi et al. (2007) studied the effects of GT on Kupffer cells isolated from the normal liver in vitro and in vivo following its administration to CCl4–induced cirrhotic animals. They revealed that GT at 0.3 μM concentration caused apoptosis of cultured Kupffer cells within 1‘hr and longer incubation caused necrosis. This effect was associated with mitochondrial cytochrome c release, caspase-3 activation and ATP depletion, The inhibition of caspase-3 and serine proteases accelerated and augmented gliotoxin-induced cell death via necrosis. In GT-treated rats with 3000 µg kg−1, mitosis was absent, hepatocyte growth factor (HGF) was decreased and apoptotic Hepatic non-parenchymal cells (NPCs) were apparent (Nejak-Bowen et al., 2013; Rassin et al., 2015).
Many studies resulted in the same symptoms in mice injected with A. fumigatus conidia (the main producer of the virulence factor GT); Sugui et al. (2017) found much multifocal bronchopneumonia with necrosis, neutrophilic infiltration, airways filled with necrotic debris and full thickness necrosis of the bronchioles walls when they injected mice with 20 µL of 5 × 10⁶ A. fumigatus conidia (Dheebet al., 2014). They showed that these symptoms were related to proapoptotic events in response to pure GT and this effect may similarly occur in the infected host with A. fumigatus. Shafiq and Al-Joofy (2010)and Dheeb (2014)observed different histological changes in mice after 7 days of intranasal administration of 20 and 25 μL (107conidia/ml−1) of A. fumigatus conidia in tissues of lung included necrosis in lung alveoli with inflammatory cells infiltration severe neutrophil and macrophage infiltrate in the alveolar space with increasing thickness of intra alveolar septa and hemorrhage. Sever hyperaemic, large hemorrhagic areas, homogeneous necrotic areas and granulomatous foci consisted of a large number of neutrophils were seen in histopathological examination of dogs, camels and broiler farms lungs infected with A. fumigatus spores (Cam et al., 2003; Al Hizab, 2014; Abdulrahman et al., 2014; Rassin et al., 2015). The infected camels showed massive areas of hemorrhage (Al Hizab, 2014). Our results indicated that GT production is associated with the ability of A. fumigatus to invade the lungs of animals and this mycotoxin is the significant virulence factor in infections caused by this mold (Shafiq and Al-Joofy, 2010; Dheeb, 2014). Bugli et al. (2014) showed that the presence of fungal hyphae in clinical specimens of human lung strongly indicates the in vivo A. fumigatus growth as a biofilm and anti gliotoxin T antibodies could be a specific and sensitive diagnostic tool for detecting A. fumigatus biofilm-associated clinical infections. While Sugui et al. (2017) explained that enrichment of GT in Aspergillus infected neutropenic lung correlated with fungal burden and hyphal length.
Aspergillus fumigatus is known to produce several mycotoxins as secondary metabolites, including: Fumitremorgin (Yamazaki et al., 1980), Verruculogen (Dagenais and Keller, 2009), Fumigaclavine (Latif, 2010) helvolic acid, Fumagillin (Fallon et al., 2011), and the best characterized mycotoxin being gliotoxin GT (Sondhauss, 2014). found that the concentration of GT in sputum and serum of A. fumigatus patients was higher than the control group 40-63μgkg−1 and 33–47 μgkg−1in serum. While the concentration in sputum and serum of control group was16-23 and 10–21 μgkg−1, respectively. She revealed that all A. fumigatus isolates (100%) expressed gliz gene (the gene that expresses for GT production). The mechanisms by which GT inhibits the respiratory system that it causes damage to the ciliated respiratory epithelium and inhibits the oxidative burst of human neutrophils in vitro (Nierman and Fedorova, 2008) and by targeting the assembly of the NADPH oxidase complex and affecting an essential site (s) for electron transport in the flavocytochrome b558 which is accessible only before oxidase activation.
The previous studies on animals were concentrated on A. fumigatus conidia infection; as a result hyperaemia and focal hemorrhage were determined in the cortex of the kidneys. Disseminated mononuclear cell infiltrations and large connective tissue were observed at intertubuler areas in infected dogs (Dheebet al., 2015). In addition to cystic tubular dilatation, degeneration of tubular epithelia and hyaline cylinders in some of the tubular lumens were also observed. In the medulla, there were granulomatous foci consisting of neutrophil leucocytes, macrophages and residues of chromatin encapsulated by a fibrous tissue (Cam et al., 2003). While, in infected camels; the symptoms were represented with hemorrhage in kidney (Al Hizab, 2014). In histopathological study of brooder pneumonia, necropsies of chicks which died revealed the presence of white-yellowish caseous nodules in the kidney, ranging from pin point to chickpea in size (Abdulrahmanet al., 2014).
Although of the aggressive behavior of mice, loss of activity at the day 6 of GT treatment has appeared. All signs mentioned above have referred to the activity of GT resulted from mycotoxicosis, Similar morphological changes were observed at the last two weeks in mice injected (i.p.) by other mycotoxin, Trichothecene (Dawood, 2006). On the other hand, Jun et al. (2006) demonstrated that Trinitrobenzene Sulfonic Acid Y induced colitis in mice by intrarectal dose with 0.4 µg mL−1 of GT pointed that treated with GT had almost completely prevented both hyperemia and inflammation in the colons, this confirms that the acute dose of mycotoxin induce the inflammatory response, because it inactivates many different enzymes, such as inhibition of Nuclear Factor-κB leads prevents cytokine release and induction of the inflammatory response (Dolan et al., 2015).
There was a highly significant difference in the cytokine expression between treatment and control groups (p < 0.05). In liver, the histopathological changes noticed in liver can be attributed to the increased TGF-β3 expression. Aggregation of kupffer cells, mononuclear cells and lymphocyte released TGF-β in response to mycotoxicosis and then resulted in more proliferation of kupffer cells. Tumer Necrosis Factor-alpha (TNF-α) was elevated in mice during aspergillosis infection and gliotoxin increasing (Nouriet al., 2015). While, mice administrated intraperitoneally with 4.5mgkg−1 of Fumonisin (FB1) every day for two weeks resulted in apoptosis of liver cells and significantly increased (p < 0.0001) proliferating cell nuclear antigen and Ki-67 expression. Furthermore, elevation the levels of caspase-8 and TNF-α mediators(Sozmenet al., 2014).
Lung is one of the tissues that express TGF-β3 insignificant levels (Bandyopadhyay et al., 2006). The presence of mononuclear cells in dilated blood vessels and their infiltration in the interalveolar septa and alveolar spaces indicated to inflammation and degeneration of these cells, and this led to the high expression of this protein in lung (Kubiczkova et al., 2012).
In the kidney, the histopathological changes noted in GT treated mice are considered an indicator for high expression of this cytokine in renal tissue as it is a profibrotic cytokine found in renal diseases, which initiates and modulates a variety of pathophysiological processes. It is synthesized by many renal cell types (Loeffler and Wolf, 2014). TGF-β3 is secreted by all type of cells and has overlapping receptor usage (Massague, 1998; Sutton et al., 1995; Ibrahim et al., 2017) demonstrated morphological evidence of apoptosis in mice lymphocytes treated with 0.3 µM GT for 6 hrs. They showed that the typical condensed chromatin of the nucleus was evident by low-dose GT which can influence cell division via a reduction in cyclic AMP levels, and that the toxic properties of high doses of GT may be due to elevation of cAMP, resulting in apoptosis. Immunohistochemical staining of colonic mucosa of Trinitrobenzene Sulfonic Acid (TNBS) colitis mice tissue after intrarectal administration of 100 µg/mouse of GT as a therapeutic potential, resulted in that GT induces Heme Oxygenase-1 (HO-1) expression in BALB/c mice colon, especially in crypt epithelium and the smooth muscle layer and that maximal induction was seen after 24–36 hrs of administration and reduced the expression of TNF-α, IL-1b, and IL-12 (Jun et al., 2006; El-Hilaliet al., 2016; Ibrahim et al., 2017). Other studies agreed with our results on GT effect in proteins expressed in animal tissue; in a study on cerebellum of chicken embryos, the effects of 6-aminonicotinamide (6-AN) gliotoxin on the cerebellum astroglial cells and microvessel were analysed on Blood-brain barrier (BBB) which examined by producing glial degeneration in the cerebellum by applying (6-AN) GT onto the embryo chorioallantoic membrane (CAM), The immunostaining for 3CB2 (chick-specific glial marker) and HT7 (chick-specific marker of BBB-provided brain endothelia), resulted in that vascular expression of the HT7 antigen was intense and uniformly distributed everywhere (Bertossi et al., 2003; Ibrahim et al., 2017; Abdulbaqiet al., 2018).
The present study revealed that. both of sample and standard gliotoxin showed the same effectiveness in vivo to induce histopathological changes and the immunohistochemical studies revealed that the increasing of TGF-β3 expression was in a significant relationship between the immunoreactive cell and its intensity with number and size of lesion in the same tissue at P value < 0.05 level, so further investigations are required to evaluate the acute and /or chronic effect of gliotoxin on other cytokines and further histopathological studies of acute and /or chronic effect of gliotoxin on other organs such as muscles, heart, brain, spleen and intestine are required.
References
- Abcam, (2013). Mouse and Rabbit Specific HRP/DAB Detection IHC Kit Version: 2 last updated: 22 (ab80436).
- Expression of biotransformation and antioxidant genes in the liver of albino mice after exposure to aflatoxin B1 and an antioxidant sourced from turmeric (Curcuma longa) Jordan J. Biol. Sci.. 2018;11(2):89-93.
- [Google Scholar]
- Clinical and histopathological study of brooder pneumonia in broiler farms. AL-Qadisiyah. J. Vet. Med. Sci.. 2014;13(1):75-79.
- [Google Scholar]
- Aspergillus fumigatus Infection among Dromedary Camels in Saudi Arabia. Adv. Anim. Vet. Sci.. 2014;2(4):218-221.
- [Google Scholar]
- Molecular identification of clinical Candida isolates by simple and randomly amplified polymorphic DNA-PCR. Arab. J. Sci. Eng. 2017
- [CrossRef] [Google Scholar]
- Gliotoxin causes apoptosis and necrosis of rat Kupffer cells in vitro and in vivo in the absence of oxidative stress: exacerbation by caspase and serine protease inhibition. J. Hepatol.. 2007;47(1):103-113.
- [Google Scholar]
- Theory and practice of Histological Techniques (second ed.). Churchill Livingstone; 1982. p. :483-516.
- Survey study of the allergic fungi in Kirkuk area and use molecular detection for identification. IJSBAR. 2015;19(1):383-397.
- [Google Scholar]
- A “traffic control” role for TGFbeta3: orchestrating dermal and epidermal cell motility during wound healing. J. Cell Biol.. 2006;172(7):1093-1105.
- [Google Scholar]
- Microbial Applications Laboratory Manual in General Microbiology (eighth ed.). The McGraw-Hill Companies; 2001. 168, 257-261, 434-437
- Effects of 6-aminonicotinamide gliotoxin on blood-brain barrier differentiation in the chick embryo cerebellum. Anat. Embryol.. 2003;207:209-219.
- [Google Scholar]
- Impact of mycotoxins secreted by aspergillus molds on the inflammatory response of human corneal epithelial cells. Toxins. 2017;9:197.
- [CrossRef] [Google Scholar]
- Increased production of gliotoxin is related to the formation of biofilm by Aspergillus fumigatus: an immunological approach. Pathog. Dis.. 2014;70:379-389.
- [Google Scholar]
- Pathogenesis of Aspergillus fumigatus in Invasive Aspergillosis. Clin. Microbiol. Rev.. 2009;22(3):447-465.
- [Google Scholar]
- Pathological effect of Trichothecenes (T-2 toxin) produced by Fusarium oxysporum on liver and kidneys of mice. College of Science, Al- Nahrain University; 2006. MSc Thesis
- Immunohistochemical study of Tumor Necrosis Factor-alpha(TNF- α) expression in lung, liver, and spleen during aspergillosis infection. BMC Genomics. 2014;15(2):71.
- [Google Scholar]
- A study of the expression of aflatoxin B1 regulatory gene in clinical and environmental Aspergillus flavus using Real-time PCR. IJSBAR. 2014;17(1):417-427.
- [Google Scholar]
- The inhibitory effects of human, camel and cow’s milk against some pathogenic fungi in Iraq. Jordan. J. Biol. Sci.. 2015;8(2):89-93.
- [Google Scholar]
- The effects of Rubusidaeus extract on normal human lymphocytes and cancer cell line. BMC Genomics. 2016;17(Suppl. 6):P19.
- [Google Scholar]
- Resistance is not futile: gliotoxin biosynthesis, functionality and utility. Trends Microbiol.. 2015;23(7):419-428.
- [CrossRef] [Google Scholar]
- Blood transfusion utility during cardiopulmonary bypass and correlation with key-biochemical laboratory findings: a new approach to identify preventive and risk factors (1-year practice at University Hospital Hassan-II of Fez) Biochem Anal. Biochem.. 2016;5:3.
- [CrossRef] [Google Scholar]
- An overview on major mycotoxin in animal: its public health implication, economic impact and control strategies. J. Health Med. Nurs.. 2016;25 SSN 2422-8419, An International Peer-reviewed Journal
- [Google Scholar]
- The Aspergillus fumigatus toxin fumagillin suppresses the immune response of Galleria mellonella larvae by inhibiting the action of haemocytes. Microbiology. 2011;157:1481-1488.
- [Google Scholar]
- Isolation of Blastomyces dermatitides histopathologically and immunologically in Baghdad. Al-Nahrain University; 2010. A Thesis Submitted to College of Medicine
- Improving conditions for gliotoxin production by local isolates of Aspergillus fumigatus. J. Biotechnol. Res. Center. 2017;11(2)
- [Google Scholar]
- Antifungal activity of wide band gap Thioglycolic acid capped ZnS: Mn semiconductor nanoparticles against some pathogenic fungi. Mater. Sci. Eng. C. 2017;73:665-669.
- [Google Scholar]
- Gliotoxin reduces the severity of trinitrobenzene sulfonic acid-induced colitis in mice: evidence of the connection between Heme Oxygenase-1 and the Nuclear Factor-kB Pathway In Vitro and In Vivo. Inflamm. Bowel Dis.. 2006;12(7):619-629.
- [Google Scholar]
- Candida species fail to produce the immunosuppressive secondary metabolite gliotoxin in vitro. FEMS Yeast Res.. 2007;7:986-992.
- [Google Scholar]
- Development and application of an enzyme immunoassay for the detection of the mycotoxin Fumigaclavine A. Faculty of Veterinary Medicine of Justus Liebig University Giessen; 2010. PhD thesis
- Transforming growth factor-β and the progression of renal disease. Nephrol. Dial. Transplant.. 2014;29:i37-i45.
- [Google Scholar]
- Acute toxicity and total fumonisins content of the culture material of Fusarium verticilloides Nirenberg (CABI IMI 392668) isolated from rice in Nigeria. Agric. Biol. J. North Am.. 2010;1:103-112.
- [Google Scholar]
- Gliotoxin-induced changes in rat liver regeneration after partial Hepatectomy. Liver pathobiology. Liver Int.. 2013;33:1044-1055.
- [Google Scholar]
- Subtelomeric diversity as a major force in evolution of Aspergillus secondary metabolism and virulence pathways. In: 3rd Advances against Aspergillosis, January 16–19, Miami Beach, Florida. San Diego, USA: University of California; 2008. p. :77.
- [Google Scholar]
- Cytotoxicity and genotoxicity of gliotoxin on human lymphocytes in vitro. J. KSU – Sci.. 2015;27:193-197.
- [Google Scholar]
- Electromicroscopic observations on gliotoxin-induced apoptosis of cancer cells in culture and human cancer xenografts in transplanted SCID Mice. In vivo. 2007;21:259-266.
- [Google Scholar]
- Molecular Identification of Aspergillus fumigatus Using ISSR and RAPD Markers. Iraqi J. Sci.. 2015;56(4A):2788-2797.
- [Google Scholar]
- Histopathological and enzymatic study on the effect of Aspergillus fumigatus in mice. J. Faculty Med. Baghdad. 2010;480, 52(4):480-483.
- [Google Scholar]
- Cellular effects of gliotoxin evaluation of a proteomic, isotope-based method to detect reactive cysteines. Victoria University of Wellington; 2014. MSc. thesis
- Protective effects of silymarin on fumonisin B1-induced hepatotoxicity in mice. J. Vet. Sci.. 2014;15(1):51-60.
- [Google Scholar]
- Sugui, J.A., Rose, S.R., Nardone, G., Swamydas, M., Lee, C.R., Kwon-Chung, K.J., Lionakis M.S. (2017) Host immune status-specific production of gliotoxin and bismethyl-gliotoxin during invasive aspergillosis in mice production of gliotoxin and bismethyl-gliotoxin during invasive aspergillosis in mice.
- Evidence that gliotoxin enhances lymphocyte activation and induces apoptosis by effects on cyclic Amp levels. Biochem. Pharmacol.. 1995;50(12):2009-2014.
- [Google Scholar]
- Macrophage and TGF-β Immunohistochemical expression in Jorge Lobo’s disease. Hum. Pathol.. 2008;39:269-274.
- [Google Scholar]
- Chemistry of tremorgenic metabolites. I. Fumitremorgin A from Aspergillus fumigatus. Chem. Pharm. Bull.. 1980;28:245-254.
- [Google Scholar]


