

Translate this page into:
High performance Sm substituted Ni-Zn catalysts for green hydrogen generation via Photo/Electro catalytic water splitting processes
⁎Corresponding author. rohitsinghjasrotia4444@gmail.com (Rohit Jasrotia)
-
Received: ,
Accepted: ,
This article was originally published by Elsevier and was migrated to Scientific Scholar after the change of Publisher.
Abstract
In this work, samarium doped Ni-Zn catalysts with a composition of Ni0.9Zn0.1SmyFe2-yO4 (y = 0–0.03) are made by inorganic sol–gel auto-combustion (SC) route. These Ni-Zn materials depict the forming of typical cubic crystal structure (Fd3m) and it is affirmed by the X-ray diffraction plots. The existence of cubic, spherical, and aggregated shaped grains with an average grain size that falls in between the range of 188 to 316 nm are confirmed from the FESEM images of prepared materials. According to the photo catalytic water splitting research findings, the total hydrogen yield for the Ni-Zn1, Ni-Zn2, Ni-Zn3, and Ni-Zn4 catalysts after four hours are 16.17, 15.02, 23.47 and 24.99 mmol . Among all the compositions, the Ni-Zn4 photocatalyst exhibits the maximum photocatalytic performance of 24.99 mmol . However, the Ni-Zn4 sample also shows the high electro catalytic hydrogen evolution reaction (HER) performance. With their outstanding photo/electro performance, the synthesized Sm-doped Ni-Zn nanoferrites shows great promise as potential candidates for the green hydrogen generation.
Keywords
Ni-Zn catalysts
Environmental Pollution
Photo/Electro catalysis
Water-splitting
Green hydrogen

1 Introduction
The increasing energy demands give rise to environmental complications and pollution (Yap et al., 2021), because of most of the energy is produced via the fossil fuels. But the continuous use of carbon-based fuels has adversely impacted our habitat as well as environment. To tackle the issue of energy crisis, the numerous novel approaches are being developed. Among the energy sources, hydrogen (H2) as a fuel has one of the highest calorific values which make it highly efficient, and also, it doesn’t produce any harmful waste after the combustion which makes it sustainable (Abbasi and Abbasi, 2011; Armaroli and Balzani, 2011). The new methods like electrocatalysis and photocatalysis are gaining attention due to their carbon free nature and effectiveness in producing the pure hydrogen gas. To reduce cost of hydrogen production through electro/photo catalysis, the researchers are focusing on preparing the catalysts which could increase the yield of the hydrogen gas while also being cost-effective. The researchers are looking for an efficient catalyst for the green and sustainable hydrogen generation. By making a cost effective and highly efficient catalyst, the cost of the hydrogen generation could be decreased. To replace the expensive catalysts like titanium, the researchers are going for the spinel ferrite catalysts for photo/electro catalytic H2 production (Ball and Wietschel, 2009; Colón, 2016; Oh et al., 2022). Spinel ferrites represent a category of magnetic metal oxides having spinel cubic structure with a composition of AB2O4, here A can be any divalent cation, and B can be trivalent cation (Sangaa et al., 2018). For catalysis, the spinel ferrites show highly stable behavior, which allows their use in conditions (extreme pH, temperature, pressure). The excellent surface to volume ratio of nano ranged spinel ferrites contributes to their remarkable catalytic activity. Amongst the spinel ferrite-based materials, selective few that include, nickel ferrite (NiFe2O4), zinc ferrite (ZnFe2O4), and the cobalt ferrite (CoFe2O4), shows the better potential for hydrogen production via both electrocatalytic and photocatalytic and electrocatalytic methods. Some studies have shown the potential of these spinel ferrites for the H2 yield. Mukherjee et al. reported the potential applicability of NiFe2O4 for the hydrogen evolution. They grafted the NiFe2O4 nanoparticles over reduced graphene oxide sheets. The composite was made using hydrothermal approach. The ferrite particles showed the good coupling with the nanosheets and also, they have high specific surface area. The samples have small Tafel slope and overpotential of 58 mVdec-1 and 5 mV which makes the nickel ferrite highly advantageous for the electrocatalytic H2 production (Mukherjee et al., 2018). Jasrotia et al. constructed Nd and La doped Co-Ni nanocatalysts by SC route. The Co0.7Ni0.3Nd0.03La0.03Fe1.94O4 catalyst exhibit the highest catalytic performance resulting 12.57 mmol gcat−1 along with the high HER electrocatalytic activity. Thus, the developed nanocatalyst with such a high photo/electro catalytic performance are very efficient for generation of green hydrogen (Jasrotia et al., 2023b).
There exist multiple synthesis methods for fabricating the spinel ferrites, like the sol–gel auto-combustion (Katoch et al., 2023; Kotwal et al., 2023b), co-precitation (Agú et al., 2014), hydrothermal (Almessiere et al., 2024), citrate precursor (Hussein et al., 2023), solid-state (Banaj and Agrawal, 2023), green synthesis (Godara et al., 2023a, 2023b), etc. The SC approach is preferred for the production of spinel ferrite nanoparticles due to its ability to regulate grain and particle dimensions and facilitate the formation of a pure phase. The SC procedure offers two viable approaches, namely inorganic and organic. The inorganic SC method involves the metallic salts such as nitrates as chemical agents within aqueous concoction, whereas the SC technique relies on organic solutions containing metal alkoxides [14]. Therefore, the inorganic SC pathway is utilized in the current investigation for the production of Ni-Zn spinel ferrites because of its cost-effectiveness and operational simplicity.
That’s why, here we are reporting the efficacy of Sm doped Ni-Zn nanomaterials, with a chemical composition of Ni0.9Zn0.1SmyFe2-yO4 (y = 0.00, 0.01, 0.02, 0.03) for the greener and sustainable hydrogen generation.
2 Materials and Methodology
2.1 Raw materials
A series of Ni0.9Zn0.1SmyFe2-yO4 (y = 0.00–0.03) nanomaterials are produced via using the AR grade raw materials of Rankem, Sigma Aldrich, and SimSon companies including the citric acid (99 %), nickel nitrate (98 %), zinc nitrate (96 %), samarium nitrate (SmN3O9, 99.9 %), and the ferric nitrate (98 %). Moreover, the ethylene glycol (99 %) and ammonia (25 %) are used as the gel and pH precursors, respectively.
2.2 Methodology for the creation of Sm doped Ni-Zn catalysts
The fabrication of Sm substituted Ni-Zn ferrite involves the utilization of inorganic SC method. The process began via preparing a metal nitrate solution in a 100 mL of distilled water. Simultaneously, C6H8O7 solution is made in 100 mL of distilled water, with appropriate proportions based on specific requirements of the experiment. Both the solutions are prepared using hot plate magnetic stirrer. After the metal nitrate solution is entirely dissolved, then it is introduced to the citric acid solution, and the final solution is agitated for 2 h. To achieve neutral pH, the solution of ammonia is added to the mixture. The ethylene glycol is introduced in the solution in an appropriate mass ratio to activate the gelation and transforming the solution into a viscid substance. The gel is heated to 120 °C to initiate the self-ignition process. After the auto-combustion, a dark-coloured powdery substance is obtained. This powdery material is subsequently mashed by mortar pestle to obtain the fine powder. The crushed powder is then subjected to calcination (800 °C, 6 h), a process aimed at enhancing the stability and final formation of the product. Fig. 1 shows the SC technique for the creation of Sm doped and pure Ni-Zn nanomaterials.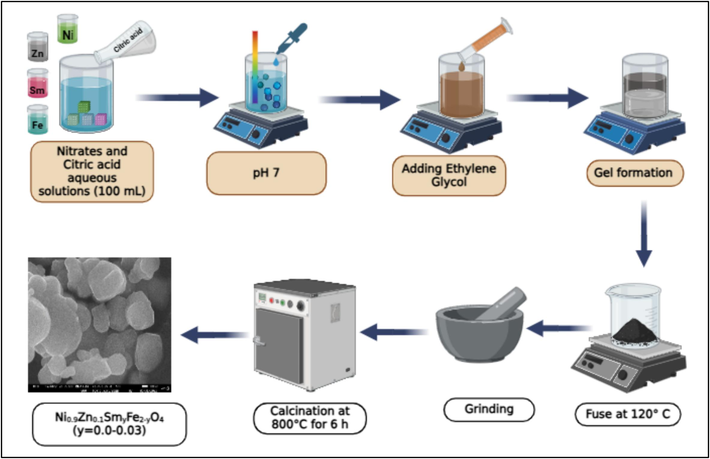
SC scheme of Sm doped and pure Ni-Zn nanomaterials
Herein, Ni0.9Zn0.1Fe2O4 (y = 0.00), Ni0.9Zn0.1Sm0.01Fe1.99O4 (y = 0.01), Ni0.9Zn0.1Sm0.02Fe1.98O4 (y = 0.02), and Ni0.9Zn0.1Sm0.03Fe1.97O4 (y = 0.03) catalysts are named as Ni-Zn1, Ni-Zn2, Ni-Zn3, and Ni-Zn4, respectively.
2.3 Characterization techniques
The structural features of generated specimens, such as phase formation and crystal structure, are studied by a X-ray diffractometer (Panalytical's X'Pert Pro). Field emission scanning electron microscopy (JSM 6100 (JEOL)) examined the surface morphology of generated Ni-Zn nanoparticles. A vibrating sample magnetometer (Model MicroSense) is used at ambient temperature to determine the magnetic behavior of produced materials.
2.4 Procedure for the photocatalytic H2 measurements
In the context of photocatalytic water splitting for the hydrogen generation under the ambient conditions and irradiation with UV–visible light spanning wavelengths from 200 to 2400 nm, the electron donor sites are facilitated by the sacrificial agents (SA), namely 0.128 and 0.079 M of Na2S and Na2SO3 (500 mg) correspondingly. SA serve to deliver the electron donors during photocatalytic reaction. The study investigates the efficacy of pure and Sm-doped Ni-Zn photocatalysts in this process. In order to perform the hydrogen yield experiment, an airtight photoreactor is filled with 50 mL of double-distilled water, 20 mg of photocatalyst, and SA. This photoreactor is a quartz cell that is cylindrical in shape and has a flat base and a bottleneck diameter of 4 cm. The concoction underwent the stirring and nitrogen are purging for 30 min, to form an inert environment that abolish the gas impurities including the dissolved O2. The concoction was poured into a quartz chamber with a cylindrical shape, fixed onto the agitator, and adjusted so that its flat side rested 7 cm from the lamp. Employed for illumination by using a HgXe arc lamp (200 W, Newport, MODEL: 66906-200HXF-R15), emitting a steady irradiance of 180 W, with the concoction undergoing the continuous stirring. The hydrogen emission is measured using a gas chromatograph (Perkin Elmer) with a TCD detector. Using a customized syringe, the samples are collected every one-hour interval. The photocatalysts are parted from the mixture using the centrifugation, and then dried out. After that, they are observed for their photostability, recyclability, photocatalytic response, and reusability representing highest H2 generation over the 3–4 h rounds.
2.5 Procedure for the electrocatalytic H2 measurements
To evaluate the electrocatalytic activity of Ni-Zn materials, the electrochemical measurements are conducted using a three-electrode setup in a 0.5 M H2SO4 electrolyte solvent for hydrogen evolution reaction (HER). It is done at the ambient temperature via the Autolab PGSTAT204 equipment. Platinum and saturated calomel electrodes (SCE) are taken as counter and reference electrode. The working electrodes, composed of electrocatalysts, are prepared via coating catalyst dispersions onto ITO substrates (dimensions: 1 x 1 cm2, sheet resistance < 10 O/sq, Vritra). Prior to the dispersion being drop-cast onto the substrates, the substrates are ultrasonically cleaned for ten minutes (using acetone, ethanol, and isopropanol). 6 mg of electrocatalysts are suspended in polymer binder consisting of isopropanol (300 μL) and Nafion (15 μL) to create the catalyst dispersions. The resultant concoctions underwent a half-hour sonication. After that, 150 μL of the dispersions are drop-cast onto the ITO substrate's conducting side, also known as the oxide layer side, and are vacuum-dried for a whole night at 60°C. Chronoamperometry (CA) data are acquired at −1 V for HER performance, and the linear sweep voltammetry (LSV) analysis at 100 mV/s. However, the cyclic voltammetry (CV) measurements are taken from 20-150 mV/s for the electrochemical investigation of Ni-Zn nanostructures.
3 Results and discussions
3.1 XRD study
The structural characteristics of Ni0.9Zn0.1SmyFe2-yO4 nanomaterials are investigated within the 2theta range of 25-65⁰ through the utilization of XRD. Fig. 2(a) illustrates the XRD plots of Ni-Zn catalysts substituted with Sm, from which several parameters like hopping distances at interstitial sites (LA & LB), crystallite size (D), x-ray density (dx), and lattice constant (a), are calculated and presented in Table 1. The specific diffraction peaks (2 2 0), (3 1 1), (2 2 2), (4 0 0), (4 2 2), (5 1 1), and (4 4 0) observed in the XRD analysis show the creation of a singular spinel phase with Fd3m space geometry, excluding any other phases. All the diffraction results are in complete agreement with the JCPDS data: 019–0629 (Shahane et al., 2010). The “D” values of substituted and pure nanoferrites are computed by Debye-Scherrer formula (Table 1) as given below (Aisida et al., 2023).
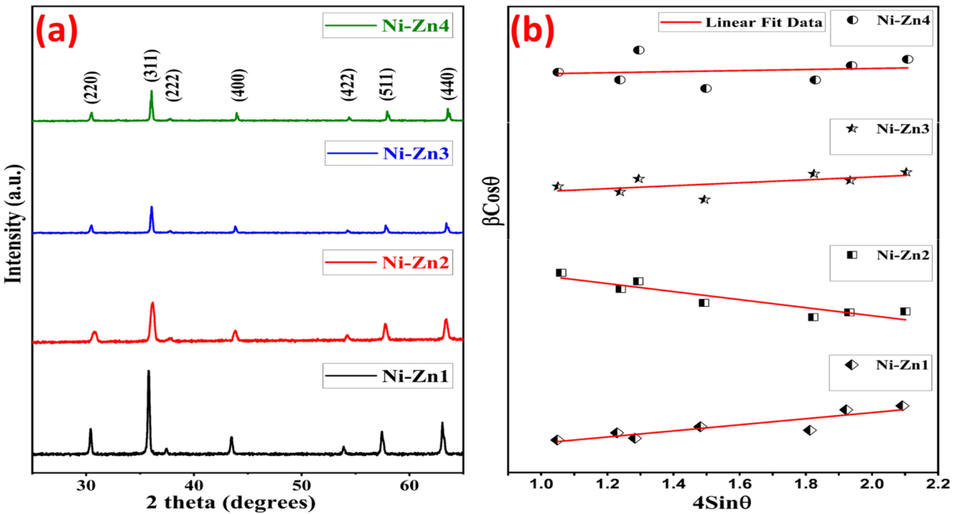
(a) XRD (b) H-W graphs for the Ni0.9Zn0.1SmyFe2-yO4 nanomaterials
Composition
Ni-Zn1
Ni-Zn2
Ni-Zn3
Ni-Zn4
a (Å)
8.320
8.226
8.253
8.242
D (nm)
39.32
24.20
35.58
37.32
dx (g/cm3)
5.423
5.633
5.600
5.643
LA (Å)
3.602
3.562
3.573
3.569
LB (Å)
2.941
2.908
2.917
2.914
H-W Data
Strain
0.001
0.002
0.0005
0.0001
DH-W (nm)
71.84
13.54
44.43
39.84
N-R Data
aN-R (Å)
8.331
8.342
8.267
8.157
Ms (emu/g)
51.93
53.84
59.48
51.92
Mr (emu/g)
36.96
68.58
46.26
63.18
Hc (Oe)
2.71
7.04
4.63
6.27
K (erg/cm−1)
959.68
1846.11
1375.756
1640.29
SQR (Mr/Ms)
0.05
0.13
0.08
0.12
nB (
B)
2.19
2.28
2.52
2.21
The Hall-Williamson (H-W) analysis is used to determine the effect of both the crystallite size (DH-W) and strain (ε) in the synthesised samples. The H-W study follow the following requirement as formulated below.
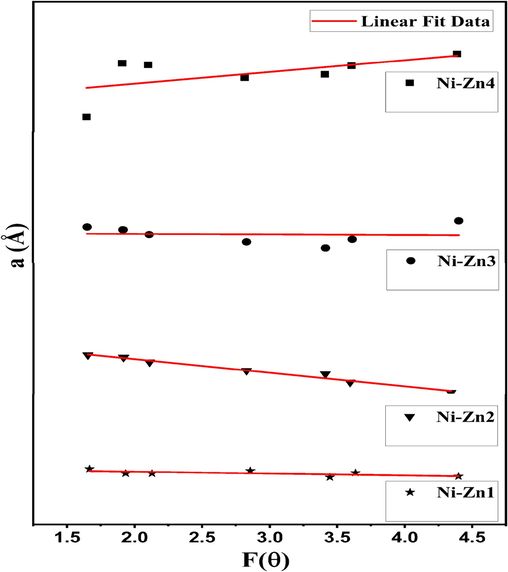
N-R plots of the Ni0.9Zn0.1SmyFe2-yO4 nanomaterials
3.2 FESEM, EDX and elemental mapping studies
The surface of the Ni-Zn nanoferrites, pure and doped, are analyzed by FESEM analysis. Fig. 4(a-d) displays the grain size histograms and FESEM visuals of all the nanomaterials. The spherical and cubic shaped grains with well-defined boundaries are obtained by FESEM pictures of all prepared samples. Additionally, the size of grains is evaluated by the IMAGE J program. Based on the plots, it is clear that the generated Ni-Zn1, Ni-Zn2, Ni-Zn3, and Ni-Zn4 samples attains the grain size of 316, 200, 216, and 188 nm. The phenomena of crystallite aggregation is accountable for the occurrence of the larger grains (Hu et al., 2022; Kotwal et al., 2023c). Fig. 4(e) presents the EDX spectra and elemental mapping of Ni-Zn1 material. From EDX, the nickel, zinc, iron, and oxygen peaks are found. This observation provides the successful justification of successful preparation of the undoped Ni-Zn nanoferrite. Also, the elemental mapping of fabricated Ni-Zn1 sample, solidating the uniform distribution of Ni, Zn, Fe, and O across the synthesized nanomaterial.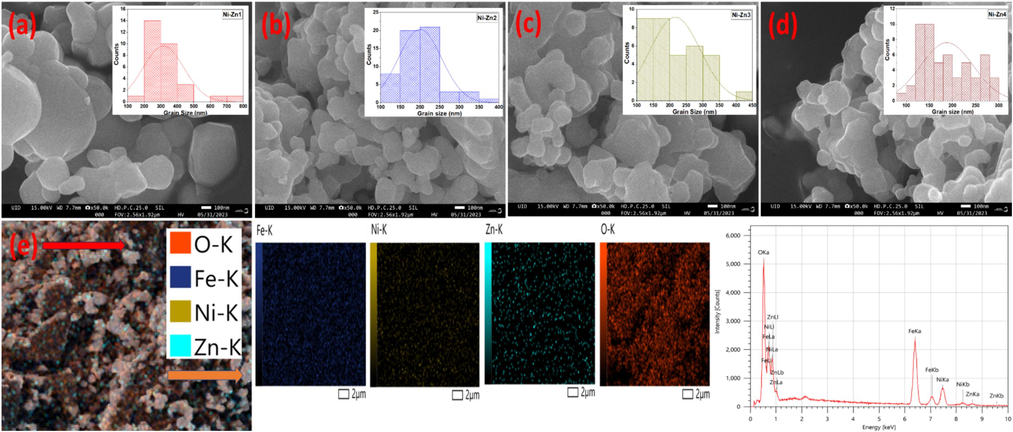
FESEM images of (a) Ni-Zn1 (b) Ni-Zn2 (c) Ni-Zn3 (d) Ni-Zn4 samples and (e) EDX spectra and elemental mapping of Ni-Zn1 sample
3.3 VSM study
The M−H study is done at a field of 20 KOe, as illustrated in Fig. 5(a). It is observed from the diagram that there are S-shaped loops indicating a soft ferromagnetic nature. Various factors like coercivity (Hc), remanence (Mr), squareness ratio (Mr/Ms), saturation magnetization (Ms), anisotropy constant (K), and magnetic moment (nB) are determined based on the M−H data, as shown in Table 1. Further insights into the phenomenon of coercivity and remanence are presented in Fig. 5(b), whereas Fig. 5(c), shows the plots of M vs 1/H2 for the manufactured samples. The M vs 1/H2 plots are analyzed in order to determine the mean value of Ms. The change in Ms due to Sm doping can be elucidated by observing the exchange interactions and magnetic moment at the lattice sites. The Sm cations go to the site-A which increases the nB at the site-B. This causing an increment in magnetization at the B-site. Hence, upto y = 0.02, the Ms of Ni-Zn nanomaterials are rised from 51.93 to 59.48 (Table 1). However, at high Sm doping (y = 0.03), the Sm ions prefer to go to the B-site and this will decrease the overall Ms of B-sublattice. This will happen due to lower nB of Sm3+ (0 μB) ions in contrast to that of Fe3+ ions (5 μB). Therefore, the Ms of Ni-Zn4 sample goes on decreasing from 59.48 to 51.92 emu/g.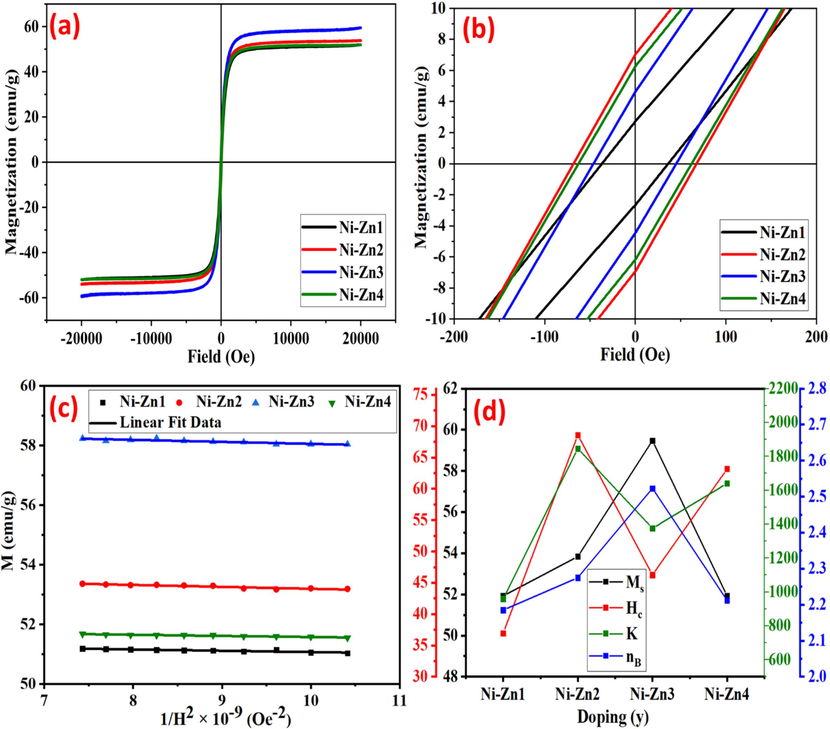
(a) M−H loop (b) Zoom view of “Hc” and “Mr” (c) Magnetization versus 1/coercivity2 (d) Alternation of nB, K, Hc, and Ms of Ni0.9Zn0.1SmyFe2-yO4 nanomaterials
Fig. 5(d) illustrates the variation in Hc, Ms, nB and K with the dopant content of Sm. The factors influencing the variation in “Hc” include the morphology and magneto-crystalline anisotropy. Brown's relation indicates that the Ms varies inversely with Hc. Consequently, this study similarly observes such trends in the produced samples (Table 1). With the increasing Sm doping, the values of “K” fall between 959.68 and 1846.11 erg/cm3 (Table 1). There are the direct relations among the K and Hc. Thus, the K exhibits a similar behavior to Hc. Moreover, the nB and Mr/Ms are calculated using the respective relations (Kotwal et al., 2023a).
3.4 Photo/Electro catalytic water splitting study
3.4.1 Photocatalytic H2 generation study
The process of water splitting study is performed to examine the catalytic activity of Ni-Zn nanoparticles for the photocatalytic H2 yield. Fig. 6(a) illustrates a recording of photo hydrogen evolution over a period of time. In Fig. 6(b), the total apparent H2 yield for the Ni-Zn1, Ni-Zn2, Ni-Zn3, and Ni-Zn4 photocatalysts after 4 h is 16.17,15.02, 23.47 and 24.99 mmol
(Table 2). The order of photocatalyst activity for the H2 evolution is as follows: Ni-Zn4 > Ni-Zn3 > Ni-Zn2 > Ni-Zn1, with respective rates of 3.78, 3.22, 6.21, and 7.22 mmolg-1cath-1 (Table 2). Among these compositions, the Ni-Zn4 demonstrated the highest photocatalytic activity, reaching 24.99 mmolg-1cath-1. The repeatability and stability of the photocatalysts were assessed over multiple 4-hour reaction cycles under identical conditions, utilizing a gas chromatography analyzer for precise hydrogen evolution rate measurements. Fig. 6(d) presents the analysis of three consecutive cycles for the optimal photocatalyst, examining its H2 emission rate, stability and repeatability. Notably, the 3rd cycle exhibited a slight decrement in H2 emission to 23.35 mmolgcat-1 related to the initial cycle.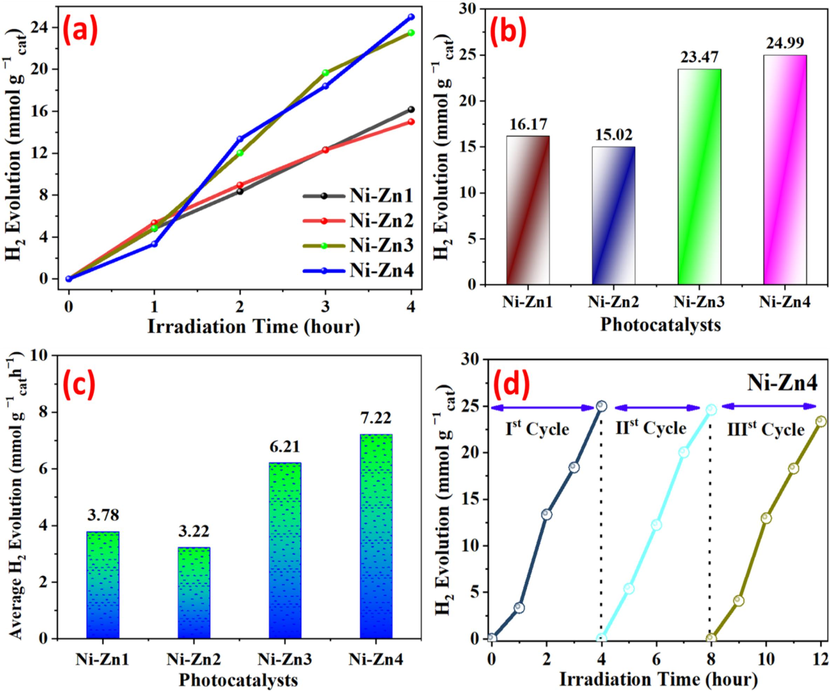
(a) Evolution curves of photocatalytic hydrogen exposed to UV–visible light (b) A comparative analysis of photocatalytic activity (c) average H2 emission of fabricated photocatalysts per hour (d) Ni-Zn4 stability test for a maximum of three cycles
Catalysts
Photocatalytic Performance
Electrocatalytic Performance (HER)
H2/8h (mmol
)
Average H2 Evolution
(mmol
h−1)
Onset potential (V)
Overpotential (V) to attain 10 mA/cm2
Tafel slope (mV/dec)
Ni-Zn1
16.17
3.78
−0.88
−1.09
52.55
Ni-Zn2
15.02
3.22
−0.8
−1.06
48.67
Ni-Zn3
23.47
6.21
−0.8
−1.04
40.85
Ni-Zn4
24.99
7.22
−0.8
−1.03
39.18
3.4.2 Electrocatalytic H2 generation study
The electrocatalytic activity of Ni-Zn materials as electrocatalysts are determined towards the electrocatalytic HER performance (Fig. 7). LSV and CV are used to investigate the hydrogen evolution reaction (HER), as illustrated in Fig. 7(a, b). The increase in Sm concentration within the synthesized Ni-Zn materials corresponded to an increase in overpotential observed at a cathode current density of 10 mAcm−2, indicating the enhanced electrocatalytic HER activity of the Ni-Zn4 sample. Specifically, the overpotential values for the Ni-Zn1, Ni-Zn2, Ni-Zn3, and Ni-Zn4 electrocatalysts at 10 mAcm−2 are recorded as −1.09, −1.06, −1.04, and −1.03 V, respectively. Chronoamperometric (CA) measurements are conducted to assess the durability and stability of Ni-Zn4 electrocatalyst, operated at a voltage of −1V for up to 12,000 s, revealing a small increment in current density (Fig. 8). Tafel polarization plots for all the electrocatalysts in water electrocatalysis are presented in Fig. 7(c), with the corresponding electrochemical parameters for HER as summarized in Table 2. Furthermore, the decrement in resistance throughout the applied potential window is detected at different scan rates ranging from 20 to 150 mV. Finally, as shown in Fig. 7(d), the CV analysis of the HER for the Ni-Zn4 electrocatalyst is carried out.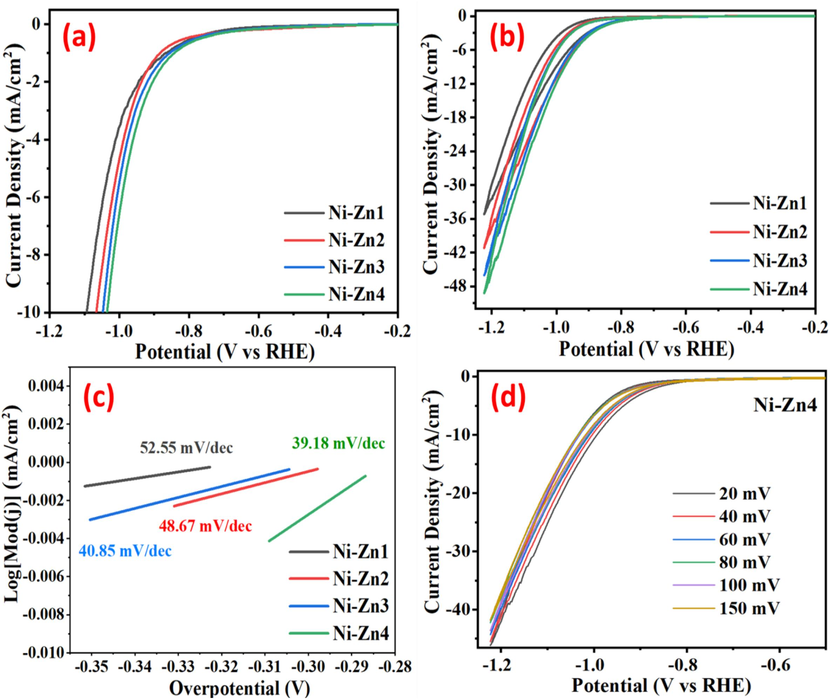
(a) LSV graph of HER (b) CV graph of HER (c) HER Tafel graph of the prepared electrocatalysts (d) CV plots of Ni-Zn4 at different scan rates from 20-150 mV towards HER
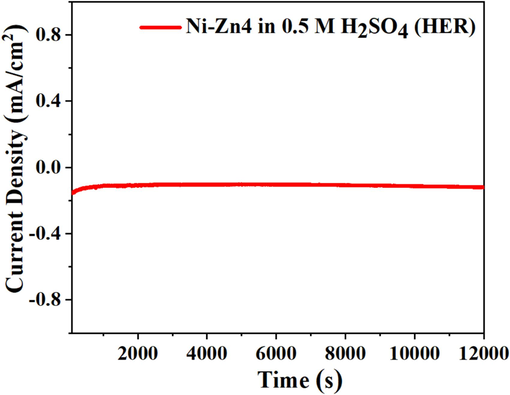
CA study at −1 V for Ni-Zn4 sample
4 Conclusion
The Ni0.9Zn0.1SmyFe2-yO4 (y = 0.00–0.03) catalysts are successfully produced by SC approach. XRD data exhibit the single-phase symmetry for the Ni-Zn spinel nanoferrites. The developed Ni-Zn1, Ni-Zn2, Ni-Zn3, and Ni-Zn4 samples attains the grain size of 316, 200, 216, and 188 nm. From the VSM measurements, the excellent values of Ms (51.92–59.48 emu/g), Hc (2.71–7.04 Oe), and Mr (36.96–68.58 emu/g) are obtained in the existing work, and this makes them possible candidates for applications in the recording applications. According to the findings of photo/electro catalytic water splitting results, the Ni-Zn4 nanocatalyst shows the maximum photo and electrocatalytic HER H2 performance. Hence, this outstanding photo and electro catalytic water splitting behavior exhibits the great potential of highly doped Ni-Zn4 catalyst for the yield of green hydrogen energy.
CRediT authorship contribution statement
Rohit Jasrotia: Writing – review & editing, Writing – original draft, Supervision, Resources, Project administration, Methodology, Investigation, Data curation, Conceptualization. Chan Choon Kit: Funding acquisition. Mohd Fazil: Investigation. Jahangeer Ahmed: Resources. Tokeer Ahmad: Writing – review & editing, Resources. Norah Alhokbany: Writing – review & editing. Mika Sillanpaa: Resources. Natrayan Lakshmaiya: Writing – review & editing. Vaseem Raja: Writing – review & editing.
Acknowledgement
All the authors acknowledge the Researchers Supporting Project number (RSP2024R253) at King Saud University, Riyadh, Saudi Arabia to support this research.
Declaration of competing interest
The authors declare that they have no known competing financial interests or personal relationships that could have appeared to influence the work reported in this paper.
References
- ‘Renewable’hydrogen: prospects and challenges. Renew. Sustain. Energy Rev.. 2011;15:3034-3040.
- [Google Scholar]
- Synthesis and characterization of a mixture of CoFe2O4 and MgFe2O4 from layered double hydroxides: Band gap energy and magnetic responses. J. Magn. Magn. Mater.. 2014;369:249-259.
- [Google Scholar]
- Aisida, S.O., Ugwu, K., Agbogu, A., Ahmad, I., Maaza, M., Ezema, F.I., 2023. Synthesis of intrinsic, Manganese and magnesium doped cobalt ferrite nanoparticles: Physical properties for antibacterial activities. Hybrid Adv. 100049.
- Comparing magnetic characteristics of CoSe3xFe2–4xO4 (x≤ 0.10) spinel ferrite nanoparticles synthesized via Sol-Gel and hydrothermal approaches. Nano-Struct. Nano-Objects. 2024;38:101196
- [Google Scholar]
- The future of hydrogen–opportunities and challenges. Int. J. Hydrog. Energy. 2009;34:615-627.
- [Google Scholar]
- Dielectric behavior of Zr4+ doped MgFe2O4 spinel ferrite synthesized by solid-state reaction method. Curr. Appl. Phys.. 2023;56:47-65.
- [Google Scholar]
- Towards the hydrogen production by photocatalysis. Appl. Catal. Gen.. 2016;518:48-59.
- [Google Scholar]
- Godara, S.K., Jasrotia, R., Kaur, V., Malhi, P.S., Ahmed, J., Kandwal, A., Verma, S., Singh, M., Kaur, P., Dhaka, R.K., 2023a. A sustainable approach for the synthesis of PbFe12O19 materials using tomato pulp as a fuel: Structural, Morphological, Optical, Magnetic, and Dielectric Traits. J. Magn. Magn. Mater. 170643.
- Green synthesis of magnetic nanoparticles of BaFe12O19 hexaferrites using tomato pulp: structural, morphological, optical, magnetic and dielectric traits. J. Mater. Sci. Mater. Electron.. 2023;34:1516.
- [CrossRef] [Google Scholar]
- Activation of Na2S2O8 by MIL-101 (Fe)/Co3O4 composite for degrading tetracycline with visible light assistance. Inorg. Chem. Commun.. 2022;144:109902
- [Google Scholar]
- Impact of the Ni/Co ratio on structural and magnetic properties in A-site stoichiometric nanosized spinel ferrites. Ceram. Int.. 2023;49:39107-39116.
- [Google Scholar]
- Mg1-xNixGayFe2-yO4 nano catalysts for green hydrogen generation with highly efficient photo/electro catalytic water splitting applications. Energy: Int. J. Hydrog; 2023.
- Photocatalytic and electrocatalytic hydrogen production promoted by Nd/La substituted cobalt–nickel magnetic nanomaterials. Energy: Int. J. Hydrog; 2023.
- Sol-gel auto-combustion developed Nd and Dy co-doped Mg nanoferrites for photocatalytic water treatment, electrocatalytic water splitting and biological applications. J. Water Process Eng.. 2023;53:103726
- [Google Scholar]
- Photo/electro catalytic green hydrogen production promoted by Ga modified Co0. 6Cu0. 4Fe2O4 nano catalysts. Environ. Res.. 2023;117669
- [Google Scholar]
- Magnetically recoverable sol-gel auto-combustion developed Ni1-xCuxDyyFe2-yO4 magnetic nanoparticles for photocatalytic, electrocatalytic, and antibacterial applications. Environ. Res.. 2023;231:116103
- [Google Scholar]
- Magnetically recoverable sol-gel auto-combustion developed Ni1-xCuxDyyFe2-yO4 magnetic nanoparticles for photocatalytic, electrocatalytic, and antibacterial applications. Environ. Res.. 2023;116103
- [Google Scholar]
- Nanostructured nickel ferrite embedded in reduced graphene oxide for electrocatalytic hydrogen evolution reaction. Mater. Today Energy. 2018;8:118-124.
- [Google Scholar]
- Is photocatalytic hydrogen production sustainable?–Assessing the potential environmental enhancement of photocatalytic technology against steam methane reforming and electrocatalysis. J. Clean. Prod.. 2022;379:134673
- [Google Scholar]
- An overview of investigation for ferrite magnetic nanomaterial. Solid State Phenom.. 2018;271:51-63.
- [Google Scholar]
- Synthesis and characterization of Ni–Zn ferrite nanoparticles. J. Magn. Magn. Mater.. 2010;322:1015-1019.
- [Google Scholar]
- A commentary on the use of bivalve mollusks in monitoring metal pollution levels. Int. J. Environ. Res. Public. Health. 2021;18:3386.
- [Google Scholar]


