

Translate this page into:
Heat-assisted sol–gel synthesis of tio2 nanoparticles structural, morphological and optical analysis for self-cleaning application
⁎Corresponding author. tjen@uj.ac.za (T.C. Jen)
-
Received: ,
Accepted: ,
This article was originally published by Elsevier and was migrated to Scientific Scholar after the change of Publisher.
Peer review under responsibility of King Saud University.
Abstract
This study synthesized TiO2 nanoparticles using the sol–gel method assisted by heat from Titanium (IV) Isopropoxide. Samples were calcined at 400, 600, and 800 °C, and studied for self-cleaning application. The nanoparticles were characterized using X-ray diffraction (XRD), Scanning electron microscopy (SEM), transmission electron microscopy (TEM), Raman spectroscopy, and UV–vis spectroscopy. A self-cleaning application test was also performed using methylene blue dye as a form of contaminant. The TiO2 nanoparticles showed improved crystallinity with increased calcination temperature and experienced a phase transformation from anatase to rutile after 800 °C calcination. Crystallite size ranged from 5.11 to 24.97 nm for anatase and 15.85 to 24.72 nm for the rutile from the XRD result. Raman spectra showed increased peak intensities with an increase in calcination temperature. The grain size distribution from TEM analysis revealed the particle size with the uniform count at 400 °C and 800 °C than at 600 °C. The bandgap for direct transition was evaluated to be 3.07 eV. The self-cleaning test confirmed that the TiO2 nanoparticles would be effective in self-cleaning applications. The sample that was calcined at 600 °C displayed the highest self-cleaning ability.
Keywords
TiO2
Nanoparticle
Sol–gel
Heat-assisted
Self-cleaning

Abbreviations
- Np
-
Nanoparticles
- SC
-
Self-cleaning
1 Introduction
Self-cleaning is the competence of a surface to rebuff all contaminants without external assistance. Any surface can self-clean if enriched with self-cleaning materials and its contact angle with water droplets regulated (Liu and Jiang, 2012). Materials with self-cleaning properties have found application in textiles (Pakdel et al., 2013), window glass surfaces (Cedillo-González et al., 2020), solar panels (Sakhuja et al., 2014), and water purification (Wang et al., 2020). A self-cleaning mechanism is engineered to be hydrophilic or hydrophobic. The choice of Self-cleaning materials is determined by low cost, durability, chemical and mechanical stability, anti-icing, non-toxicity, and anti-corrosiveness (Guldin et al., 2013). Titanium dioxide (TiO2), as a material, possess most of these properties (Astaneh et al., 2019).
TiO2 self-cleaning capabilities prevent blight and defacement resulting from soiling effects on surfaces because it is highly efficient in photo catalyzing dirt in sunlight (Sarver et al., 2013). It naturally occurs in three distinct crystal anatomies (anatase, rutile, and brookite). TiO2 application is influenced by its morphology, grain size, and crystal phase (Gupta and Tripathi, 2011). The bandgap of TiO2 in the rutile crystal structure is 3.00 eV and is thermally stable. For the anatase and brookite crystal structure, the band gaps are 3.21 and 3.13 eV, respectively, and are thermally unstable (Mutuma et al., 2015). The rutile phase has been extensively applied in a thin film. At the same time, the anatase is employed mostly in photocatalysis and dye-sensitized solar cells due to its effective charge transfer characteristic (Vickers, 2017). TiO2 phases are obtained by controlling set process parameters. The benefits of using nanostructured TiO2 particles is that it quickly decomposes organic compounds and fosters the dissemination of water on the surface to accomplish its self-cleaning cycle (Somasundaram and Kumaravel, 2019). This is possible due to high-energy compactness and quick charge and discharge frequency (Malik et al., 2012).
Enormous research work has been undertaken with TiO2 nanomaterial (Nakata and Fujishima, 2012), and it is often synthesized by the wet chemical technique (Sagadevan, 2013), hydrothermal (Manjunath et al., 2018), the sol–gel (Behnajady et al., 2011), or SILAR methods (Nkele et al., 2020). Nwankwo et al. (Nwankwo et al., 2019) successfully synthesized TiO2 nanoparticles for photocatalytic application using the wet chemical method. However, the wet chemical method and the hydrothermal technique are somewhat complicated and not widespread due to the different chemicals involved and the specific control. Sol-gel synthesis of TiO2 nanoparticles is achieved through hydrolysis and condensation of alkoxide of metals, which eventually progress to metal oxides (Yahaya et al., 2015). However, the hydrolysis process must be critically optimized by supervising the temperature at which it takes place. The molarity of the alkoxide and the acidic content also need control to achieve a homogeneous solution (Hanaor and Sorrell, 2011). The different phases of TiO2 nanoparticles can be obtained or maintained by controlling their temperature (Sawant and Kale, 2020).
Sol-gel synthesis merits include simplicity, low cost, ease of control, and capability to mass-produce nano-scaled particles with extensive surface areas. However, this process has certain limitations, such as loose dispersal of particle proportions and particle clustering. Often surfactants are used to achieve better crystal structures, uniformity, and proportionate distribution of the particles (Kokare et al., 2018). But surfactants are not cheap and not readily available. This study focused on a better temperature-controlled process to obtain consistent and nanocrystalline TiO2 nanoparticles to reduce cost. The as-prepared TiO2 nanoparticles are then tested for self-cleaning application.
2 Experimental procedure
2.1 Chemicals
All chemicals used in this work and their sources are listed in Table 1
Material
Source
Purpose
Titanium (IV) Isopropoxide 97%
Sigma-Aldrich Germany
As the precursor of TiO2
Ethanol 99.9 %
Merck chemicals SA
As the sol–gel solvent
Nitric acid 70 % reagent
Sigma-Aldrich USA
As stabilizing agent
Deionized water
Merck chemicals SA
As sol-hydrolyzing agent
2.2 Synthesis of TiO2 nanoparticles
All obtained chemicals were of analytical grades. The chemical reaction is shown in Equation (1).
Titanium (IV) Isopropoxide 97 % was dissolved in 99.9 % ethanol in a proportion of 1:5 while stirring. After 30 min, acid stock prepared by combining nitric acid with water in a 1: 50 ratio was added to the solution drop by drop while stirring at 500 rpm with a magnetic stirrer. The mixture was further stirred for 2 h at 60 °C for proper hydrolysis. After that, dried in an oven for 24 h at 100 0C to form TiO2 particles. The obtained TiO2 nanoparticles were calcined at 400, 600, and 800 °C for 2 h for temperature optimization. Fig. 1 shows the synthesis process.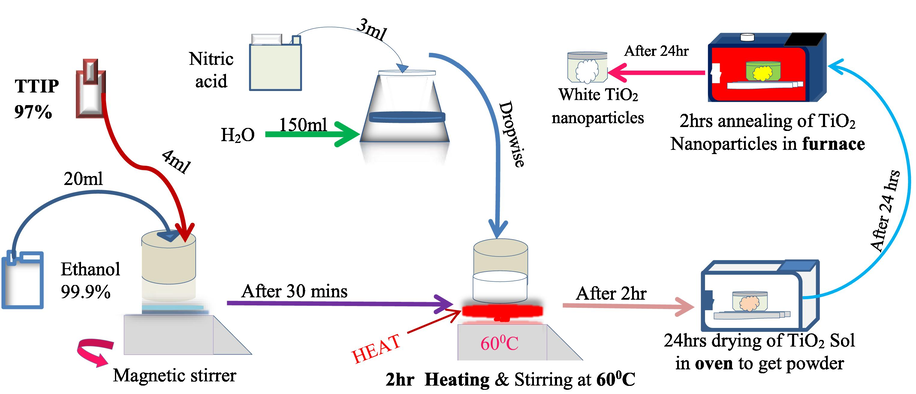
Illustration of TiO2 fabrication steps using heat-assisted sol–gel process.
2.3 Characterization
The TiO2 nanoparticles were characterized for crystal structure using an X-ray diffractometer (XPERT-PRO). The morphologies and elemental composition were examined under the Scanning Electron Microscope (X-MAX VEGA3 TESCAN), JEOL JEM 2100 80 T X-MAX for TEM analysis, and Energy Dispersive X-ray (EDX) Aztec Spectrometer (Oxford Instruments). The grain size was analyzed using ImageJ software. The optical properties were studied in 300 to 1000 nm wavelengths using a UV-2450 (SHIMADZU) spectrophotometer. Raman spectroscopy using thermos-scientific DXR2 SmartRaman, class 1 Laser Product with 532 nm filter, and the self-cleaning test was performed by degrading methylene blue (MB) dye under UV-lamp irradiation (UV EQUIP T5 BLB 40 W and 40 cm in length) for two hours. The test tube was 10 cm deep and mounted 5 cm below the UV lamp throughout the test. The TiO2 catalyst was separated using photovoltaic DF-L 0.22 μm filters, and the methylene blue concentrations were analyzed using a UV-2450 (SHIMADZU) spectrophotometer.
3 Results and discussion
3.1 Morphology analysis
The Morphologies of the TiO2 nanoparticles were studied using SEM, TEM, and EDX. Fig. 2 shows the SEM micrographs and elemental compositions of the prepared TiO2 nanoparticles after the calculations. The SEM images revealed cloudy oval-shaped particles with rough hierarchical structures and agglomeration. As the calcination temperatures increased, the particles increasingly became loose and well exposed in surface area. The result agreed with that obtained by Kokare et al. (2018). The well-exposed surface is desired in the self-cleaning application as it improves absorption. The EDX analysis revealed Titanium (Ti) and Oxygen (O) were the only elements present in higher weight percentages, with no impurity after calcination at 600 and 800 °C, thus confirming purification with heat-assistance.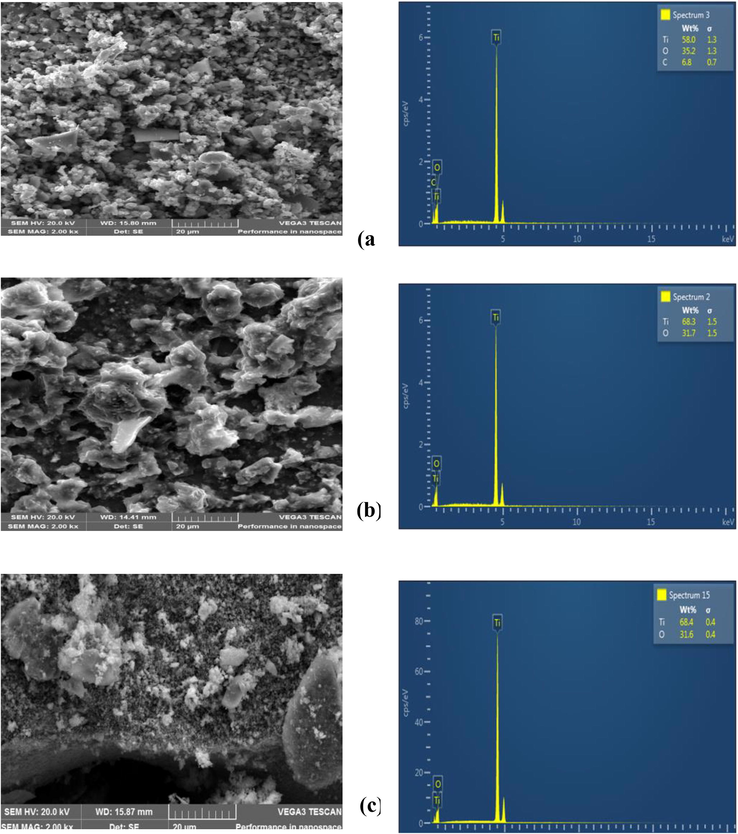
SEM images and EDX analysis of the TiO2 nanoparticles calcined at (a), 400 °C, (b) 600 °C, and (c) 800 °C.
Fig. 3 shows TEM images of the TiO2 nanoparticles at 100 nm magnification for the different calcination temperatures alongside the grain size and the Gaussian distribution function using ImageJ software. The nanoparticles appeared in continuous chains, having long pear-shaped anatomies with visible dark spots. The grain size increased with increasing calcination temperature, with values of 4.59 10.24 and 23.69 nm2 at 400, 600, and 800 °C, respectively.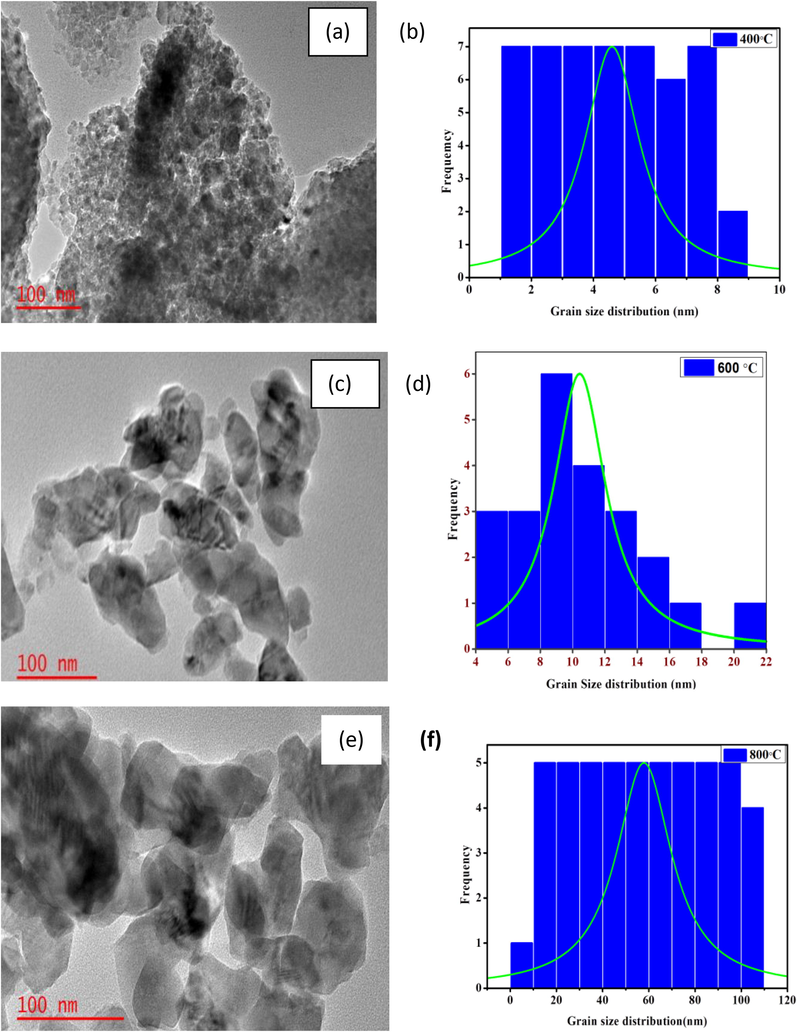
TEM images, with the grain size distribution and Gaussian peak function for TiO2 particles calcined at (a) 400 °C, (b) 600 °C and (c) 800 °C.
The area distribution plot revealed that the particle size had a uniform count at 400 and 800 °C than 600 °C. This could be attributed to the unstable nature of the anatase phase at 600 °C. The fickle nature of the well crystalline anatase phase makes it more photocatalytic and is suitable for the self-cleaning application of TiO2 (Choudhury and Choudhury, 2013).
3.2 Structural analysis
The synthesized TiO2 nanoparticles' structural analysis was studied using XRD and Raman spectroscopy. Fig. 4 shows the XRD patterns of TiO2 nanoparticles after calcination at 400, 600, and 800 °C. The peaks revealed crystallinity improving with an increase in calcination temperature. The solid rutile peaks appearing after annealing at 800 °C indicates that phase transformation from anatase to rutile has occurred. The sample calcined at 600 °C displayed the most prominent anatase peak, which appeared at 2θ equals 25.32° and corresponding to miller index A(1 0 1). The most crystalline anatase phase was obtained at 600 °C while that of rutile was at 800 °C. The long calcination time contributed to the multi-crystalline nature of the nanoparticles after being heat-treated at 600 and 800-°C, due to grain boundaries elimination and improved crystallinity (Valério and Morelhao, 2019). The patterns for 800 °C revealed the most substantial rutile peak at 27.44°, corresponding to hkl plane R(1 1 0) and matching ICDD card 01–072-4821.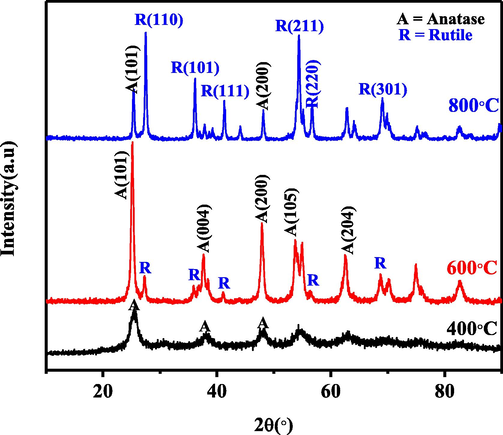
XRD patterns of TiO2 nanoparticles calcined at 400 °C, 600 °C, and 800 °C.
The Debye-Scherrer formula (Chauhan et al., 2012) in Equation (2) was used to determine the average crystallite size.
With β representing full width at half maximum (FWHM) in Radian, λ is the wavelength (nm), θ is Bragg's diffraction angle, and shape constant k is 0.94.
Equations (3) and (4) were used to obtain the distance between parallel atomic planes d and the dislocation density, δ.
The values of the micro strains within the nanoparticles were computed using Equation (5)
(5)
The lattice constants were calculated using Equation (6) (Pratheepa and Lawrence, 2018) and closely approximated the referenced JCPDS card. A(2 0 0) and A(0 0 4) were used as legends for the anatase phase and R(0 0 2) for the rutile
In Table 2, the values computed for the lattice constants (a & c) of the TiO2 nanoparticles for the anatase and the rutile phase are listed for the different calcination temperatures, alongside the crystallite size and other structural parameters.
Calcination Temperature
Crystal phase
hkl
FWHM(°)
2θ(°)
D(nm2)
d(Å)
δ(nm−2)
ε × 10-3
a (Ǻ)
c (Ǻ)
400 °C
Anatase
101
1.6644
25.45
5.11
3.4970
0.0383
32.1600
3.0774
9.4480
600 °C
Anatase
101
0.5509
25.16
15.76
3.5367
0.0040
10.7714
3.7934
9.5110
600 °C
Rutile
110
0.5387
27.33
15.85
3.2606
0.0040
9.6679
4.7756
5.3712
800 °C
Anatase
101
0.3406
25.32
24.97
3.5147
0.0016
6.6161
3.6454
9.9314
800 °C
Rutile
110
0.3455
27.44
24.72
3.2478
0.0016
6.1748
4.0259
2.6859
For anatase, the average crystallite size was 10.48 nm, and for rutile, 20.29 nm, showing more nanostructure than bulk counterparts (Danish et al., 2014). This result affirms grain size obtained using TEM analysis. Enhanced crystal anatase structures offer a large surface area that absorbs solar energy per particle, making it more photocatalytic and suitable for self-cleaning. In addition, well crystalline structures have few crystal defects, implying a high surface-to-volume ratio that minimizes electron-hole recombination rate. More increased annealing temperature also causes phase transition from anatase to rutile. The rutile phase is very stable and less photocatalytic as compared to the anatase phase (Zhang and Li, 2020). Fig. 5 shows standard Raman spectra from 50 to 1200 cm−1 observed for the TiO2 nanoparticles after calcination at different temperatures. The spectra bands confirmed the six Raman modes for anatase TiO2 that occurred around 145.51, 197.50, 396.50, 515.72, and 640.21 cm−1, corresponding to Eg, B1g, A1g + B1g, and Eg. The spectra confirm the XRD result of increasing crystallinity with an increase in calcination temperature (León et al., 2017). This is shown in the significant increases in Raman peak intensities as calcination temperature increases. The broadening of the TiO2 peaks for particles calcined at 600 and 800 °C confirms crystallite size improvement and phase transformation associated with higher temperatures (Rahmati Ali Abad et al., 2020). Fig. 5 (b) shows a zoomed portion of the dual anatase peak and reveals a shift to higher wavenumber and broadening peaks at 600 and 800 °C calcination. This could be influenced by either charge excitation dissemination within the particles, increased crystallite size, or deformation in morphology (Peiró et al., 2001).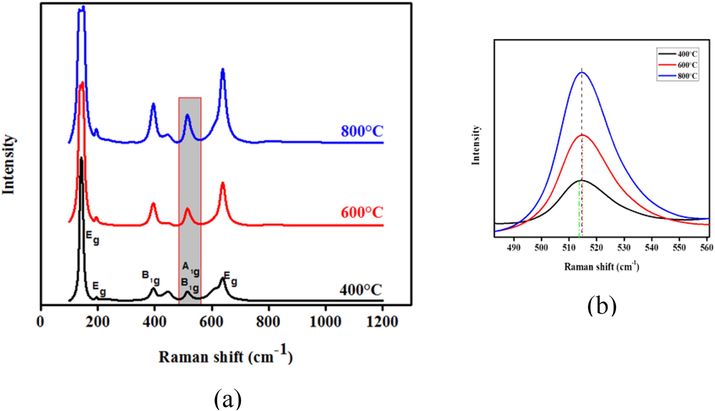
Raman spectra of the TiO2 nanoparticles (a) after calcination at 400, 600, and 800 °C (b) Exact peak position at 515.72 cm-1showing shift to higher wavenumber.
3.3 Optical studies
Fig. 6 shows the UV–vis spectroscopy result of the prepared TiO2 nanoparticles for the sample calcined at 600 °C. The optical bandgap of the nanoparticle was obtained from the Tauc plot against incident light using Equation (7).
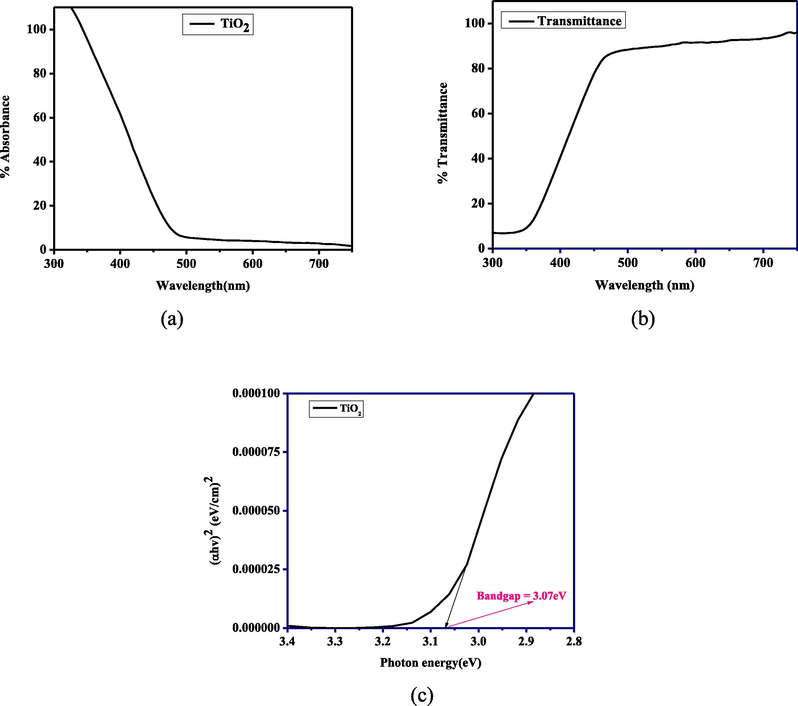
(a) Absorbance spectral, (b) Transmittance spectral, and (c) Tauc plot against incident energy.
3.4 Self-cleaning application test
The TiO2 nanoparticle self-cleaning ability was evaluated using the nanoparticle as a catalyst to degrade methylene blue (MB) dye under UV irradiation. 50 mg of TiO2 nanoparticles was dissolved in 100 ml of 10 ppm MB for the photocatalytic degradation test. Fig. 7(a) gives MB concentration drops with time. Maximum peaks at all concentrations were observed around the wavelength of 663 nm. The TiO2 nanoparticles degraded the methylene blue dye effectively under UV-lamp illumination from 0 to 120mins. Fig. 7(b) shows the percentage depletion of MB by the nanoparticles evaluated from the plot of absorbance efficiency versus time under UV-lamp. At the highest time of 120 min, almost 90% of the MB were degraded by the TiO2 catalyst showing the TiO2 nanoparticles as effective self-cleaning material. This effective photocatalytic activity stems from the increasing active sites of the catalyst. The degradation rate constant for a first-order reaction was obtained from a plot of
against time as shown in Fig. 7(c) using Langmuir-Hinshelwood relation as expressed in Equation (8)
where Ct indicates MB concentration at time t, C0 is the initial concentration of MB under UV irradiation, and k is the rate constant. The slope of a linearly fitted plot of
vs time gave the value of k to be 0.01603 min-1for implying higher photodegradation rates with increased dosage, like that obtained by Prabakaran and Pillay (2019) after doping TiO2 with ZnO. This again indicates that the prepared TiO2 is pure and of high quality.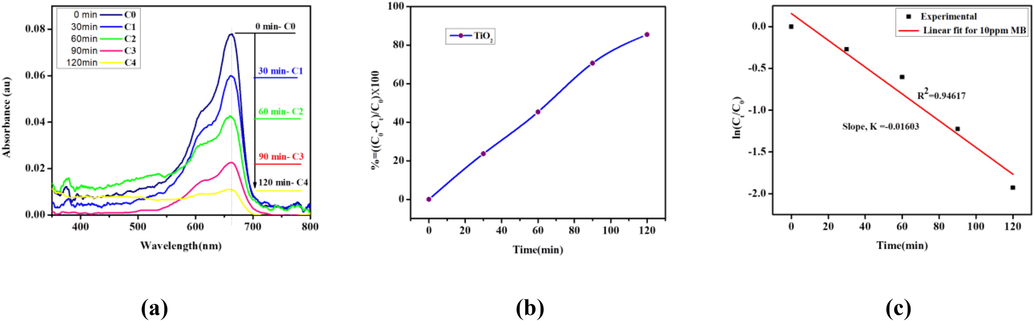
Self-cleaning test (a) Evolution of MB concentrations versus irradiation time of UV-light. (b) Percentage degradation versus time, and (c)
versus time of MB degradation.
4 Conclusion
A simple heat-assisted sol–gel process was used to synthesize TiO2 nanoparticles for self-cleaning application. Synthesized particles were calcined at 400 0C, 600 0C, and 800 0C for temperature optimization and characterized using SEM, TEM, Raman, XRD, and UV–vis spectroscopy analysis. SEM analysis revealed oval-shaped and well-exposed morphologies that encourage high absorption. The grain size from TEM analysis and the crystallite size from XRD patterns showed an increase in size and crystallinity with the calcination temperature. The average crystallite size was 10.48 nm for anatase and 20.29 nm for the rutile phase. Raman spectral analysis showed a significant increase in peak intensity with an increase in calcination temperature. The bandgap was evaluated to be 3.07 eV for direct allowed transition. The general observation is that increasing the annealing temperature improved the photocatalytic properties and thus the self-cleaning ability of the TiO2 nanoparticles. However, at a higher calcination temperature of 800 °C, complete phase transformation to rutile is achieved. This causes a drop-down in the self-cleaning function because the rutile phase is very stable and thus less photocatalytic. Therefore, increasing calcination temperature to a maximum of 600 °C is recommended for TiO2 nanoparticles synthesis for self-cleaning applications.
Acknowledgment
The authors appreciate the funding of NRF and URC of the University of Johannesburg, South Africa.
Declaration of Competing Interest
The authors declare that they have no known competing financial interests or personal relationships that could have appeared to influence the work reported in this paper.
References
- Surface and subsurface film growth of titanium dioxide on polydimethylsiloxane by atomic layer deposition. Appl. Surf. Sci.. 2019;493:779-786.
- [Google Scholar]
- Investigation of the effect of sol–gel synthesis variables on structural and photocatalytic properties of TiO2 nanoparticles. Desalination. 2011;278(1-3):10-17.
- [Google Scholar]
- Self-cleaning TiO2 coatings for building materials: The influence of morphology and humidity in the stain removal performance. Constr. Build. Mater.. 2020;237:117692.
- [CrossRef] [Google Scholar]
- Structural and optical characterization of Zn doped TiO 2 nanoparticles prepared by sol–gel method. J. Sol-Gel Sci. Technol.. 2012;61(3):585-591.
- [Google Scholar]
- Local structure modification and phase transformation of TiO 2 nanoparticles initiated by oxygen defects, grain size, and annealing temperature. Int. Nano Let.. 2013;3(1):1-9.
- [Google Scholar]
- Rapid synthesis of high surface area anatase Titanium Oxide quantum dots. Ceram. Int.. 2014;40(8):12675-12680.
- [Google Scholar]
- Review of the anatase to rutile phase transformation. J. Mater. Sci.. 2011;46(4):855-874.
- [Google Scholar]
- Kokare, A.M., Sutar, R.S., Deshmukh, S.G., Xing, R., Liu, S. and Latthe, S.S., 2018, May. ODS–modified TiO2 nanoparticles for the preparation of self-cleaning superhydrophobic coating. In AIP Conference Proceedings (Vol. 1953, No. 1, p. 100068). AIP Publishing LLC
- FTIR and Raman characterization of TiO2 nanoparticles coated with polyethylene glycol as carrier for 2-methoxyestradiol. Appl. Sci.. 2017;7(1):49.
- [Google Scholar]
- Micro emulsion method: A novel route to synthesize organic and inorganic nanomaterials: 1st Nano Update. Arabian J. Chem.. 2012;5(4):397-417.
- [Google Scholar]
- Ionic liquid assisted hydrothermal synthesis of TiO2 nanoparticles: photocatalytic and antibacterial activity. J. Mater. Res. Technol.. 2018;7(1):7-13.
- [Google Scholar]
- Sol–gel synthesis of mesoporous anatase–brookite and anatase–brookite–rutile TiO2 nanoparticles and their photocatalytic properties. J. Colloid Interface Sci.. 2015;442:1-7.
- [Google Scholar]
- TiO2 photocatalysis: Design and applications. J. Photochem. Photobiol., C. 2012;13(3):169-189.
- [Google Scholar]
- A study on titanium dioxide nanoparticles synthesized from titanium isopropoxide under SILAR-induced gel method: transition from anatase to rutile structure. Inorg. Chem. Commun.. 2020;112:107705.
- [CrossRef] [Google Scholar]
- Synthesis and characterizations of rutile-TiO2 nanoparticles derived from chitin for potential photocatalytic applications. Vacuum. 2019;161:49-54.
- [Google Scholar]
- Self-cleaning and superhydrophilic wool by TiO2/SiO2 nanocomposite. Appl. Surf. Sci.. 2013;275:397-402.
- [Google Scholar]
- Low-temperature deposition of TiO2 thin films with photocatalytic activity from colloidal anatase aqueous solutions. Chem. Mater.. 2001;13(8):2567-2573.
- [Google Scholar]
- Synthesis of N-doped ZnO nanoparticles with cabbage morphology as a catalyst for the efficient photocatalytic degradation of methylene blue under UV and visible light. RSC Adv.. 2019;9(13):7509-7535.
- [Google Scholar]
- X-ray diffraction analyses of titanium dioxide nanoparticles. J. Sci. Res. Sci. Tec. 2018;3:83.
- [Google Scholar]
- Effect of Synthesis Conditions on the Structural, Photocatalic, and Self-Cleaning Properties of TiO 2 Nanoparticles. Phys. Solid State. 2020;62(1):120-130.
- [Google Scholar]
- Synthesis and electrical properties of TiO2 nanoparticles using a wet chemical technique. Am. J. Nano Res. Appl.. 2013;1(1):27.
- [CrossRef] [Google Scholar]
- Outdoor performance and durability testing of antireflecting and self-cleaning glass for photovoltaic applications. Sol. Energy. 2014;110:231-238.
- [Google Scholar]
- A comprehensive review of the impact of dust on the use of solar energy: History, investigations, results, literature, and mitigation approaches. Renew. Sustain. Energy Rev.. 2013;22:698-733.
- [Google Scholar]
- Surfactant mediated TiO2 photoanodes and Cu2ZnSnS4 counter electrodes for high efficient dye sensitized solar cells. Mater. Lett.. 2020;265:127407.
- [CrossRef] [Google Scholar]
- Application of Nanoparticles for Self-Cleaning Surfaces. In: Emerging Nanostructured Materials for Energy and Environmental Science. Cham: Springer; 2019. p. :471-498.
- [Google Scholar]
- Valério, A. and Morelhao, S.L., 2019. Usage of Scherrer's formula in X-ray diffraction analysis of size distribution in systems of monocrystalline nanoparticles. arXiv preprint arXiv:1911.00701.
- Animal communication: when i’m calling you, will you answer too? Curr. Biol.. 2017;27(14):R713-R715.
- [Google Scholar]
- Robust superhydrophobic mesh coated by PANI/TiO2 nanoclusters for oil/water separation with high flux, self-cleaning, photodegradation and anti-corrosion. Sep. Purif. Technol.. 2020;235:116166.
- [CrossRef] [Google Scholar]
- Centrifuge and storage precipitation of TiO2 nanoparticles by the sol–gel method. J. Alloy. Compd.. 2015;651:557-564.
- [Google Scholar]
- High Temperature Stable Anatase Phase Titanium Dioxide Films Synthesized by Mist Chemical Vapor Deposition. Nanomaterials. 2020;10(5):911.
- [Google Scholar]


