

Translate this page into:
Growth performance of poultry in relation to Moringa oliefera and Azadirachta indica leaves powder
⁎Corresponding author.
-
Received: ,
Accepted: ,
This article was originally published by Elsevier and was migrated to Scientific Scholar after the change of Publisher.
Peer review under responsibility of King Saud University.
Abstract
The current study was directed to examined the two excellent herbal plants Azadirachta indica and Moringa oliefera leaf powder as an alternative to antibiotic growth promoters on the growth performance in terms of (FC, LWW, BWG, FCR and mortality rate), blood biochemistry (WBC, RBC, MCHC, MCH, MCV, LYM, GRA, MID and HCT) and carcass characters weight performance (Carcass Components, Yield of Main Carcass Parts (%), Giblets weight (%) and visceral organs weight (g). Feed conversion ratio measured is significantly (p < 0.05) different in treated groups and in the control group. Highest FCR was recorded in control group as compared to supplementary groups. Low FCR recorded in treated groups show significant (p < 0.05) results. The CBC analysis of the supplementary treatments and the control group show significant (p < 0.05) differences in WBC, RBC, MCHC, MCH, MCV, GRA and LYM. Treated groups had higher concentration of these parameters than the control groups but non-significant results obtained in terms of HGB, MID and in HCT concentrations. Carcass Characters show significant (p < 0.05) differences in the Carcass Components, Giblets Weight and in Visceral Organs Weight in supplementary treated groups as compared to control group.
Keywords
Neem
Moringa
Growth
Effect

1 Introduction
A well-secure diet is that provides ample health, growth and development. To ensure that all essential nutrients are consumed, food must contain a wide variety of ingredients. We need to fodder the bodies with energy, standard amino acids, and a variety of minerals and vitamins to stay healthy. For sustaining appropriate balance of nutrient intake every culture involves intake of a mixture diet that can’t be attained from single food ingredient consumption. The consumption of meat and human health association is multidimensional. Broilers are dictating the sphere in last recent decades due of high demand of broiler meat and eggs. Meat of chicken is vital component of a fit and well balanced diet because of multiple nutritional richness with sensible contented energy, vastly edible proteins of good nutritional worth, minerals (Cu, Fe, and Zn), lipids mainly unsaturated (that are found in the skin and are easily removed), B-group vitamins (mostly Vit B6, pantothenic and thiamin) (Samanta et al., 2018; Aashaq et al., 2019). Poultry meat is the most proficient and economical converter of vegetable food into animal protein. The easiest and cheapest spring to harvest protein is chicken (Udoh and Etim, 2007; Alam et al., 2015).
They are highly desired by the many millions of people who live in paucity and play critical roles in the global fight against hunger. Broiler production has evolved into a significant economic activity with a wide range of business interests, including broiler production, egg production, hatcheries, and poultry equipment business (Padhi, 2016). The poultry farming is gainful mainly because it necessitates less space for rearing and breading, quick returns of investment, (Oluyemi and Roberts, 1979) higher weight gains, feed mills springing up and its publication age is smaller (Tipu et al., 2006) (Table 1).
Sr. No
Groups Name
Feed %
1
Treatment-T1
Untreated control group
2
Treatment-T2
1.5 %Neem + 5 %Moringa
3
Treatment-T3
2.5 % Neem + 5 % Moringa
4
Treatment-T4
3.5 % Neem + 5 % Moringa
Pakistan's poultry industry contributes significantly to closing the supply–demand gap. The poultry industry is in good health and is in high demand, particularly in developing countries like Pakistan. It accounts for 26.8 % of Pakistan's total meat production. More than 1.5 million people in Pakistan benefit from the poultry industry, which employs them and provides them with a source of income. Over 20,000 poultry farms can be found in rural areas across the country (Gadde et al., 2017).
Chickens are classified as class Aves, Galliformes order, Phasianidae family and genus Gallus. The general morphological characteristics of class Aves include feathers, vertebral column, light weight bones, and horny bill with the exception of teeth. Their major characteristics include increased metabolic rate and endothermic nature. Chickens are omnivores, and modern broilers are fed a high-protein diet that is normally delivered by an automated feeding system. Four to seven weeks of broilers attain two kilogram weight and sometimes take fourteen weeks to reach the slaughter weight due to slow growth rate capacity. It's critical to get enough nutrition to get the most out of your workout (Biosci et al., 2013).
Many countries and farms have placed restrictions on the use of AGP for these reasons. Monensin, sodium, salinomycin sodium, avilamycin, flavophospholipol, and other widely used feed antibiotics have been banned by the European Commission (Marzo, 2001; Halfhide, 2003; Botsoglou et al., 2003; Belal et al., 2018). Nutritionists used to alternate the AGP to solve the problem and reduce the use of antibiotics because of the restriction on AGP (El-bashier and Ahmed, 2016; Swain et al., 2017; Mashayekhi et al., 2018). The prohibition on synthetic feed additives has prompted extensive research into alternative strategies for maintaining health and performance in intensive poultry production systems. Antibiotics may be replaced by enzymes, probiotics, prebiotics, immune stimulants, organic acids, phytobiotic stimulants, organic acids, and some herbs, medicinal plants, and spices (Windisch et al., 2008; Vijayasteltar et al., 2016). Ethno-veterinary medications, herbs and outmoded or native plants have long been used for body and mind bolstering due to their numerous benefits (Rios and Recio, 2005; Mirzaei-Aghsaghali, 2012). Remedial foliage are a valuable wellspring of constituents that are said to stimulate immunomodulation nonspecifically such macrophages, as natural killer cells, granulocytes and complement functions (Mirzaei-Aghsaghali, 2012).
These alternatives have proven to be natural, less hazardous, and residue-free feed additives in the foodstuff animal trade. They have a good influence on the health and growth of animals (Ayden et al., 2020). They have cheaper production costs, lesser toxicity risks, and fewer health dangers. Also the reduction in the death rate, by increasing feed efficiency, enhanced immunity, enhancing livability and by increasing the weight gain in broiler chicken has also showed promising outcomes (Kumar, 1991). They have hunger and feed intake stimulation, improved endogenous digestive enzyme secretion, immunological response activation, antibacterial, antioxidant, antiviral, and anti-helminthic activity. Innumerable herbal products in the poultry provisions like Moringa, Neem, Black pepper, Ginger, Peppermint, Cardamom, Cumin, Anise, Aloe Vera, Eucalyptus, Tulsi, Cloves and many others are being used as growth promoters (Chowdhury et al., 2018). These herbal formulations due to their medicated properties do not have any residual possessions (Tipu et al., 2006).
Neem (Azadirachta indica) belongs to the family Maliaceae, is a tropical plant tree that is growing fastly, extensively dispersed and accessible throughout the year (Kabeh and Jalingo, 2007; Koona and Budida, 2011; Ogbuewu et al., 2011) in poor locations, even in poor yellow, rocky, and sandy soils where agricultural crops produce low yields (Ogbuewu et al., 2011). Neem has a significant number of physiologically active chemicals that are both chemically and structurally varied. From various portions of the neem plant, more than 140 chemicals have been identified. Seeds, Roots, Flowers, bark, and especially leaves of the neem tree have long been used as an antidote for infection, fever, inflammation, as for dental disorders, and skin diseases (Durrani et al., 2008). The tree is ideally suited to the tropical rainforest's climatic and soil requirements. The leaves of the Neem plant have a garlic-like odor and a bitter flavor. The neem plant's appeal stems from the fact that it is an inexpensive herbal plant that is non-toxic to both animals and people, as well as helpful in contradiction of malaria. Azadirachta indica leaves also contain chemicals that have been shown to have antibacterial assets (Makeri et al., 2007; Wikipedia, 2007; Valarmathy et al., 2010). Extracts of neem leaves have been shown to have antibacterial activity counter to bacteria for example Escherichia coli, Pseudomonas, Staphylococcus and Streptococcus species as well as several fungal strains (Valarmathy et al., 2010; Koona and Budida, 2011).
Moringa oleifera locally called Sohanjna belong to Moringaceae family and Moringa genus (Qaiser et al., 1973), that is commonly grown in Pakistan's Punjab and Sindh provinces. Drumstick tree and horseradish tree are two common names for Moringa used as various function such as food and has a variety of agricultural submissions, in animal feeding, industrial and in medicinal applications. Moringa comes in fourteen different species. It is grown throughout the tropics. It is a wild-emergent tropical perennial plant that ranges a 7–12 m of height.
The Moringa tree, sometimes known as the Miracle Tree, has a wide range of medical applications due to its hypocholesterolemic qualities. Leaf of Moringa oleifera have protein level ranged from twenty to twenty-three percent dry weights and is of excellent grade (Foidl and Paull, 2008). With certain important amino acids, vitamins, minerals, high concentrations of necessary nutrients, fatty acids, and fiber with good potential as antioxidants, the ease of establishment is both nutritional and medical, firming up the immunity. Almost all components of this plant, including the gum, seed, seed oil, root, fruit, bark, and especially the leaves, are edible and have been used in traditional human diet. It's used for a variety of things. In indigenous medicine, it is used to treat a variety of maladies, including inflammation and viral infections, as well as haematological, gastrointestinal, cardiovascular, and hepatorenal issues. Beta-carotene, protein, vitamin C, magnesium, iron, calcium and copper are all abundant in moringa leaves (Yang et al., 2006). Keeping in the view of Neem, Moringa and indeed chicken this study was planned to know the effect of these botanicals on different parameters of the growth of chicken.
2 Material and methods
The purpose of the current study was to evaluate the effect of Azadiratcha indica and Moringa oliefera leaf powder on growth performance and blood haemotology of broiler chicken. The leaves of Azadiratcha indica and Moringa oliefera were mixed with the basal diet of the broiler chicken.
2.1 Collection and preparation of leaves
Supplemented feed was chosen for its ability to lift growth in broiler chickens. Moringa (M) and Neem (N) fresh leaves that were mature and disease-free were taken from neighboring village trees. These leaves were rinsed in clean drinking water before being laid out to dry on sheets. The dried leaves were collected after ten days in the sun. The stem component of the leaves was separated from the dried leaves. The leaves were crushed by hand and then saved as stock to be ground later. After all of the leaves had dried, a hammer mill was used to ground them into a fine granular powder.
2.2 Experimental birds
A total of two hundred (2 0 0) vaccinated four-day-old broiler chicks were procured from commercial and Breading Hatchery farms of Multan. After arriving, the chicks were numbered and handled with care. Their original body weight was measured by a weight machine before they were placed in wood crates. Three weeks of acclimatization were given to the chicks (21 days). 25-day old chicken of uniform body weight were subjected to varying conc. of Neem and Moringa separated into four groups with respect to different conc. of (N) and (M) per group after a 3-week acclimatization period.
2.3 Experimental design
To verify the effect of Neem and Moringa leaf powder has any effect on broiler chickens. The chicks were allocated into four major groups and with their triplicates were labeled (T1, T2 T3 and T4). Each treated group received three (15-chicks) sessions (9 treatments). For 35 days of testing, group T1 was deemed as control with no supplements of (N) and (M) fed only basic fodder wheat, rice, and millet, while the treatments T2, T3 and T4 were supplemented with Moringa (M) and Neem (N) at varied percentage rates added in to the drinking water in addition to basic feed. The feed was applied according to the Dera Ghazi Khan veterinary hospital standard scale in broiler chicks as shown in feed intake chart tables given below.
2.4 Management procedures
The proper supply of water, food, light, temperature, cleanliness, and survivorship were monitored and recorded for thirty-five days of age on a daily basis for the management of the experimental setup. A thermometer was used to record the room temperature (°C) every-six hours to maintain the arrangement. To increase the feed intake and for the body growth light was provided in the broiler chamber at night. The light was provided on 24 h a day during the first two weeks of age. Following that, 22 h of light and 2 h of darkness were set. Rice husk was applied at 3 cm of depth for litter management. During 2nd week of age, top surface infestations of the clutter were removed, and in place new were supplied as needed. Food and clean, fresh water were provided to the birds. For 15 birds, each box featured a feeder and a round drinker. Drinkers were cleansed every day, whereas feeders were cleaned once a week. Ventilation is required to remove toxic gases from the farm birds. Room windows contribute in the ventilation process. The elimination of gases is aided by cross ventilation. As a result, thorough sanitary procedures were implemented throughout the whole testing period. Disinfectant was used to clean the house where the experimental birds were kept.
2.5 Data collection and recording
Feeding efficiency in terms of feed intake (FI), feed consumption (FC), feed repulsion (FR), and mortality were measured daily for broiler chick growth performance. Calculations of the body weight gain (BWG) and the feed conversion ratio (FCR) were done on weekly basis. In the experimental trial, blood samples were taken twice for blood profile examination. At the conclusion of the experiment, the specimens were slaughtered using the Halal technique to determine the weight of the bodily organs.
2.6 Analyses
2.6.1 Body weight gain (BWG)
For the measuring of average weekly live weight gain, the live weekly weight is subtracted from the initial live body weight of broilers. Final average weight gain was determined by the subtraction of live weekly weight from the previous weekly weight.
Average weekly live body weight gain = Final live weekly weight – Initial weight.
2.6.2 Feed consumption (FC)
Feed consumption was determined by the subtraction of total applied feed or feed intake from the total repelled feed in each group by the broilers on daily basis. Weekly feed consumption was calculated by the sum of seven days consumed feed by the broilers in each group.
Feed Consumption = Feed Intake - Feed Repulsion.
2.6.3 Feed conversion ratio (FCR)
The total gain of average weekly weight by the broiler divided by the feed consumed in each group is equal to the feed conversion ratio of the broilers. FCR was calculated on weekly basis during the experimental setup.
Feed Conversion Ratio (FCR) = Total Feed Consumption (TFC) /Weight Gain (WG) in each group.
2.7 Carcass measurements
To determine the dressing percentage of broiler chicken, one chick from each group were chosen at random and slaughtered on the 35th day of life. Fasting for up to 10 h was required of all murdered birds, however fresh drinking water was provided to guarantee appropriate bleeding. All live birds were weighed again before killing using a digital weight machine. Chicks were killed by single notch with a sharp blade and leaving them to bleed out entirely for some time. By the help of scissor and with the hands the outer skin of the broiler chicken was removed. The carcass components, the giblets and the internal visceral organs were removed then weighed by weight machine and recorded. The dressing percentages was determined by the dressed carcass weight divided by the live weight multiplication with hundred. And the yield of main carcass parts percentages also the giblets percentages were determined by the total live weight of these parts divided by live weight and multiplied by hundred.
Dressing (%) = Dressed Carcass Weight/Live Weight*100.
Yield of Main Carcass Parts (%) = Live Weight of Carcass Parts (g) / Total Live Weight*100.
Giblets (%) = Giblets Live Weight (g)/Total Live Weight*100.
2.8 Statistical analysis
The data was subjected to statistical analysis by applying one way analysis of variance ANOVA using SSPS. To compare the statically means DMR test was applied. The significance was set as P < 0.05.
3 Results
The results of this study with its statistical explanations are demonstrated and discussed in this chapter.
3.1 Weekly feed consumption (WFC)
Feed consumption during the 1st week was significantly (p < 0.05) different in all the different groups. Group-T2 and T3 had equal concentration of FC (754 ± 1.52a), (755.66 ± 1.201a) respectively, and higher than other supplementary groups and control group, T1 had higher FC (716.66 ± 0.88b) than T4 (656 ± 1.52c) but lowered than T2 and T3. Lowered value of FC was seen in T4 comparison with other groups (Fig. 1).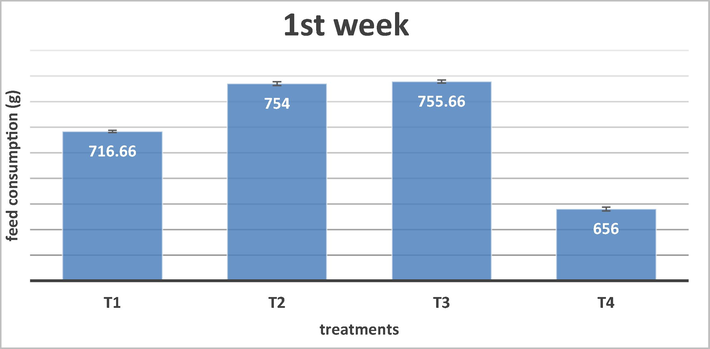
Representing Mean Comparison for Feed Consumption in 1st week (22–28 days) by the Supplementation of Azadirachta indica and Moringa oliefera leaf powder.
Feed consumption during 2nd week significantly (p < 0.05) different in different treated groups. By the mean comparison of FC in 2nd week of experimental setup was significantly (p < 0.05) different in different supplementary groups. T3 had higher FC (1017.33 ± 1.45a) in comparison with T1 and other treated groups T2 and T4 (927.33 ± 1.20c), (967.66 ± 1.45b), (741.66 ± 1.52d). T2 had higher FC from T1 and T4 but lowered than T3. Higher FC was in T1 than T4 but lowered from T2 and T3 (Fig. 2).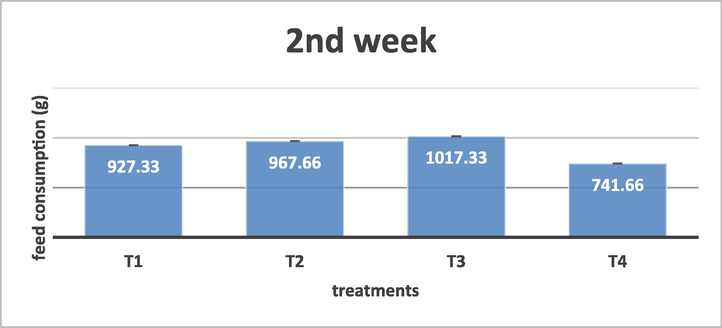
Representing Mean Comparison for Feed Consumption in 2nd week by the Supplementation of Azadirachta indica and Moringa oliefera leaf powder.
During 3rd week feed consumption significantly (p < 0.05) different in all the treated groups and in control group. T1 group consumed higher amount of feed (1238.66 ± 1.45a) than all other treated groups. Feed consumed in supplementary groups T2 and T3 was equal (1204.33 ± 0.88b), (1204 ± 1.52b) and higher than T4 but lowered from T1 control group. Group T4 had lowered FC in comparison with others (Fig. 3).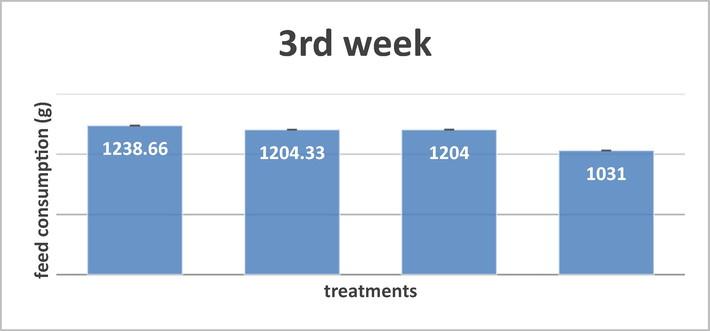
Representing Mean Comparison for Feed Consumption in 3rd week by the Supplementation of Azadirachta indica and Moringa oliefera leaf powder.
Different supplementary groups in 4th week showed differences significantly (p < 0.05) in FC. Higher FC was seen in T2 group (1680 ± 1.52a) in comparison with T3, T1 and T4 (1630.66 ± 1.201b), (1535.33 ± 1.201c), (1186 ± 0.57d) respectively. Group T3 showed differences with T1 and T4. Group T1 had higher FC than T4 but lowered than T2 and T3. T4 had lowered FC than all other treated groups and from control (Fig. 4).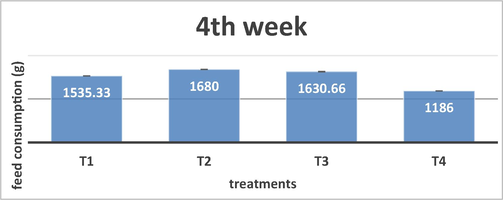
Representing Mean Comparison for Feed Consumption in 4th week by the Supplementation of Azadirachta indica and Moringa oliefera leaf powder.
In 5th week the feed consumption shows significant (p < 0.05) differences in all treated groups. Mean fig. of 5th week showed the feed consumed by the groups at different ranges and show differences in all the groups. Group T2 show higher FC (2163.33 ± 1.20a) than T1, T3 and T4 groups (2115.33 ± 1.45b), (2105.66 ± 0.88c), (1702.33 ± 1.45d) respectively. Higher FC was seen in T1 than T3 and T4 but lowered than T2. In addition, T3 had higher values of FC than T4 but lowered than the T2 and T1 (Fig. 5).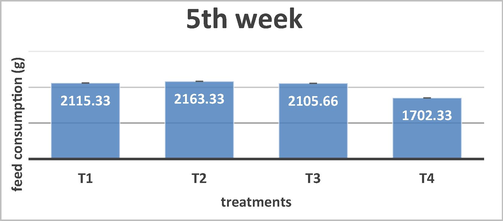
Representing Mean Comparison for Feed Consumption in 5th week by the Supplementation of Azadirachta indica and Moringa oliefera leaf powder.
3.2 Weekly live weight (g)
There were significant (p < 0.05) differences was seen in first week of treatment. Mean comparison indicate that T3 had higher weekly weight (545.93 ± 1.70a) in respect to T4 (531.79 ± 1.3b) and T2 (524.93 ± 1.09c) treatment groups also from T1 (505.36 ± 1.47d). There were higher weekly weight seen in group T4 than T2 and T1 but lower than T3. In addition, there were higher live body weight seen in T2 with respect to T1 but had lowered weekly weight than T3 and T4. Control group T1 had lowered live weekly weight than all the treated groups (Fig. 6).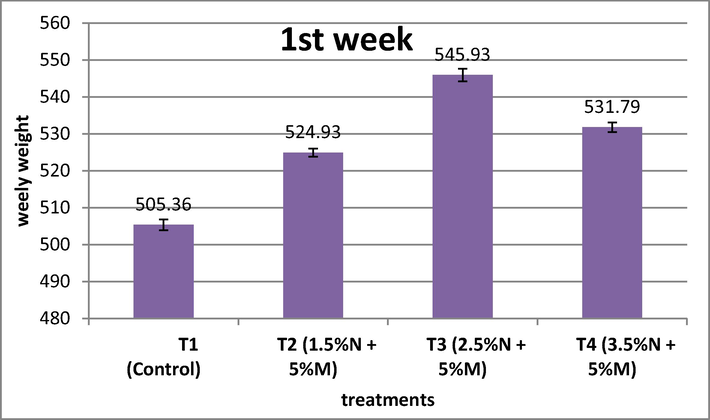
Representing Mean Comparison for live weekly weight by in 1st week the Supplementation of Azadirachta indica and Moringa oliefera leaf powder.
During the 2nd week of experiment, there were significant (p < 0.05) differences seen in second week of treatment Mean Fig 4. 7 of treatments indicate that T3 had higher weekly weight (908.53 ± 1.71a) in respect to T4 (888.7 ± 1.19b) and T2 (855.67 ± 0.83c), T1 (816.33 ± 1.25d) groups. There were higher weekly weight seen in group T4 than T2 and T1 but lower than T3. Higher live body weight was seen in T2 with respect to T1 but had lowered weekly weight than T3 and T4. Control group T1 had lowered live weekly weight than all the treated groups (Fig. 7).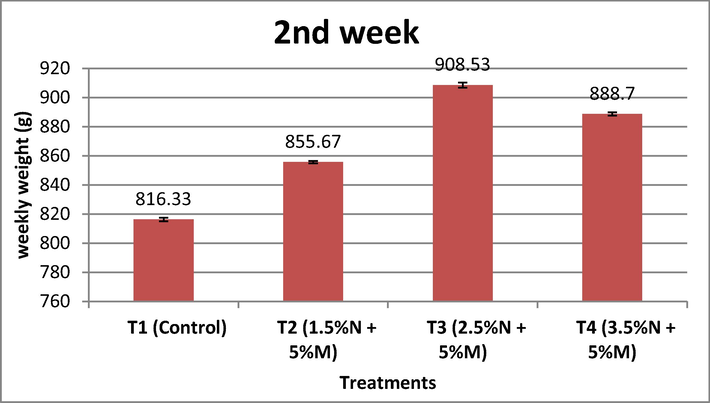
Representing Mean Comparison for live weekly weight in 2nd week by the Supplementation of Azadirachta indica and Moringa oliefera leaf powder.
During the 3rd, there were significant (p < 0.05) differences were seen. Mean Fig. of treatments indicate that T3 had higher weekly weight (1350.90 ± 0.80a) in respect to T4 (1319.86 ± 0.80b) and T2 (1274.43 ± 1.33c), T1 (1213.3 ± 1.38d) groups. There were higher weekly weight seen in group T4 than T2 and T1 but lower than T3. Higher live body weight seen in T2 with respect to T1 but had lowered weekly weight than T3 and T4. T1 had lowered live weekly weight than all the treated groups (Fig. 8).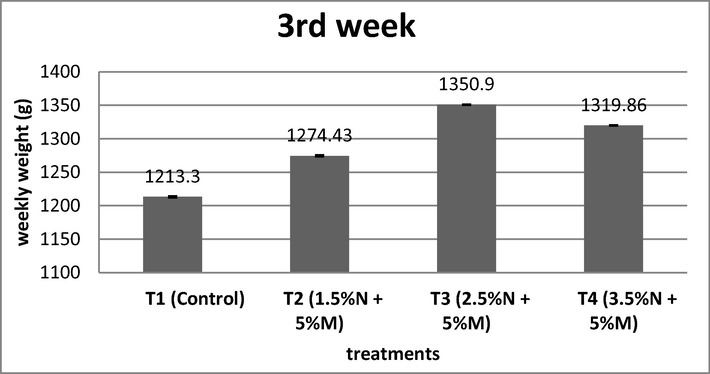
Representing Mean Comparison live weekly weight in 3rd week by the Supplementation of Azadirachta indica and Moringa oliefera leaf powder.
There were significant (p < 0.05) differences seen in fourth week of treatment. Mean Fig. of treatments indicate that treatment T3 had higher weekly weight (1953.66 ± 1.68a) in respect to T4 (1922.08 ± 0.69b) and T2 (1849.32 ± 1.67c), T1 (1713.40 ± 1.42d) groups. There were higher weekly weight seen in group T4 than T2 and T1 but lower than T3. Higher live body weight seen in T2 with respect to T1 but had lowered weekly weight than T3 and T4. T1 had lowered live weekly weight than all the treated groups (Fig. 9).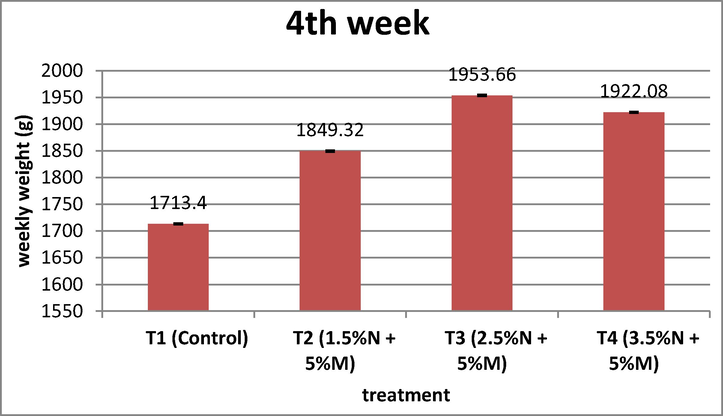
Representing Mean Comparison live weekly weight (g) in 4th week by the Supplementation of Azadirachta indica and Moringa oliefera leaf powder.
The table show that there were significant (p < 0.05) differences seen in fifth week of treatment. Mean comparison of the fifth week of treatment indicate that T3 had higher weekly weight (2736.95 ± 0.95a) in respect to T4 (2692.75 ± 1.49b) and T2 (2614.55 ± 1.47c), T1 (2464.25 ± 0.67d) groups. There were higher weekly weight seen in group T4 than T2 and T1 but lower than T3. T2 had higher weight than T1, but had lowered weekly weight than T3 and T4. T1 had lowered live weekly weight than all the treated groups. As conclusion it indicate that weekly live weight of T3 was higher in from all treatment groups and from the control group in all (five) weeks of trial period (Fig. 10).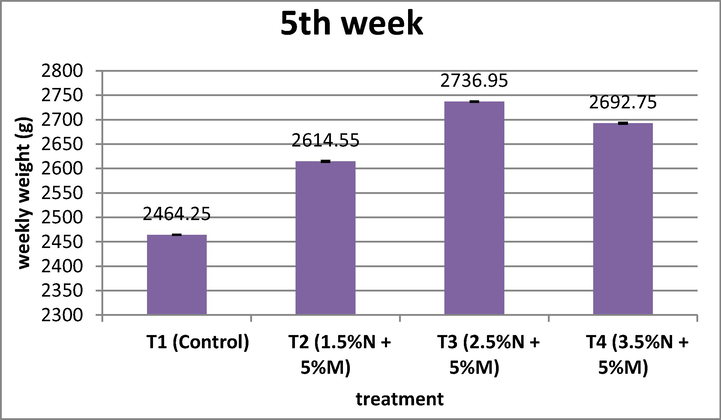
Representing Mean Comparison for live weekly weight in 5th week by the Supplementation of Azadirachta indica and Moringa oliefera leaf powder.
3.3 Average mean weight gain (g)
During the 1st week the Average body weight gain shows difference significantly (p < 0.05) with all treated groups and with control group. Group T3 (274.006 ± 2.13a) had higher weight gain in first week in respect to other treated groups T2, T4 (252.29 ± 0.24c), (259.69 ± 0.59b) and T1 (235.29 ± 0.88d). Group T4 had higher body weight gain than T1 and T2 but lowered than the T3. Likewise, T2 had higher body weight gain than T1, on the other hand had lowered body weight gain from all other treated group (Fig. 11).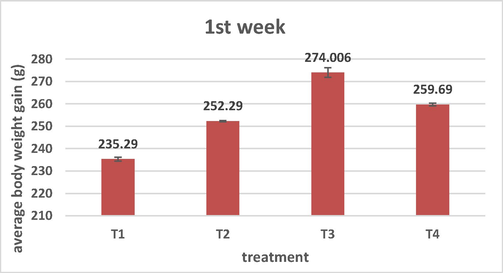
Representing Mean Comparison for average body weight gain in 1st week by the Supplementation of Azadirachta indica and Moringa oliefera leaf powder.
During the 2nd week the Average body weight gain significantly (p < 0.05) different with all treated groups and with control group. Group T3 (362.6 ± 0.53a) had higher weight gain in second week than groups T2 (330.74 ± 1.14c), T4 (356.90 ± 2.51b) and T1 (310.96 ± 0.54d). Group T4 had higher body weight gain than T1 and T2 but lowered than the T3. T2 had higher body weight gain than T1 and had lowered body weight gain than all other treated group (Fig. 12).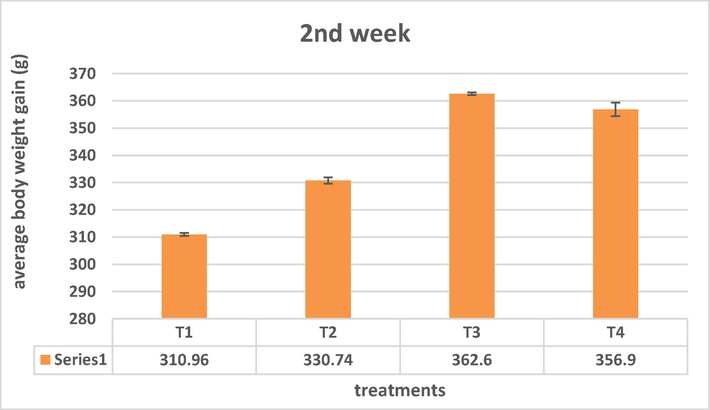
Representing Mean Comparison for average body weight gain in 2nd week by the Supplementation of Azadirachta indica and Moringa oliefera leaf powder.
During the 3rd week the Average body weight gain significantly (p < 0.05) different with all treated groups and with control group. Mean comparison indicate that the Group T3 (442.37 ± 2.45a) had higher weight gain in third week in comparison with other treated groups T2 (418.76 ± 0.83c), T4 (431.16 ± 1.61b) and T1 group (396.96 ± 1.94d). Group T4 had higher body weight gain than T1 and T2 but lowered than the T3. T2 had higher body weight gain from T1 on the other hand have lowered body weight gain from all other treated groups (Fig. 13).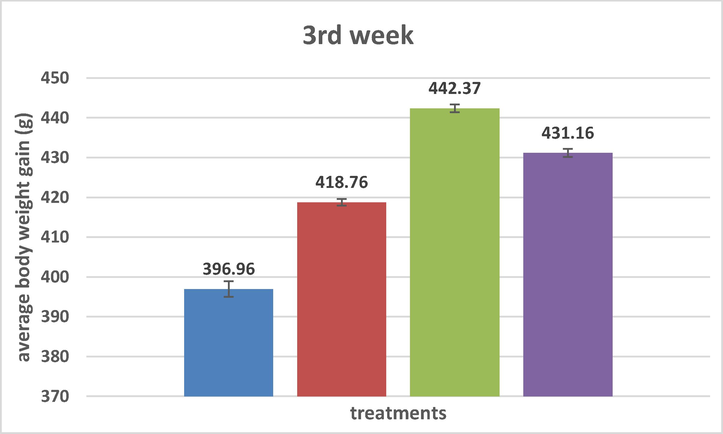
Representing Mean Comparison for average body weight gain in 3rd week by the Supplementation of Azadirachta indica and Moringa oliefera leaf powder.
During the 4th week the Average body weight gain significantly (p < 0.05) different with all treated groups and with control group. Group T3 (602.75 ± 1.11a) and group T4 (602.21 ± 1.49a) were equal to each other and have same body weight gain with an addition, had higher weight gain in comparison with other treated groups T2 (574.60 ± 2.79b) and T1 (500.10 ± 1.18c). Group T2 had higher body weight gain than T1 but lowered than the T3 and T4. Control T1 on the other hand had lowered body weight gain from the other entire treated group (Fig. 14).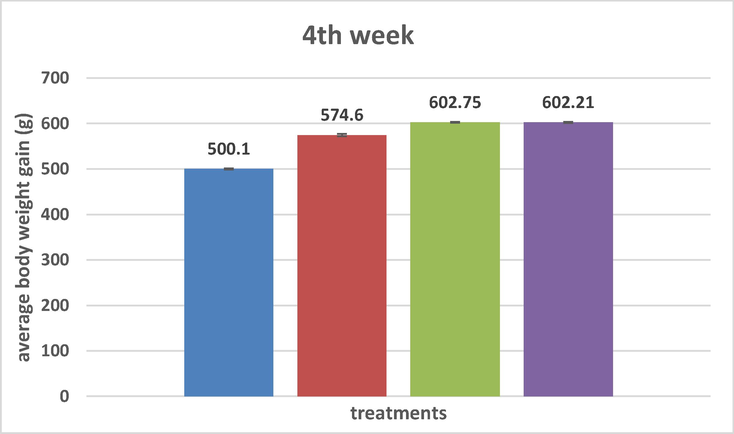
Representing Mean Comparison for average body weight gain in 4th week by the Supplementation of Azadirachta indica and Moringa oliefera leaf powder.
During the 5th week the Average body weight gain was significantly (P < 0.05) different in all treated groups. Group T3 (783.28 ± 1.81a) show the highest body weight gain from other supplement groups T2 (765.51 ± 2.33b) and T4 (770.67 ± 0.81b) and T1 (750.85 ± 2.07c). Mean of average body gain indicate that T2 and T4 had equal body weight gain and were higher from T1 but lowered from T3. Control T1 had the lowest body weight gain during the fifth week of trial (Fig. 15).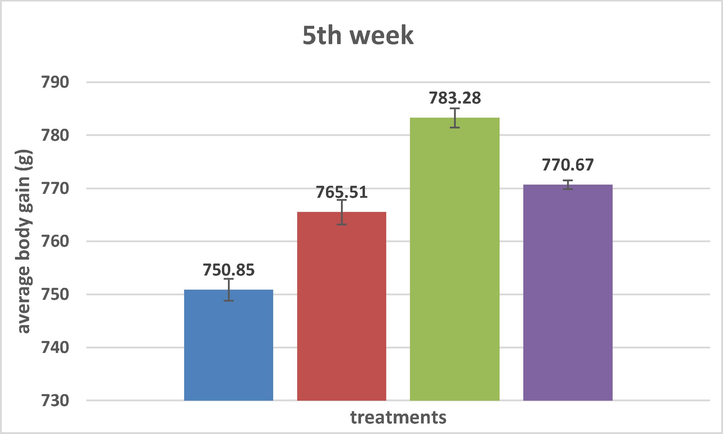
Representing Mean Comparison for average body weight gain in 5th week by the Supplementation of Azadirachta indica and Moringa oliefera leaf powder.
3.4 Feed conversion ratio (FCR)
Feed Conservation Ratio of 1st week had the high significant (P < 0.05) differences among the treated groups. In the first week of the mean comparison of FCR, the T1 (3.04 ± 0.01a) had the high value of FCR than T2 (2.98 ± 0.006b), T3 (2.75 ± 0.017c) and T4 (2.52 ± 0.0009d). And T2 had lower FCR value than T1 but higher than (T3, and T4). Group T3 had lower FCR than T1 and T2 but greater than T4. Group T4 had lower FCR than other treated groups (T1, T2 and T3) (Fig. 16).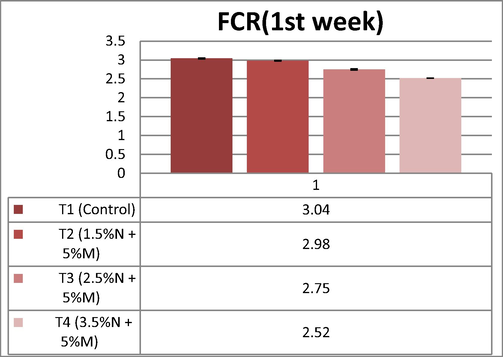
Representing Mean Comparison for FCR (1st week) by the Supplementation of Azadirachta indica and Moringa oliefera leaf powder.
Feed Conservation Ratio had highly significant (p < 0.05) differences in all the treated groups. By mean comparison the FCR had different values T1 (2.98 ± 0.0057a) had higher values than T2 (2.92 ± 0.012b), T3 (2.80 ± 0.0017c) and T4 (2.07 ± 0.017d) respectively. Group T2 had lower FCR than group T1 but greater than T3 and T4. And in T3 had lower FCR than T1 and T2 groups but greater than T4 and in addition, T4-group had lowered FCR than from all other supplementary groups (T2, T3 and T1) (Fig. 17).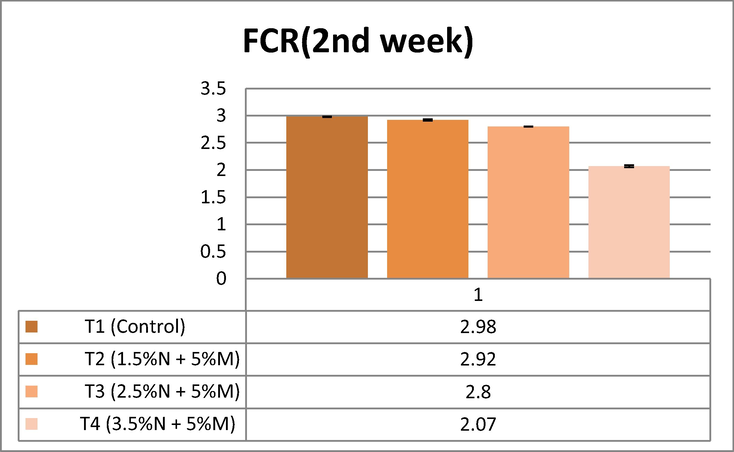
Representing Mean Comparison for FCR 1st week (22–28 days) by the Supplementation of Azadirachta indica and Moringa oliefera leaf powder.
Feed Conservation Ratio (FCR) of the third week shows the highly significant (P < 0.05) differences among all the treated groups. The mean of the third week had different values of FCR in dietary treatments T1, T2, T3 and T4 which are different from each other. FCR of T1 (3.120498 ± 0.0175a) was greater than T2 (2.87 ± 0.007b), T3 (2.72 ± 0.013c) and T4 (2.39 ± 0.01d) respectively. FCR of T2 group had greater results than T3and T4 but lower than T1 and the FCR of T3 is lower than T1 and T2 but greater than T4. Group T4 had lower FCR than from all T1, T2 and T3 groups (Fig. 18).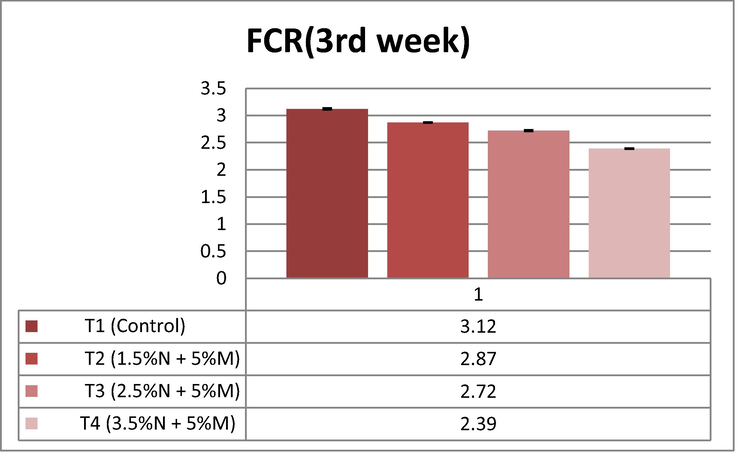
Representing Mean Comparison for FCR 3rd Week (36–42 days) by the Supplementation of Azadirachta indica and Moringa oliefera leaf powder.
Fourth week of FCR had highly significant (P < 0.05) differences reported in different groups. 4th week had different values of T1, T2, T3 and T4 which are different from each other. FCR of T1 (3.070 ± 0.0085a) was greater than T2 (2.92 ± 0.016b), T3 (2.70 ± 0.0069c) and T4 (1.96 ± 0.0045d). FCR of T2 is greater than T3and T4 but lower than T1 and the FCR of T3 is lower than T1 and T2 but greater than T4 but T4 is lower than from all T1, T2 and T3 (Fig. 19).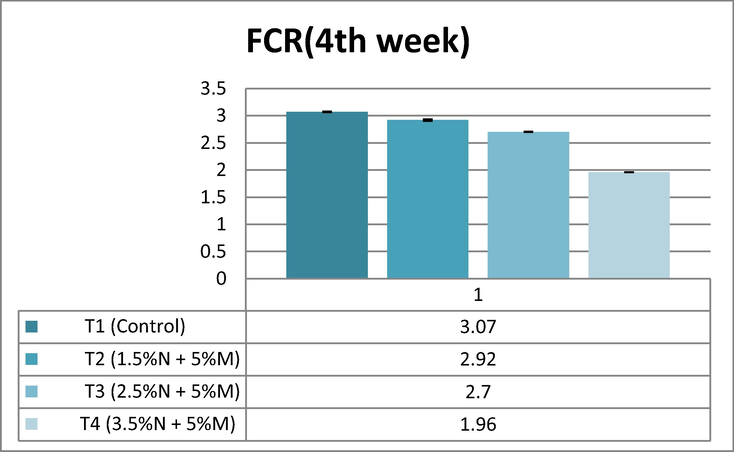
Representing Mean Comparison for FCR 4th Week (43–49 days) by the Supplementation of Azadirachta indica and Moringa oliefera leaf powder.
Feed Conservation Ratio of the fifth week had the highly significant (P < 0.05) differences. Fifth week had different values of T1, T2, T3 and T4 from each other. FCR of T1 (2.81 ± 0.0068a) and T2 (2.82 ± 0.0072a) had same value to each other and higher than T3 (2.68 ± 0.0054b) and T4 (2.208 ± 0.0034b). And same as T3 and T4 has equal values of FCR and lower than from T1 and T2 (Fig. 20).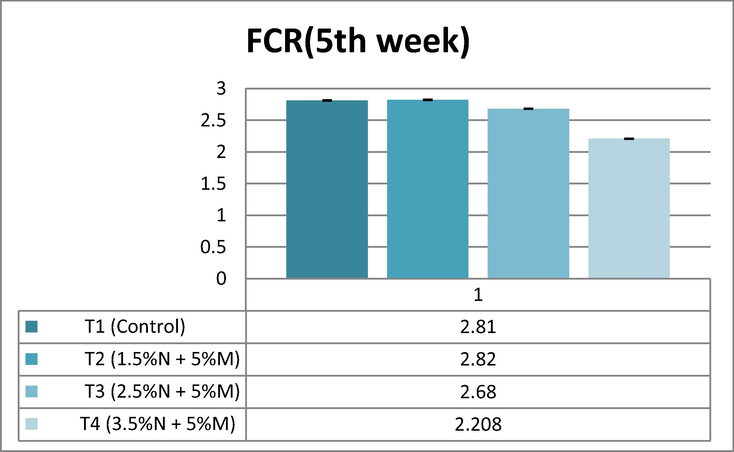
Representing Mean Comparison for FCR 5th Week (50–56 days) by the Supplementation of Azadirachta indica and Moringa oliefera leaf powder.
3.5 Carcass weight (g)
At the end of trial period the chicks were sacrificed, their slaughter weight and other characters were measured by the wing balance. All the values were statistically analyzed. The result of slaughter weight was significantly (p < 0.05) different in all the supplementary groups that were supplemented with Neem and Moringa leaf powder combination diet at different percentages. The group T3 (2736.95 ± 0.95a) that were served the (2.5 %N + 5 %M) in their diet had highest slaughtered weight in comparison with all the other groups T2 (2614.55 ± 1.47c), T4 (2692.75 ± 1.49b) and T1 (2461.94 ± 0.65d). Group T4 had the higher slaughtered weight than T2 and T1 but lowered than T3. In addition, the higher slaughter weight seen in T2 group from control T1 but lowered from all the other treated groups. Control group T1 show the lowest slaughter weight than all other supplemented groups (Fig. 21).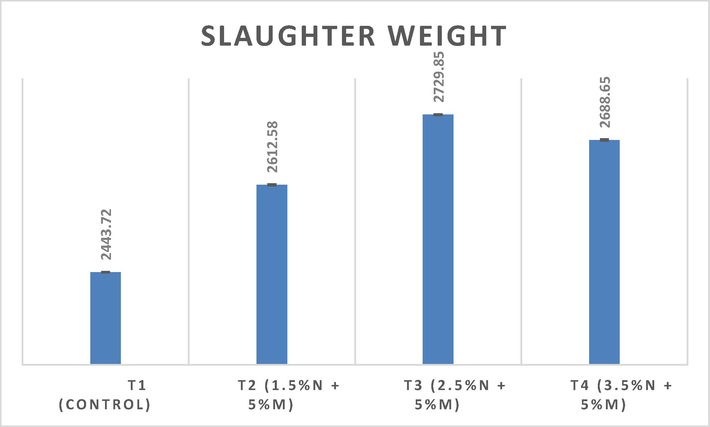
Representing Mean Comparison of Slaughter Weight (g) by the Supplementation of Azadirachta indica and Moringa oliefera leaf powder.
Dressing carcass weight is significantly (P < 0.05) different in all the groups. The group T3 (2130.57 ± 0.84a) that were fed the (2.5 %N + 5 %M) in their diet had highest dressed carcass weight in comparison with all the other groups T2 (1979.4 ± 0.52c), T4 (2067.71 ± 1.36b) and T1 (1836.33 ± 1.02d). Group T4 had the higher dressed weight than T2 and T1 but lowered than T3. In addition, the higher dressed weight seen in T2 group from T1 but lowered from all the other treated groups. T1 show the lowest dressed weight than all other supplemented groups (Fig. 22).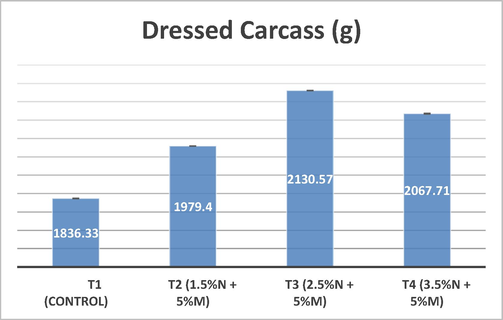
Representing Mean Comparison of dressed carcass (g) by the Supplementation of Azadirachta indica and Moringa oliefera leaf powder.
Dressing % significantly (P < 0.05) different in all the groups. The group T3 (78.19 ± 0.36a) had highest dressing percentage in comparison with all the other groups T2 (75.70 ± 0.03c), T4 (76.78 ± 0.07b) and T1 (74.58 ± 0.03d). Group T4 had the higher dressing than T2 and T1 but lowered than T3. The higher dressing percentage was seen in T2 group than control T1 but lowered as compared to all the other treated groups. T1 show the lowest dressing percentage than all other supplemented groups (Fig. 23).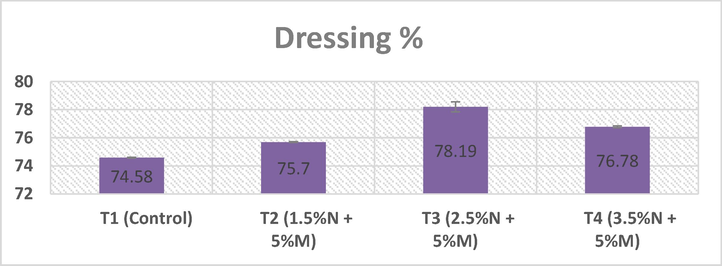
Representing Mean Comparison of dressing % by the Supplementation of Azadirachta indica and Moringa oliefera leaf powder.
The breast weight percentage of broiler chicks that were fed Neem and Moringa powder as supplement in their diet resulted significantly (p < 0.05) different in all the groups. T3 (30.79 ± 0.347a) had highest breast weight than the other groups T2 (30.05 ± 0.048b), T4 (30.15 ± 0.036b) and T1 (29.37 ± 0.006c). T2 and T4 was showing similarity in breast weight % and higher from T1. The lowest breast weight was seen in control group T1 (Fig. 24).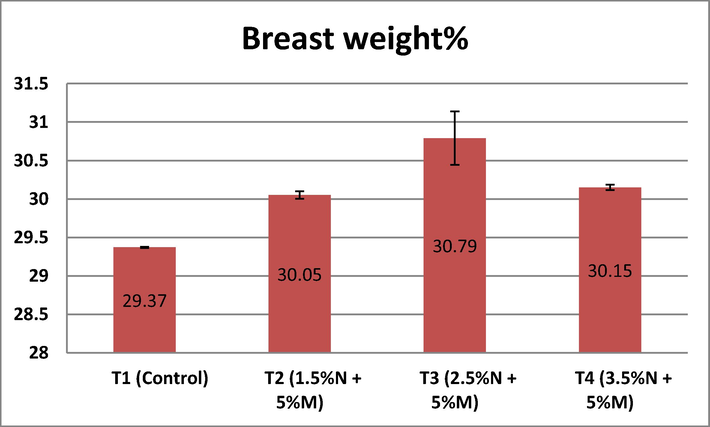
Representing Mean Comparison of breast weight % by the Supplementation of Azadirachta indica and Moringa oliefera leaf powder.
The thigh percentage of broiler chicks resulted significantly (p < 0.05) different in all the groups. T3 (19.36 ± 0.003a) had highest thigh percentage than the other groups T2 (19.02 ± 0.003b), T4 (19.01 ± 0.03b) and T1 (18.67 ± 0.011c). Groups T2 and T4 were shows similarity in thigh percentage to each other and higher from T1. The lowest thigh percentage was seen in control group T1.
Drum stick percentage shows significant (p < 0.05) results. T2 (12.82 ± 0.09a) T3 (12.88 ± 0.03a) and T4 (12.82 ± 0.03a) had similarity in results to each other and higher values of drumsticks % than T1 (12.30 ± 0.02b) (Fig. 25).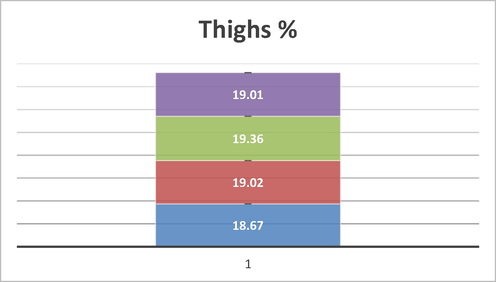
Representing Mean Comparison of thighs % by the Supplementation of Azadirachta indica and Moringa oliefera leaf powder.
There were non-significant (p greater than 0.05) results in keel bone meat percentages in all the groups. All the dietary treatments were non-significantly similar.
Wings percentages shows significant (p < 0.05) differences in all the treated groups. Mean comparison of wings % shows that T1 (8.56 ± 0.02a) had the highest percentage than other treated groups T2 (8.18 ± 0.03bc) T3 (8.14 ± 0.05c) and T4 (8.28 ± 0.04b). Group T4 and T2 shows similarity and significant to each other but had lowered % than T1 control group. Group T3 and T2 also show similarity between them (Fig. 26).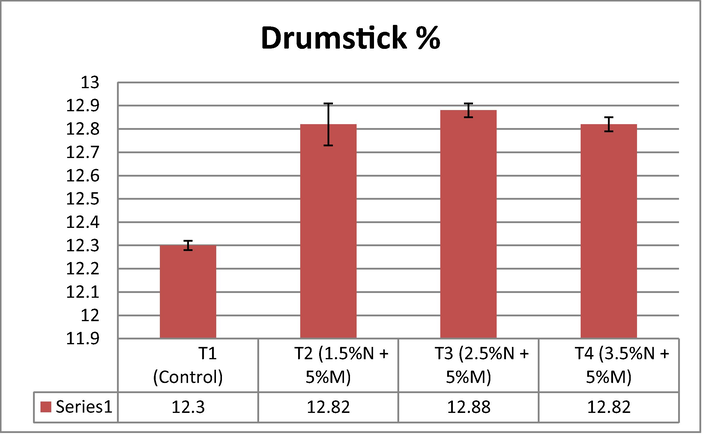
Representing Mean Comparison of drumstick % by the Supplementation of Azadirachta indica and Moringa oliefera leaf powder.
Gizzard percentages were significantly (p < 0.05) differ in all groups. T1 (1.83 ± 0.01a) had the highest gizzard weight in comparison with treated groups T2 (1.74 ± 0.01b) T4 (1.69 ± 0.005c) and T3 (1.65 ± 0.01d). T2 had the higher gizzard weight than others but lower than T1. Higher gizzard percentage was also seen in T4 from T3 but had lowered % than T1 and T2. The lowest gizzard % was seen in group T3 (Fig. 27).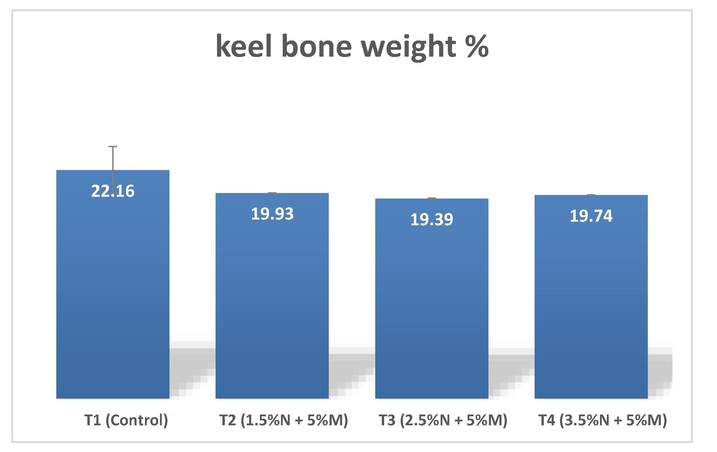
Representing Mean Comparison of Keel Bone Weight by the Supplementation of Azadirachta indica and Moringa oliefera leaf powder.
There were non-significant results seen in the liver percentages in all the treatment groups. All the treatment T2, T3 and T4 groups show similarity in liver % between them and control group T1 show similarity with T2 treated group (Fig. 28).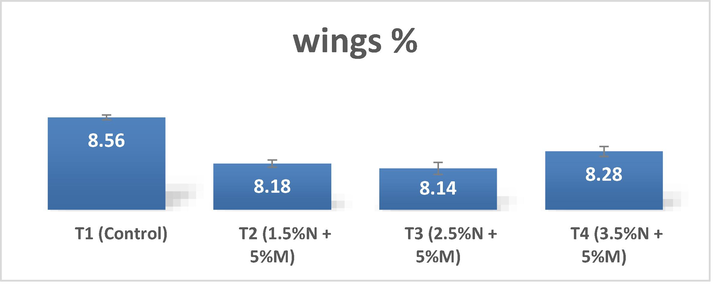
Representing Mean Comparison of wings % by the Supplementation of Azadirachta indica and Moringa oliefera leaf powder.
There were significantly (p < 0.05) differences reported in the percentages of heart in all the treated groups. Control group T1 (0.44 ± 0.01a) & T2 (0.44 ± 0.009a) show similarity in their results had higher % than the T3 (0.37 ± 0.007b) and T4 (0.40 ± 0.002b) groups. Likewise, the treatment T3 and T4 had the similarity between them and had lower values than the T1 and T2 (Fig. 29).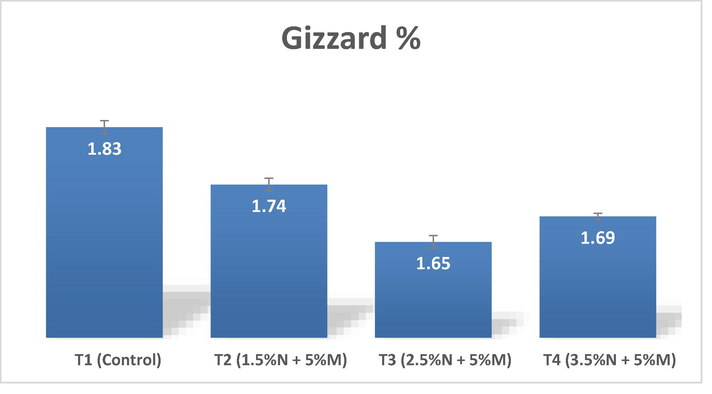
Representing Mean Comparison of gizzard % by the Supplementation of Azadirachta indica and Moringa oliefera leaf powder.
Small intestine show the significant (p < 0.05) results in all the groups. T3 (65.97 ± 0.46a) and T4 (66.11 ± 0.27a) had the highest weight of small intestine in them comparison with T1 (61.60 ± 0.71c) and T2 (63.64 ± 0.46b) and they are highly significant to each other. T2 had the higher weight of small intestine than the control group but had lowered weight than the T3 and T4 groups. Control group T1 had the lowest weight of small intestine as compared to all other treatments (Fig. 30).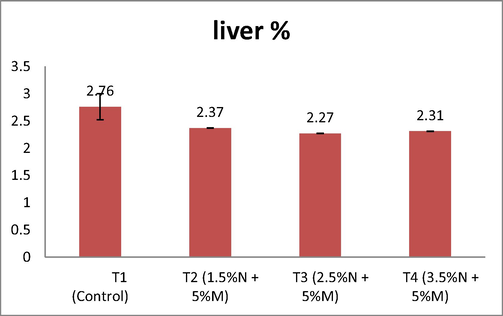
Representing Mean Comparison of Liver % by the Supplementation of Azadirachta indica and Moringa oliefera leaf powder.
Large intestine showed the significant result. All the groups show similarity between them. T2 (17.22 ± 0.20a) and control T1 (14.43 ± 2.19ab) same results indicate.T1 also show similarity with T4 group. Groups T3 (10.18 ± 0.01c) show similarity between T4 (13.32 ± 0.06bc) (Fig. 31).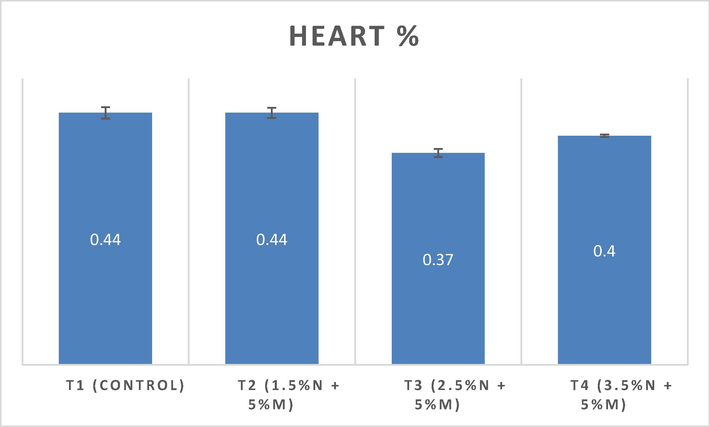
Representing Mean Comparison of Heart % by the Supplementation of Azadirachta indica and Moringa oliefera leaf powder.
Stomach weight was show significant (p < 0.05) differences in all the treatments groups. T2 (8.14 ± 0.01a) had the highest stomach weight than T1 (7.69 ± 0.27b), T3 (5.25 ± 0.02d) and T4 (6.34 ± 0.03c) groups. T1 had the higher stomach weight than the T3 and T4 but lowered than the T2 group. T4 had the higher stomach weight than the T3 but lowered than the T1 and T2. There was lowest stomach weight seen in T3 group.
Kidney weight show significant results in groups. Mean comparison of kidney weight indicate that the treatment groups T2 (9.82 ± 0.27ab) T3 (10.23 ± 0.06a) and T4 (10.46 ± 0.04a) were similar in results of stomach weight had higher weight than the control group. In addition, the control T1 (9.36 ± 0.37b) had close similarity seen with treated group T2 (Fig. 32).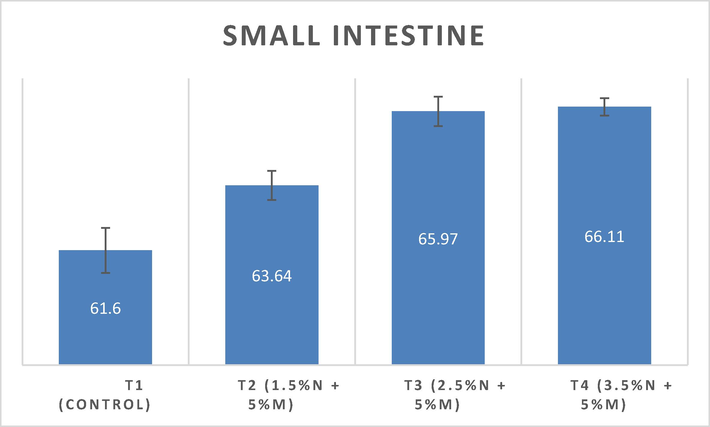
Representing Mean Comparison of Small Intestine (g) by the Supplementation of Azadirachta indica and Moringa oliefera leaf powder.
Lungs weight was showed the significantly (p < 0.050 differences in all the treated groups. Groups T3 (19.19 ± 0.01a) and T4 (19.42 ± 0.03a) had the similarity between them in their lungs weight and higher than other T2 (18.07 ± 0.22b) and T1 (13.81 ± 0.16c) control group. Group T2 had higher weight than the control group T1. The lowest weight was seen in control group T1 (Fig. 33).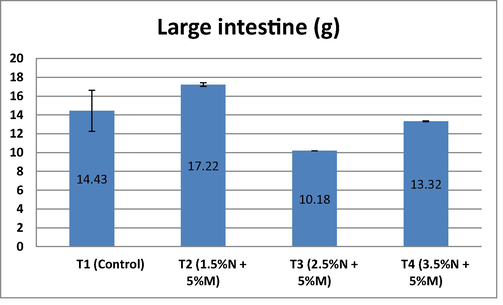
Representing Mean Comparison of Large Intestine (g) by the Supplementation of Azadirachta indica and Moringa oliefera leaf powder.
The spleen weight of broiler show significant result. All the groups show some interactions between them. All had similarity in spleen weight were found in them. Control T1 had similarity with T4 and had higher weight than T2 and T3. Groups T2 and T3 are relate to each other and T3 relate with T4 also (Fig. 34).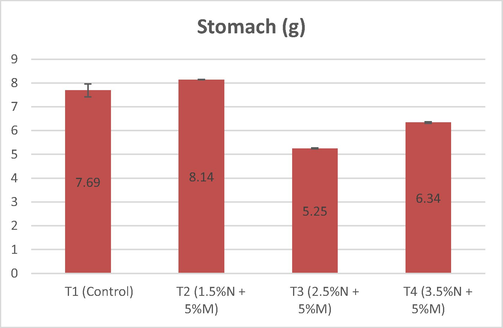
Representing Mean Comparison of stomach (g) by the Supplementation of Azadirachta indica and Moringa oliefera leaf powder.
4 Discussion
The current study was directed to evaluate the effect of Azadiratcha indica and Moringa oliefera in broiler diet in respect to their growth performance (Fig. 35).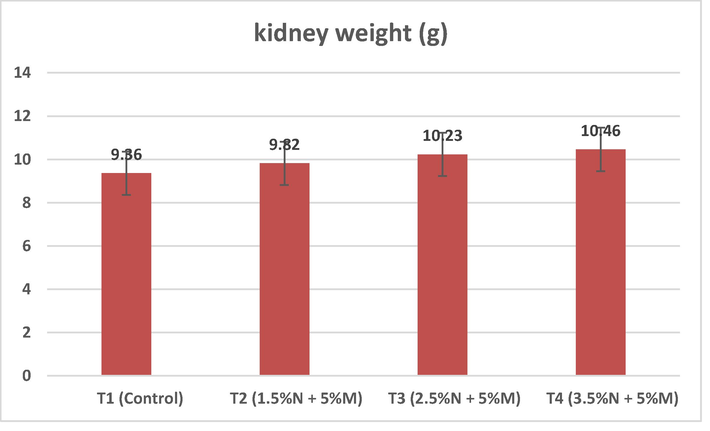
Representing Mean Comparison of kidney weight (g) by the Supplementation of Azadirachta indica and Moringa oliefera leaf powder.
4.1 Growth performance
In growth performance of the broiler chicken the feed intake ratio (FI), the amount of feed consumed (FC) by the broilers, the repulsion rate (FR) and the mortality rate were recorded on daily basis during the trial period. Body weight gain (BWG) and feed conversion ratio FCR also included in growth performance of the broiler chicken. Different percentages of Azadiratcha indica and Moringa oliefera leaf powder as in combined form used in different supplementary groups. After the acclimation period of three weeks in the groups there were where the growth performance indicate insignificant results in FC, BWG, FCR and live body weight. T1, T2, T3 and T4 were the groups designated with their triplicates each containing fifteen chicks, T1 taken as control while the others were supplementary groups that were treated with supplements of (NLP) and (MLP) doses in combination form as T2 (1.5 %N + 5 %M), T3 (2.5 %N + 5 %M) and T4 (3.5 %N + 5 %M) respectively. There were significant results seen in the growth performance of the broiler chicken (Fig. 36).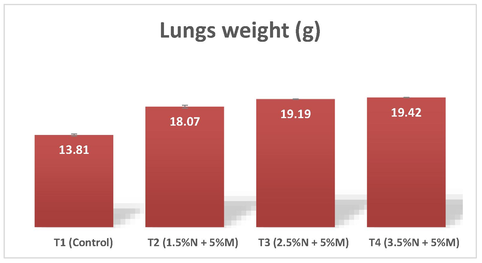
Representing Mean Comparison of lungs weight (g) by the Supplementation of Azadirachta indica and Moringa oliefera leaf powder.
4.2 Feed consumption (FC)
On the weekly basis the amount of feed consumption was determined in all the supplementary groups. By the present study indicated that the feed consumption in the broiler chicken that were fed with Neem and Moringa show significantly (p < 0.05) difference from each other in all the experimental weeks and in all the treatment groups. The consumption rate is high in treatment group T2 than the control group. However the T3 and T4 were less in consumption of feed than control T1. In addition the overall last week feed consumption in the control T1 (2115.33 ± 1.45b) and in treatment T2 (2163.33 ± 1.20a) that fed (1.5 %N + 5 %M) had the higher rate than the other supplementary groups T3 (2105.66 ± 0.88c) and T4 (1702.33 ± 1.45d). There were close relationships in the results of Shihab et al. (2016) who had reported the higher feed consumption in 2 g/kg powdered Neem in broiler diet than the other treatment groups and from control group. Similar with Deka et al. (2019) who fed the broilers with (0.1, 0.2 and 0.3 %) neem leaf powder, reported the 0.3 % dose increase the feed consumption by the broilers. There were close results with Abujradah et al. (2018) were fed the broilers with neem, garlic and probiotics in combination show significant (p < 0.05) results in respect to feed consumption rate. The results were in accordance with Khatun et al. (2013) by the neem and tulsi extract infusion at the rate of 1, 2 and 3 ml per liter in drinking water. The rate of consumption is higher in broiler chicks that were fed 3 ml/liter. The results attributed to the Azadiratcha indica medicinal properties Antiprotozoal, anti-inflammatory, anti-gastric ulcer, diuretic, anti-helminthic, immunomodulatory function and performance in broilers (Biswas et al., 2002; Kale et al., 2013) The results were also in accordance with the Pagrut et al. (2018) who reported the improved growth performance of broiler chicken by the infusion of 4 % concentration Neem at 50 ml/litter of fresh drinking water but have contrary results in accordance to feed intake ratio that were lower in Neem treated groups as compared to control. Contrary to Gadzirayi et al. (2012) who had reported no significant (p < 0.05) differences in terms of feed consumed by the broilers supplemented the 0, 25, 50, 75 and 100 % Moringa doses in the diet of broilers. According to Hassan et al. (2018) there were no significant (p < 0.05) differences in feed intake of broiler chicken by the inclusion of (0, 5, 10, 15 and 20 %) moringa leaf powder and show controversy with the present results. The depression in feed consumption of the results attribute to the garlic like odour and bitter taste of neem (Makeri et al. 2007; Wikipedia, 2007; Valarmathy et al. 2010) and the high fiber content in moringa (Yang et al., 2006) that lower the feed consumption (Fig. 37).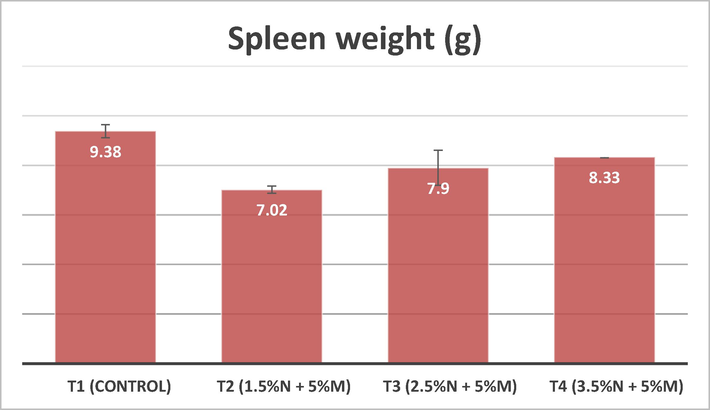
Representing Mean Comparison of spleen weight (g) by the Supplementation of Azadirachta indica and Moringa oliefera leaf powder.
4.3 Final body weight gain (FWG)
The final body weight of the broiler chicks were greatly affected by the supplementary treatments of neem and moringa in the diet. The final body weight gain show significantly (p < 0.05) differences in all the treated groups. The highest final body weight was seen in the treatment T3 (2736.95 ± 0.95a) that were fed with the (2.5 %N + 5 %M) leaves powder as compared to other treated groups T2 (2614.55 ± 1.47c) and T4 (2692.75 ± 1.49b) and from the control group T1 (2464.25 ± 0.67d). Similar results with the Rabiul Islam. (2019) who reported the significant (p < 0.05) results by the 2 % neem and 2 % moringa leaf powder in comparison with 2 % jute leaf powder, doxivet (g/L) and from the control. Significant (p < 0.05) effects seen in terms of final live weight by Faluyi et al. (2018) the who fed the broiler birds with moringa leaf extract at 2500 and 5000 mg/kg rate in drinking water according to the present results. Also the close relationships with the work of Deka et al. (2019) who had fed the broilers with (0.1, 0.2 and 0.3 %) neem leaf powder and reported that the 0.3 % dose increase the highest final body weight. There were also the similarities with the work of Abujradah et al. (2018) who supplemented the neem leaves with garlic and probiotics in one kilogram of feed had good results in terms of the growth of live body weight. Osama et al. (2020) show significantly (p < 0.05) highest values of live body weight when birds fed moringa seed powder at 0.75 % with phytase. Conflict with the results of Patricia et al. (2019) who stated that the growth performance of broilers were not affected by the 0.05 % of tylosin, and a diet with 0.05 and 0.1 % of Neem.
4.4 Weekly body weight gain (BWG)
Average body weight gain measured on weekly basis. The body weight gain is significantly (p < 0.05) different in all the treated groups and in the control group in all the experimental weeks. The highest average weight gain seen in the T3 (783.28 ± 1.81a) group that fed (2.5 %N + 5 %M) in comparison with T2 (765.51 ± 2.33b) and T4 (770.67 ± 0.81b) also from control T1 (750.85 ± 2.07c). The present results were according to Akhouri et al. (2013) who reported the highest average body weight gain by the inclusion of aqueous extract of dried moringa leaf powder 250 mg/kg than the other treated group’s levamisole at 10 mg/kg and from control group. Similar results of Deka et al. (2019) who fed the broilers with (0.1, 0.2 and 0.3 %) NLP reported the 0.3 % significantly (p < 0.05) improve the body weight gain. The results were show close relationships with Ufele et al (2020) who fed the broiler chicks with 20 g of (NLM), 20 g of (MLM), 10 g of NLM and 10 g of MLM, 20 g N that significantly (p < 0.05) increase body weight gain and the higher body weight gain seen in by 20 g NLM. Osama et al. (2020) also reported the significantly (p < 0.05) increase in body weight gain by the 0.75 percent moringa seed powder with phytase had shown the similarities with the present study. The results were in accordance with Pagrut et al. (2018) fed the broiler chicken with 4 % neem in 50 ml/L water show significant (p < 0.05) increase in body weight gain reported. Contrary with Shihab et al. (2016) had reported no change in body weight gain by the 2 g neem leaves in broiler diet. Similar to Banjo et al. (2012) by the inclusion of Moringa oleifera leaf (0, 1, 2 and 3 %) in the diet. Inclusion of Moringa significantly (P < 0.05) enhanced weight gain of birds at 2 % level of inclusion.
4.5 Feed conversion ratio (FCR)
The feed conversion ratio determined on weekly basis in broilers chicken that were fed with the neem and moringa concentrations at different percentages. The highest FCR measured in the treated groups in all the weeks of experimental setup. Feed conversion affected by the neem and moringa leaf powder inclusion on weekly basis. T1 had highest FCR than other T2, T3 and T4 treated groups. The results were in accordance Akhouri et al. (2013) reported the high Feed conversion ratio by adding the 250 mg/kg of Moringa oliefera leaf powder comparison with the levamisole at 10 mg/kg. Similar results with Gadzirayi et al. (2012) reported significant (p < 0.05) differences in FCR. Similar results with Deka et al. (2019) fed the broilers with (0.1, 0.2 and 0.3 %) NLP and reported the 0.3 % dose increase the FCR. Close similarities observed by Abujradah et al. (2018) in FCR fed the neem, garlic and probiotics combination diet. Contrary to Banjo et al. (2012) by the inclusion of Moringa oleifera leaf (0, 1, 2 and 3 %) in the diet not significantly (P < 0.05) enhance feed intake and feed conversion ratio. The work of Kumar et al. (2020) also show controversy by the inclusion of 1 % aqueous extract of neem leaves significantly lower FCR than others. Osama et al. (2020) reported the lowest feed intake and best feed conversion ratio by the 0.75 % moringa seed with phytase and controversy with the resent results. Conflict with Hassan et al. (2018) who reported that feed conversion rate not affected by (0, 5, 10, 15, 20 %) moringa leaves. No significant change in terms of BWG, FCR and FI recorded by Divya et al. (2014) when applied 0.5, 1.0, 1.5, 2.0 % leaf powder of moringa in the broiler diet. Gut health of the broiler improved by the application of moringa leaf.
Acknowledgment
The authors would like to thank the Research Supporting Project number (RSP-2021/97) at King Saud University for funding this study, Riyadh, Saudi Arabia.
Declaration of Competing Interest
The authors declare that they have no known competing financial interests or personal relationships that could have appeared to influence the work reported in this paper.
References
- Eukaryotic initiation factor 4E (Eif4e): a recap of the cap-binding protein. J. Cell. Biochem.. 2019;120(9):14201-14212.
- [Google Scholar]
- Effect of dietary supplementation of probiotics, garlic and neem leaf powder on growth performance in caged broiler. Journal of Pharmacognosy and Phytochemistry. 2018;7(3):542-544.
- [Google Scholar]
- Moringa oleifera leaf extract imposes better feed utilization in broiler chicken. J. Biol. Chem. Res.. 2013;30(2):447-450.
- [Google Scholar]
- Effects of neem leave powder as a growth promoter in broilers. Int. J. Nat. Soc. Sci.. 2015;2(2):22-26.
- [Google Scholar]
- Exploring the internationalization strategies of Turkish multinationals: A multi-perspective analysis. J. Int. Manage. 2020:100-783.
- [Google Scholar]
- Effect of ginger (Zingiber officinale) and garlic (Allium sativum) on productive performance and hematological parameters of the broiler. Int. J. Environ.. 2018;4:12-23.
- [Google Scholar]
- Biological activities and medicinal properties of Neem (Azadirachta indica) Curr. Sci.. 2002;82:1336-1345.
- [Google Scholar]
- Inhibition of lipid oxidation in long-term frozen stored chicken meat by dietary Oregano essential oil and a-tocopheryl acetate supplementation. Food Res. Int.. 2003;36:207-213.
- [Google Scholar]
- Immunomodulatory and growth promoting effects of neem leaves infusion in broiler chicks. Sarhad J. Agric.. 2008;24(4):655-659.
- [Google Scholar]
- Effect of feeding different levels of Moringa oleifera leaf meal on the performance and some blood parameters of broilers. Int. J. Sci. Res.. 2016;5(3):632-635.
- [Google Scholar]
- Moringa oleifera: The Encyclopedia of fruit and nutrition. Oxfordshire: ABI; 2008. p. :509-512.
- Efficacy of tulsi and neem leaves extract in broiler production. Bangl. J. Veter. Med.. 2013;11(1):1-5.
- [Google Scholar]
- Antibacterial potential of the extracts of the leaves of Azadirachta indica Linn. Notulae Sci. Biol.. 2011;3(1):65-69.
- [Google Scholar]
- Effect of Liv-52 syrup on broiler performance in North Eastern Region. Indian Poultry Rev.. 1991;31:37-38.
- [Google Scholar]
- New strategies in rabbit feed: Additives and alternatives to antibiotic use. In: 26th Symp ASESCU. 2001. p. :51-68.
- [Google Scholar]
- Eucalyptus leaves powder, antibiotic and probiotic addition to broiler diets: effect on growth performance, immune response, blood components and carcass traits. Animal. 2018;12(10):1-7.
- [Google Scholar]
- Importance of medical herbs in animal feeding: A review. Ann. Biol.. 2012;3:918-923.
- [Google Scholar]
- Poultry Production in Warm Wet Climates. London: Macmillan Press Limited; 1979. p. :197.
- Effect of Moringa oleifera seeds powder on performance and immunity of broiler chicks. AIMS Agriculture and Food. 2020;5(4):896-910.
- [Google Scholar]
- Importance of indigenous breeds of chicken for rural economy and their improvements for higher production performance. Scientifica. 2016;2016:1-9.
- [Google Scholar]
- Effects of neem leaf infusion supplementation as a growth promoter in the diet of broiler chicks. J. Entomol. Zool. Stud.. 2018;6(3):249-250.
- [Google Scholar]
- Patricia, S. A. H. H. C. M., Gimenez, A., Andrade, M. A., Teixeira, A. K., Oliveira, H. F. and Carvalho. D. P. (2019). Use of Neem (Azadirachta indica) as a Substitute for antimicrobial drugs in broiler chickens feed. Ciencia Animal Brasileira Goiania, 20: 1-9.
- Qaiser, M., Nasir, E. and Ali, S. I. (1973). Moringaceae in: Flora of West Pakistan, No. 38; Ed; Department of Botany, University of Karachi, Pakistan, 1–4.
- Swain, B.K., Naik, P.K., Chakurkar, E.B., Singh, N.P., 2017. Effect of supplementation of Moringa oleifera leaf meal on the performance of Vanaraja laying hens. Indian J. Animal Sci. 87 (3), 353–355.
- New dimension of medicinal plants as animal feed. Pakistan Veterinary J.. 2006;26:144-148.
- [Google Scholar]
- Application of stochastic production frontier in the estimation of technical efficiency of cassava based farms in Akwa Ibom State. Nigeria Agric. J.. 2007;2(6):731-735.
- [Google Scholar]
- Ufele, A. N., Judith, C., Nwafor., Offor., Vivian. and Samule, N. (2020). Effects of Azadirachta indica and Morniga oliefera leaves on the growth performance and packed cell volume of broiler chicken. 17(2): 3658-3664.
- Safety assessment of a standardized polyphenolic extract of clove buds: Sub-chronic toxicity and mutagenicity studies. Toxicol. Repor.. 2016;3:439-449.
- [Google Scholar]
- Use of phytogenic products as feed additives for swine and poultry. J. Anim. Sci.. 2008;86:140-148.
- [Google Scholar]
- Yang, R., L. Chang, J. H., Weng, B., Palada, M., Chadha, M. and Levasseur, V., 2006. Nutritional and function properties of Moringa leaves from Germplasm, to plant, to food, to health. In: Proceed. Of the Moringa and other Highly Nutritious Plant Resources: Strategies, Standards and Markets for a Better Impact on Nutrition in Africa, Ghana, 1-8.


