

Groundwater resources exploration of Harrat Khaybar area, northwest Saudi Arabia, using electrical resistivity tomography
⁎Corresponding author. Falshehria@ksu.edu.sa (Fahad Alshehri)
-
Received: ,
Accepted: ,
This article was originally published by Elsevier and was migrated to Scientific Scholar after the change of Publisher.
Peer review under responsibility of King Saud University.
Abstract
Two-dimensional (2D) electrical resistivity tomography (ERT) survey has been conducted in the Harrat Khaybar volcanic field, northeast of Al Madinah Al Munawwarah, Saudi Arabia, to assess the presence of groundwater resources. For this purpose, eleven ERT profiles were generated at six sites oriented north–south and east–west at various lengths between 590 m and 890 m. The ERT data were collected using the Syscal Pro multinode resistivity imaging system with a dipole–dipole array and 5 m of electrode separation. Then, these data have been processed using RES2DINV software to get 2D geoelectric cross-sections. The interpreted 2D geoelectric cross-sections clarified that the Harrat Khaybar occupied by sheets of lava flows underlain by alluvial deposits of gravelly sand and clay. These deposits rest on a Precambrian crystalline rock configuration that has the potential to provide groundwater to the region. Promising water-bearing formations were detected within sub-basaltic alluvial sediments and basaltic flows as well. Moreover, the reported water table in the area has 47 m depth in average with thickness varies between 6 and 200 m. These results correlate well with those of previous hydrogeological studies conducted in Harrat Khaybar. These results are very important for the residents in Harat Khaybar, where enables them to benefit from the groundwater resources in the area for domestic and agricultural purposes.
Keywords
Groundwater resources
Electrical resistivity tomography
Sub-basaltic alluvial sediments
Harat Khaybar
Saudi Arabia

1 Introduction
Climate condition created great challenges for groundwater management in Saudi Arabia owing to scarce water sources. The utilization of groundwater acquired from aquifers located deep in the ground contributes to the depletion of water sources that have taken hundreds of years to amass. In general, in arid areas and specifically those in the western zone of Saudi Arabia, some investigations have completed on groundwater resources in the past few years.
The Al-Harat region did not receive sufficient studies to search for groundwater sources in previous years, as there are a very limited number of geophysical studies to reveal water sources in the Harrat region. It has been recently proven that these Harrats are one of the important strategic sources of groundwater, which qualifies them for many agricultural projects in the near future.
Electrical resistivity tomography (ERT) is widely used geophysical technique for near-surface exploration in groundwater and environmental investigations (Butler, 2005). However, geoelectrical resistivity imaging has recently gained popularity in environmental and engineering investigations (Coskun, 2012; Aizebeokhai et al., 2010; Yilmaz, 2011). The ERT is successful tool for measuring the spatial resistivity variation for soil and rock as well. The principle behind this technology is that rock and soil materials demonstrate electrical resistivity variations owing to variations in their mineral content, fluid saturation, porosity, permeability, and other parameters. Hence, by measuring the resistivity of the subsurface at high resolution, subsurface areas undergoing dissolution can be differentiated from intact rock.
ERT regionally applied in complexed geological environments (Dahlin and Loke, 1998; Griffiths and Barker, 1993; Amidu and Olayinka, 2006; Aizebeokhai et al., 2010; Almadani et al., 2017; Alfaifi et al., 2019). The recent accessibility of automated data acquisition systems and efficient user-friendly inversion software has enabled more reliable images of the subsurface top be obtained through the electrical resistivity imaging technique (Aning et al., 2013). This technique has a wide variety of applications, particularly, in groundwater exploration through investigating the subsurface and identifying the physical parameters of rock formations to facilitate mapping of geologic structures (Soupios et al., 2007; Aning et al., 2014; Lowrie, 1997; Telford et al., 1990; Andrews et al., 2013; Rai et al., 2013; Thiagarajan et al., 2018; Chen et al., 2018; Arsène et al., 2018; Rizzo et al., 2019).
The Harrat Khaybar volcanic field, which is situated to the north of Al-Madinah Al-Munawwarah, Saudi Arabia (Fig. 1). Numerous of villages and residential communities are developed in the area; thus, the search for groundwater resources is important for providing water for consumption and agricultural crop irrigation. Given that the climate of this region is dry with little rainfall, the near-surface groundwater resources are limited and insufficient for the daily requirements of the residents. Hence, this study explores the groundwater resources in the area present at near-surface or greater depths from which water can be extracted to serve the people of this region.
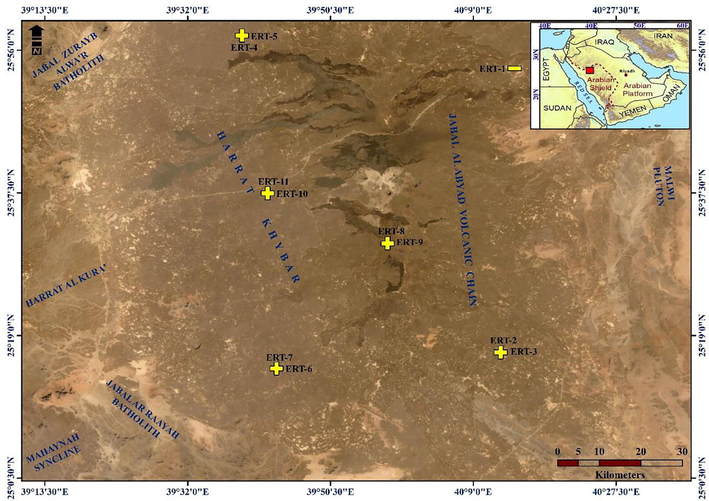
- Location map of Harrat Khaybar area and the distribution of the ERT profiles in the studied site.
2 Geologic setting
The geologic setting of Harrat Khaybar is illustrated in Fig. 2 according to Johnson (2005) where it includes white felsic rock present as tuff rings and domes with pyroclastic aprons (Sonbul, 2016). The volcanic and sedimentary rocks of Al Ays Group composed of basaltic flows, tuffs of well-bedded volcaiclastic end epiclastic sedimentary layers (Kemp, 1981; Pellaton, 1981). The Khanzirah Complex (Fairer, 1986) represented by bodies of biotite–muscovite monzogranite and occupied the nearby zones of the Khaybar and Wadi al Ays (Johnson, 2005). Hamra-Badi Alkali Feldspar Granite overlying by Lower Paleozoic sandstone and Cenozoic flood basalt. The plutons consist of coarse-grained pink hypidiomorphic granular biotite alkali–feldspar granite. The Saq Sandstone composed by flat-lying, thickly bedded, and pink-weathered sandstone form of Cambrian–Ordovician age (Fairer, 1986). The sandstone is thickly bedded, quartzose, and medium-grained to conglomeratic overlying the Precambrian rock. The Cenozoic rocks forming the black basaltic cones or white affinity. In many areas well-bedded volcaniclastic scoria deposits are present. The Tertiary boulder conglomerate exposed in Harrat Khaybar at the northeastern margin (Fairer, 1986). Unconsolidated Quaternary deposits mainly overlie the Precambrian basement near the harrats. They have been subdivided into four units: wadi alluvium of poorly sorted and unconsolidated sand and gravel; eolian sand as small dune fields; Sabkhah deposits that formed in seasonal inland lakes; terraced, slightly consolidated alluvium of older wadi deposits; and undifferentiated gravel fan deposits and talus.
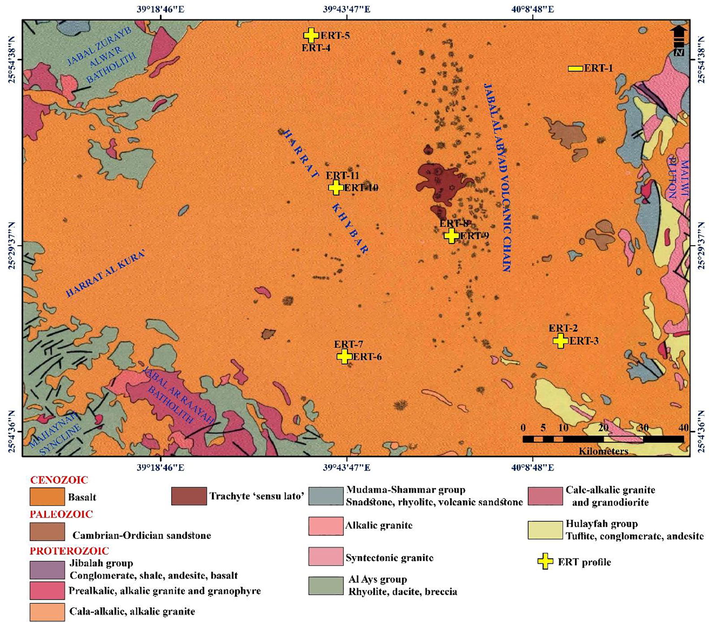
- Geologic map for the study area (Johnson, 2006).
3 ERT data acquisition
ERT data acquisition using the IRIS Instruments Syscal Pro unit involves passing electric currents through electrodes coupled to the ground using metal stakes. Each pair of electrodes serves as current electrodes, whereas a different set of two electrodes serves as voltage electrodes. The geometric setup of the electrodes depends on the standard arrays applied in each particular study. The common standard electrode arrays available are Wenner, Schlumberger, dipole–dipole, and pole–dipole arrays. Loke (1991) and Coskun (2012) recommended the use of the dipole–dipole array which is presently in common usage because it offers better lateral and vertical resolutions than those of other arrays. The electrodes used in ERT site investigations are typically spaced at 5-m intervals.
The field survey and data acquisition began in May 2017 and ended during the last week of August 2017, which is part of the dry and hot season of Saudi Arabia. Therefore, the conduction was very poor and required constant wetting of the current electrodes. During this survey period, 11 ERT profiles were generated in the study area (Fig. 1) using the Syscal Pro resistivity meter imaging system. The ERT distribution and spread in the study area were controlled by the field conditions and site accessibility.
4 ERT data processing and results
After the raw 2D resistivity data were acquired in the field, they were downloaded from the Syscal Pro unit for processing using Prosys II software. The full version of RES2DINV software program for processing the acquired field resistivity data through inversion process. The processing sequence of the collected data included the following three steps. 1) The raw data are uploaded using Prosys II software for processing and filtering. Once a data file is opened in the master window, further actions can be performed. In this step, the data are filtered, and the results are converted into absolute rho values. The data are checked precisely for bad points with either unreasonably high or low apparent resistivity values that are has to be removed. 2) The filtered data are exported through Prosys II software for further editing and removal of bad data points exhibiting excessively high or low resistivity values in comparison with those of the adjoining data sets. 3) The filtered data are subjected to the least-squares inversion routine for inversion, the output file of which displays the measured apparent resistivity pseudo-sections and the model sections. Within this option, the contour scheme is customized and used for drawing the pseudo-sections and model sections as well as the vertical scale of the pseudo-sections. Then, 2D resistivity geoelectric sections of the subsurface are then generated using RES2DINV software. The qaulity of the resulted section are enhanced through an iterative method.
The result is a 2D resistivity image of the subsurface showing the distribution of resistivity across a traverse. During the processing of the data, it is important for the root–mean–square (RMS) error to remain as low as possible (Loke, 1999) to ensure good quality of the geologic model.
5 ERT date interpretation
The electrical properties of soil and rocks forming the earth’s crust are determined essentially by factors such as porosity, permeability, temperature, clay, and water content (Loke, 2001). The presence of clay minerals in the highly weathered rocks increases the conductivity due to ion-exchange process in clay. However, particles of clay coating the surfaces of rocks can affect the rock’s bulk resistivity (Kesse, 1985; Andrews et al., 2013; Revil and Glover, 1997). Current flowing through the material between electrodes in ERT survey follows electrolytic processes. Thus, when the joints and pores are saturated with water, the soil and rock will conduct more electric current, hence producing lower resistivity values. Similarly, clay-filled zones are associated with very low resistivity owing to their high conductivity.
Profile 1 extends E–W, including 159 electrodes used through the field work with 5 m electrode spacing. The geoelectric section is revealed in Fig. 3. The number associated with an electrode reflects its distance measured from the first electrode, which is marked by zero on the profile line. The total length of this profile was 790 m. The values of resistivity extend in the range of 10.5–1873 Ω·m is given immediately below the resistivity models. The geological setting for this profile exhibits resistivity values around 70 Ω·m indicating the occurrence of a groundwater aquifer that could be suitable for exploitation. The groundwater depth was 164 m, and the zone extended 160–640 m from the beginning of the profile.

- The resultant 2D inversion resistivity model for Profile No. 1.
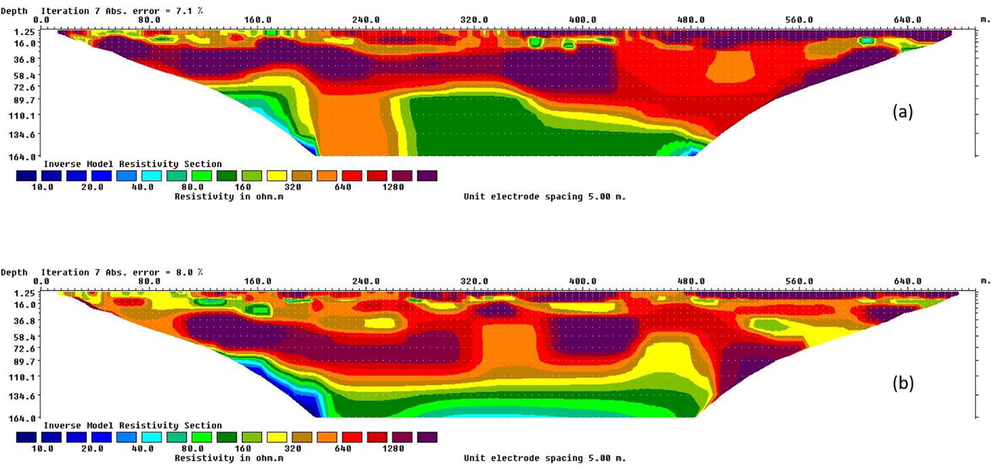
Profile 2 ran in an almost N–S direction with total length of 690 m; the used electrodes number is 139 with interval of 5 m (Fig. 4a). The profile has resistivity spanned between 3 and 1840 Ω·m illustrating the occurrence of a water-bearing zone at depths of 160–240 m that extended downward 89 m until reaching the end of the geoelectric model. Profile 3 extended E–W at 890 m in length (Fig. 4b). Two of low-resistivity zones characterized by resistivity values < 40 Ω·m were observed in this profile; the shallowest low-resistivity zone is exposed at the ground surface between 240 and 350 m from the starting point of the profile, was imaged up to 45 m depth. A large segment of the deep low-resistivity zone occurred at 180 m depth and extended 320–600 m from the starting point of the profile. Profile 3 intersected with profile 2.
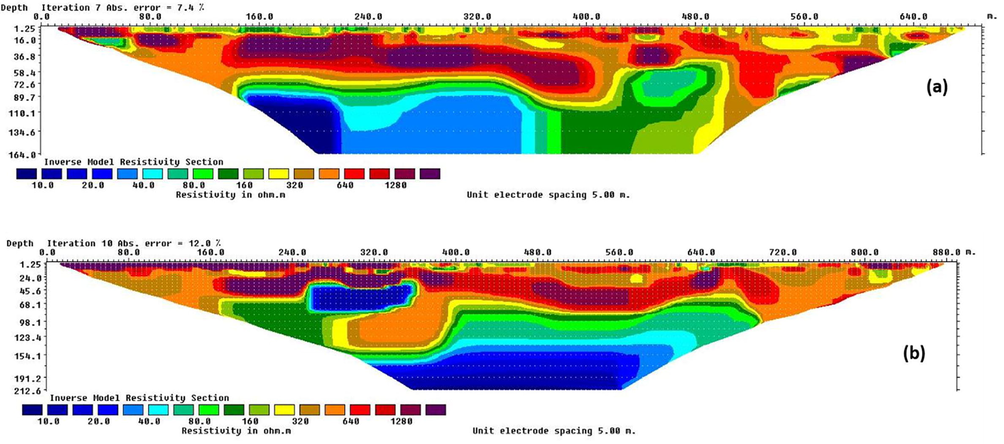
- a) The 2D inversion resistivity model for profile No.2, B) The 2D inversion resistivity model for profile No.3.
Profile 4 oriented N–S at 890 m length and included 179 electrodes where geoelectric cross-section is existing in Fig. 5(a). Low resistivity zone with < 40 Ω·m and detected at a depth of 164 m in the area between 230 m and 320 m distance from the starting point. Profile 5 intersected with profile 4 and ran E–W at a total length of 890 m. The resistivity model of this profile is presented in Fig. 5(b). Near-surface low-resistivity zones < 30 Ω‧m were indicated at 5 m and 28 m depths. In addition, two low-resistivity zones were detected at depths of 100 m and 220 m to the west and east of the profile, respectively. Profile 6 ran E–W of 690 m length and included 139 electrodes. The resistivity model for this profile is illustrated in Fig. 6(a). A low-resistivity formation < 40 Ω·m was detected 100–180 m to the west of the profile. The deeper low-resistivity zone was detected eastward of the profile at a depth of 164 m.
- a) The 2D inversion resistivity model for profile No.4, B) The 2D inversion resistivity model for profile No.5.
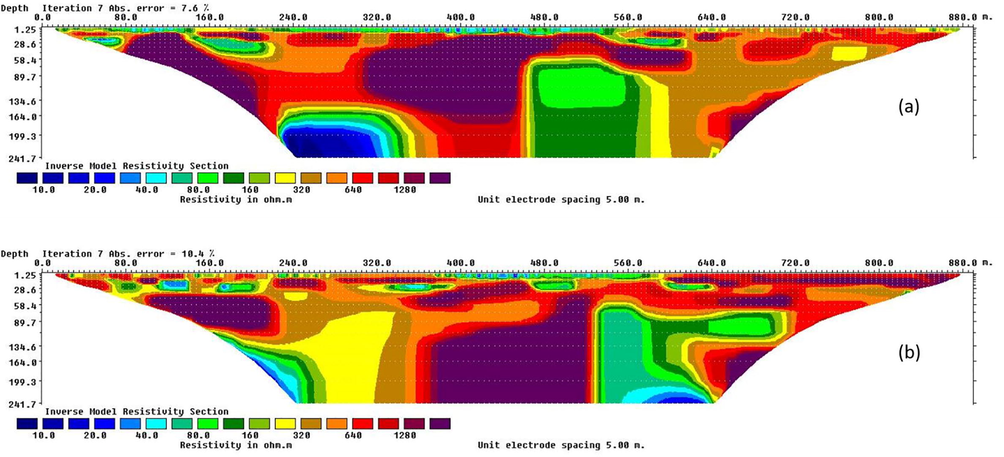
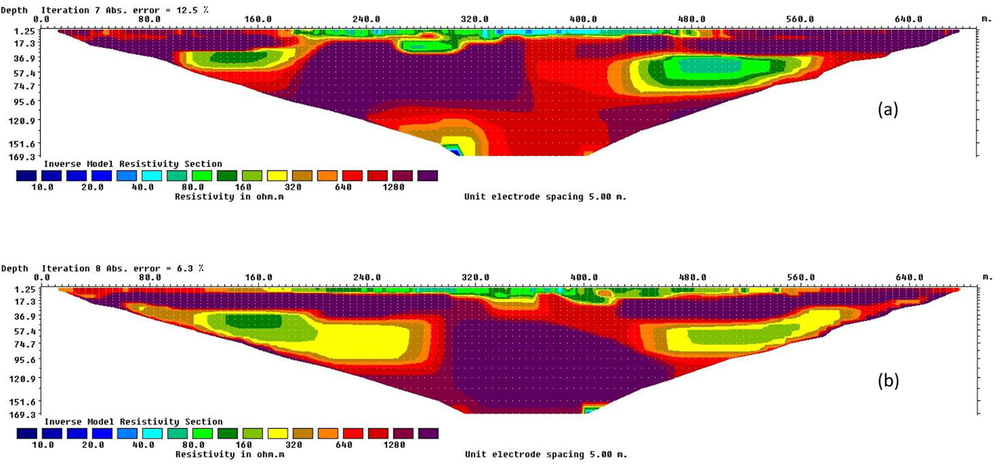
Profile 7 extended N–S at a length of 690 m and included 139 electrodes (Fig. 6b). Two low-resistivity zones < 40 Ω·m were detected at the southwest and central zone of the profile at depths of 70 m and 160 m that extended 100–200 m and 250–450 m, respectively. These low-resistivity geological formations appear to extend farther downward and are a potential source of groundwater. Profile 8 extended N–S at a length of 790 m and included 159 electrodes (Fig. 7a). A zone with low-resistivity (<40 Ω·m) was noted eastward of the profile at a depth of 164 m in the area extended from 560 to 640 m. This zone located close to a massive basalt formation, which enables abundant groundwater accumulation. This low-resistivity geological formation appears to extend farther downward and is a potential source of groundwater.
- a) The 2D inversion resistivity model for profile No.6, B) The 2D inversion resistivity model for profile No.7.
- a) The 2D inversion resistivity model for profile No.8, B) The 2D inversion resistivity model for profile No.9.
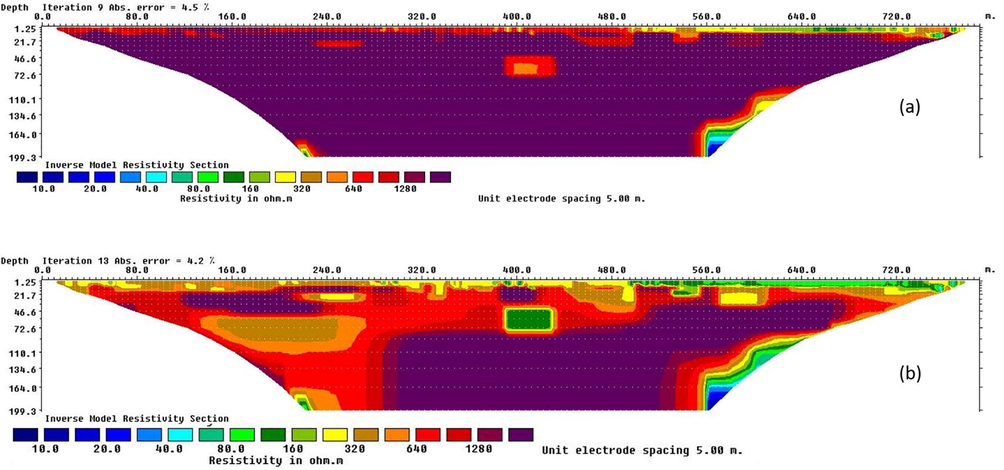
Profile 9 oriented E–W with length of 90 m and included 119 electrodes with 5.0 m interval (Fig. 7b). No low-velocity zones were detected in this profile, which intersected with profile 8. Profile 10 extended E–W at a length of 690 m and included 139 electrodes. The resistivity model for the profile is given in Fig. 8(a). A low-resistivity zone < 40 Ω·m was recorded near-surface within a depth of 10 m. Two other low-resistivity zones were detected at depths of 40 m and 165 m, respectively. The first extended 470–520 m, and the second was recorded southwest of the profile and extended downward.
- a) The 2D inversion resistivity model for profile No.10, B) The 2D inversion resistivity model for profile No.11.
Profile 11 stretched N–S at a length of 690 m and intersected with profile 10. This profile included 139 electrodes. The resistivity model for the profile is given in Fig. 8(b). A zone of low-resistivity (<40 Ω·m) was noted along the earth’s surface and extended downward till 10 m depth. Two additional low-resistivity zones were detected depths of 36 m 160 m, respectively. The first extended 120–200 m, and the second was recorded southeast of the profile and extended downward. The latter is in contact with a massive basaltic block, which provides a good opportunity for abundant groundwater accumulation.
6 Conclusions
To cover the growing need for water in Harrat Khaybar, ERT profiling was conducted along 11 profiles in this region to outline potential zones of groundwater. Interpretation of geoelectric models verified the subsurface geological setting including zones water-bearing zones and massive basaltic units. Depending on the results of this work, two of promising groundwater resources have been detected in the Harrat Khaybar area as the fractured basaltic flows and old sub-basaltic alluvial deposits. These results agree with those of previous hydrogeological investigations conducted through Harrat Khaybar (Al Wagdani et al., 2016). Moreover, the identified potential groundwater resources that are controlled to a large extent by massive basaltic intrusions that provide an opportunity for accumulating abundant groundwater that can be extracted by drilling deep groundwater wells. The present work can serve as a reference for groundwater exploration using ERT geoelectric techniques in other harrats of the Arabian Shield, western Saudi Arabia.
Acknowledgements
The authors extend their appreciation to the Deputyship for Research & Innovation, “Ministry of Education” in Saudi Arabia for funding this research work through the project number IFKSURG-1442-117.
Declaration of Competing Interest
The authors declare that they have no known competing financial interests or personal relationships that could have appeared to influence the work reported in this paper.
References
- 1 Application of 2D and 3D geoelectrical resistivity imaging for engineering site investigation in a crystalline basement terrain, southwestern Nigeria. Environ. Earth Sci.. 2010;61(7):1481-1492.
- [Google Scholar]
- Al Wagdani, E.O., Basamed, A.S., Al-Shorbaji, H.H., Thabit M., Al Ashi, W.A., and Al Hery, H.A., 2016, The exploration and development of water resources in Harrat Khaybar: Saudi Geological Survey Technical Report SGS-TR-2012-10, 73 p., 67 figs., 19 tables, 1 app.
- Integrated geophysical and hydrochemical investigations for seawater intrusion: a case study in southwestern Saudi Arabia. Arabian J. Geosci.. 2019;12:372.
- [CrossRef] [Google Scholar]
- Almadani, S., Hussain Alfaifi, Abdullah Al-Amri, Mohamed Fnais, Elkhedr Ibrahim, Kamal Abdelrahman, Mohammed Shehata and Faisal Zaidi (2017): Hydrochemical characteristics and evaluation of the granite aquifer in the Alwadeen area, southwest Saudi Arabia. Arab J Geosci (2017) 10:139. DOI:10.1007/s12517-017-2873-8.
- Environmental assessment of sewage disposal systems using 2D electrical resistivity imaging and geochemical analysis: a case study from Ibadan, Southwestern Nigeria. Environ. Eng. Geosci.. 2006;7(3):261-272.
- [Google Scholar]
- Geophysical investigations at the proposed site of the knust teaching hospital building using 2d and 3d resistivity imaging techniques. Int. Res. Jour. Geol. Min.. 2013;3(3):113-123.
- [Google Scholar]
- 2D Electrical Resistivity Tomography (ERT) Survey using the Multi-Electrode Gradient Array at the Bosumtwi Impact Crater, Ghana. J. Environ. Earth Sci.. 2013;3(5):2013.
- [Google Scholar]
- Electrical resistivity as a geophysical mapping tool; a case study of the new art department, Knust-Ghana. Int. J. Sci. Res. Publ.. 2014;4(1):1-7.
- [Google Scholar]
- Arsène, Meying, Bidichael Wahile Wassouo Elvis, Gouet Daniel, Ndougsa-Mbarga Théophile, Kuiate Kelian, and Ngoh Jean Daniel (2018): Hydrogeophysical Investigation for Groundwater Resources from Electrical Resistivity Tomography and Self-Potential Data in the Méiganga Area, Adamawa, Cameroon. International Journal of Geophysics Volume 2018, Article ID 2697585, 14 pages DOI:10.1155/2018/2697585.
- Yung-Hsin Yeh and Ko-Wei Weng (2018): evaluating the application of electrical resistivity tomography for investigating seawater intrusion. Electronics. 2018;7(7):107.
- [CrossRef] [Google Scholar]
- Coskun, Nart, 2012. The effectiveness of electrical resistivity imaging in sinkhole investigations. International Journal of Physical Sciences 7(15), pp. 2398 - 2405, 9 April, 2012.
- Resolution of 2D Wenner resistivity imaging as assessed by numerical modelling. J. Appl. Geophys.. 1998;38:237±249.
- [Google Scholar]
- Fairer, G.M., 1986. Geologic map of the Harrat Ithnayn quadrangle, sheet 26 D, Kingdom of Saudi Arabia: Saudi Arabian Deputy Ministry for Mineral Resources Geologic Map GM-106, 15 p.
- Two-dimensional resistivity imaging and modelling in areas of complex geology. J. Appl. Geophys.. 1993;29(3-4):211-226.
- [Google Scholar]
- Johnson, P.R., 2005. Proterozoic geology of western Explanatory notes to the map of Proterozoic geology of western Saudi Arabia, north-central sheet: Amended May 2005: Saudi Geological Survey Open-File Report SGS-OF-2005-5, 34 p.
- Kemp, J., 1981. Geologic map of the Wadi al ‘Ays quadrangle, sheet 25 C, Kingdom of Saudi Arabia: Saudi Arabian Deputy Ministry for Mineral Resources Geologic Map GM-53, 39 p.
- Kesse, G.O., 1985. The mineral and rock resources of Ghana. A.A, Balkema, Rotterdam.
- A Practical Guide to 2D and 3D Surveys. Electric. Imaging Surv. Environ. Eng. Stud. 1999:8-10.
- [Google Scholar]
- Loke, Meng, 2001. Tutorial: 2-D and 3-D Electrical Imaging Surveys.
- Fundamentals of Geophysics. UK: Cambridge University Press; 1997.
- Pellaton, C., 1981. Geologic map of the Al Madinah quadrangle, sheet 24 D, Kingdom of Saudi Arabia: Saudi Arabian Deputy Ministry for Mineral Resources Geologic Map GM-52, 19 p.
- Electrical resistivity tomography for groundwater exploration in a granitic terrain in NGRI campus. Curr. Sci.. 2013;105(10):25.
- [Google Scholar]
- Theory of ionic-surface electrical conduction in porous media. Phys. Rev. B. 1997;55(3):1757-1773.
- [CrossRef] [Google Scholar]
- Rizzo, E. V. Giampaolo, L. Capozzoli, and S. Grimald (2019): Deep Electrical Resistivity Tomography for the Hydrogeological Setting of Muro Lucano Mounts Aquifer (Basilicata, Southern Italy). Geofluids Volume 2019, Article ID 6594983, 11 pages DOI:10.1155/2019/6594983
- Hydrological and Hydrochemical Studies of the Groundwater Aquifer of Harrat Khaybar Area, North of Saudi Arabia. Int. J. Sci. Eng. Res.. 2016;7(7):492-502.
- [Google Scholar]
- Soupios, Pantelis, Nikos Papadopoulos, Ilias Papadopoulos, Maria Kouli, Filippos Vallianatos, Apostolos Sarris, Thrassyvoulos Manios (2007): Application of integrated methods in mapping waste disposal areas. Environ. Geol. DOI:10.1007/s00254-007-0681-2
- Applied Geophysics. Cambridge University Press; 1990.
- Thiagarajan, S. & S. N. Rai & Dewashish Kumar & A. Manglik (2018): Delineation of groundwater resources using electrical resistivity tomography. Arabian Journal of Geosciences (2018) 11: 212
- A case study of the application of electrical resistivity imaging for investigation of a landslide along highway. Int. J. Phys. Sci.. 2011;6(24):5843-5849.
- [Google Scholar]


