

Translate this page into:
Groundwater quality analysis in Hail region of northwest Saudi Arabia based on physicochemical investigation
-
Received: ,
Accepted: ,
This article was originally published by Elsevier and was migrated to Scientific Scholar after the change of Publisher.
Abstract
The acquired groundwater data from seventeen wells were hydrochemically analyzed for Sulfate, Chloride, Ammonia, Nitrate, Nitrite, pH, EC (Electrical Conductivity), TDS (Total Dissolved Solids), total hardness, and total alkalinity concentrations and then compared to the national and international standards. The results range as follows: pH (6.65–8.26), EC (382–1214 μS·cm−1), Total hardness (72–310 ppm), TDS (258–775 ppm), Total alkalinity (54–138 ppm), Cl- (19–202 ppm), Ammonia (NH3) (0.0 to 1.5 mg/liter), Nitrate (NO3) (4.7 to 65.6 ppm), Nitrite (NO2) (0.007 to 0.05 ppm), and sulfate (SO4) (29–278 ppm). About 70.58 % of the study area’s groundwater samples have TDS levels below 500 mg/l, which are considered safe for drinking. The EC of the groundwater found that 100 % of the samples fall within the allowed level. Based on these results, the groundwater quality is suitable for drinking and irrigation purposes in Hail region. Hence, this research shows that using GIS and chemical analysis of groundwater could be useful tools for the decision-making process of local and international authorities and water resources management.
Keywords
Groundwater quality
Drinking water
World Health Organization standards
Hail
Saudi Arabia

1 Introduction
Analysis of groundwater quality is important as it is the main factor determining its suitability for drinking, domestic, agricultural, and industrial purposes (Subramani et al. 2005, Kouser et al., 2022, Badr et al., 2023, Alshehri and Abdelrahman, 2023, Alrowais et al., 2023, Iddrisu et al., 2023, Giao et al., 2023). Because groundwater can be used for a variety of reasons, both its quantity and quality are crucial. Physical and chemical characteristics that strongly affect the variance of a region's groundwater quality include geological formations and human activities (Kelley, 1940; Wilcox, 1948; Belkhiri et al., 2010; Alfaifi et al., 2020; Benjmel et al., 2022). The classification of water quality is significantly influenced by the chemical properties of groundwater. It was noted that the standards used to categorize water for one use based on concentration may not be appropriate for other uses, and better outcomes can be obtained by considering the combined chemistry of all ions rather than individual or paired ions (Handa, 1964, 1965; Hem, 1985; Ibrahim, 2018; Salem, 2021).
The chemical classification also sheds light on the interrelationships and concentration of several main cations and anions. Ions, dissolved gases, and single-celled creatures make up water. When these ions, dissolved gases, and hazardous organisms exceed a certain threshold, water is categorized as being unsafe for drinking and other domestic uses. This limit has been set for specific parameters based on how they behave when their concentration is above or below the WHO-recommended level (2004 and 2011; Table 1). The usefulness of groundwater for use in agriculture and industry, as well as for human and animal sustenance, is determined by its quality. Since pure water is a poor conductor, the TDS parameter is frequently determined from the EC of the water. Water's capacity to conduct electricity is increased when impurities are dissolved in it. To classify the groundwater quality in the study area, TDS, pH, and EC were calculated.
Parameter
Max
Min
Mean
WHO (2004)
WHO (2011)
pH
8.26
6.65
7.45
6.5–8.5
6.5–8.5
EC (μS cm−1)
1214
382
1415.5
1500
300–750
TDS (mg L−1)
775
258
516.5
1500
755
SO4 (mg L−1)
278
29
153.5
250
T.A (mg L−1)
138
54
96
200
Cl− (mg L−1)
202.35
19
110.675
600
250
T.H (mg L−1)
310
72
191
80–120
Ammonia
1.5
0.0
0.75
Nitrate
65.6
4.7
35.15
Nitrite
0.05
0.007
0.0285
Inorganic salts and trace amounts of organic materials that have been dissolved in water make up the TDS. It describes the quantity of dissociated minerals that are currently present in water. The concentration of each of its components determines how TDS affects the quality of the water. Significant hardness, taste, mineral deposition, and corrosion are typical characteristics of water that have been heavily mineralized (Basavarajappa and Manjunatha, 2015). A health-based gridline value has not been proposed, making it difficult to ascertain the negative impacts of TDS consumption on one's health. However, a recommended dosage of 1000 mg L-1 has been established based on taste considerations. Water with exceptionally low TDS levels may not be suitable due to its bland, insipid flavor (Khan and Chohan, 2010). TDS may decrease the irrigated area's hydraulic conductivity, according to Jamrah (1999), and a TDS value above 480 mg L-1 is of concern. Because different geological regions have varied mineral solubilities, the TDS in water greatly varies between them (WHO, 2011). The TDS concentrations and major ions are typically increased as a result of the groundwater being moved and staying along its flow path for an extended period. A high TDS value reflects the water's prolonged residence time. The main factor typically limiting or determining the use of groundwater for any purpose is its TDS concentration (Table 2a).
Davis and DeWiest (1966)
Freeze and Cherry (1977)
TDS (mg L−1)
Classification
TDS (mg L−1)
Classification
< 500
Desirables for Drinking
< 1000
Freshwater type
500–1000
Permissible for drinking
1,000–10,000
Brackish water type
1000–3000
useful for irrigation
10,000–100,000
Saline water type
>3000
Unfit for drinking and irrigation
>100,000
Brine water type
Based on the spatial distribution of hydrochemical groundwater constituents and their suitability for local residential uses and irrigation activities, the current investigation covers a large area of Hail region and seeks to evaluate the groundwater quality in the region using a GIS software package.
2 Materials and methods
2.1 Location and geology of study area
The Hail area lies in the northwest of Saudi Arabia (Fig. 1) and is distinguished by its diverse topography and geomorphology; the region is a part of the huge An-Nafud and the Arabian Shield. Geologically, the vast An-Nafud, which makes up a significant portion of the Hail region, is a sand-filled depression that extends over roughly 64,000 km2 (Fig. 2). The limestone, sand, and steep wades that make up the Arabian Shield, which rises to hills, are distinctive. However, the dunes and sand sheets appear to be made of Paleozoic and Mesozoic sandstones (El-Ghanim et al., 2010). Hail's highest point is more than 1900 m above mean sea level in the province's far southwest corner, while the lowest point on the land is about 667 m. The region is made up of 55,270, 40,650, 18,380, and 1390 km2 of plains, dunes, mountains, and arable land, respectively (Hereher et al., 2012).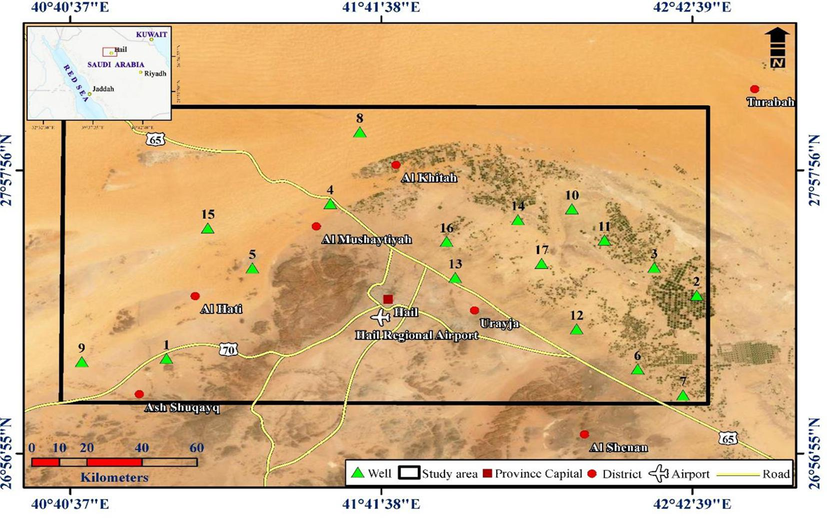
Location map of the study area including the groundwater sampling wells.
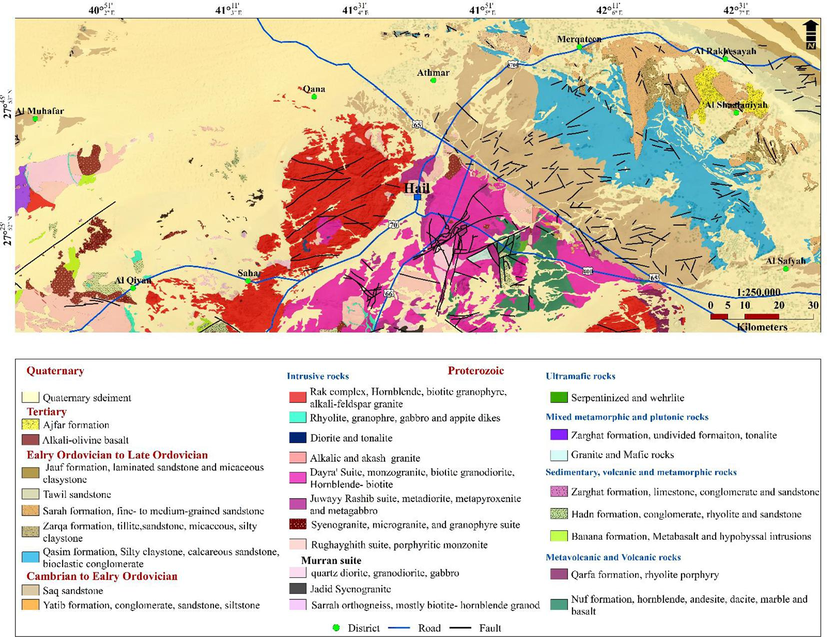
Geological map of the study area.
Precambrian basement rocks, Paleozoic sedimentary formations, and Cenozoic unconsolidated deposits make up Hail geology (McGillivray and Husseini, 1992). As you move from southwest to northeast, the formations get younger and younger. Felsic igneous rocks make up the Precambrian basement rocks. The Saq Formation, Tabuk Formation, Jauf Formation, and Khuff Formation make up the Paleozoic era's sedimentary formation. The principal aquifer exposed in the research region is the Saq formation, which is composed of medium- to coarse-grained sandstone and ranges in age from the Cambrian to the Ordovician. The Tabuk formation, which consists of interbedded layers of sandstone, shale, and siltstone and is older than the Saq formation, varies in age from the Ordovician to the Silurian. The Devonian Jauf formation rocks conformably overlie it (Quartz sandstone, shale, and dolomite). The Permian Khuff Formation lies on top of the Jauf Formation (limestone and shale). The unconsolidated sediments from the Quaternary epoch serve as a representation of the Cenozoic era.
The aeolian sand deposits, which are a part of the Nafud desert, cover the northern portion of the study region. The general flow direction is from west to east, and the piezometric levels range from 910 to 660 m. In the west, the hydraulic gradient is steeper, and it progressively flattens out as you move toward the east (Zaidi et al., 2014). In particular, in the area around the city of Hail, the groundwater levels are around 220 m below the surface and gradually get shallower (54 m) toward the central zone, having deeper water levels than the rest of the region (Fig. 4a). All of the wells that provided the water samples for analysis tap the Saq aquifer, and their depths range from 150 to 850 m.
2.2 Data collection
According to the operating method for groundwater sampling, samples were taken and kept (SESD, 2013). Groundwater quality data were collected in March 2023 from seventeen (17) boreholes to assess the quality of water underlying the study area. Samples were distributed to cover most of the study area. All water samples were gathered in polypropylene (PP) bottles that had been rinsed several times with sample water before collection and then stored at 04 °C in the ice box until subsequent laboratory analysis. Afterward, all water samples were transferred to the King Saud University laboratory for analysis. The samples were analyzed on the next day they were collected. The primary ions of the water samples that were obtained were identified. These groundwater samples had their ionic components Nitrate, Nitrite, and Cl-, minor elements, pH, electrical conductivity (EC), total dissolved solids (TDS), total alkalinity (TA), and total hardness (TH) measured (Table 1). Before taking water samples, groundwater that had become stagnant was flushed out of bore wells for around three minutes. Color, taste, odor, temperature, EC (measured with a conductivity meter), and pH are the physical parameters that are measured and recorded in the field (using pH meter).
2.3 Methodology
Fig. 3 shows the methodology of the current study, which includes groundwater sampling and analysis, comparing the obtained results with national and international standards, spatial distribution for sample locations, and different parameters using GIS.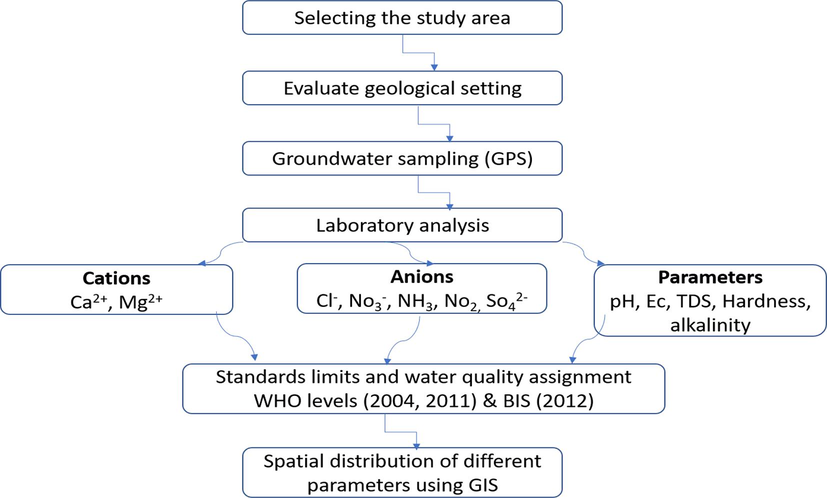
Flowchart of research methodology in the current study.
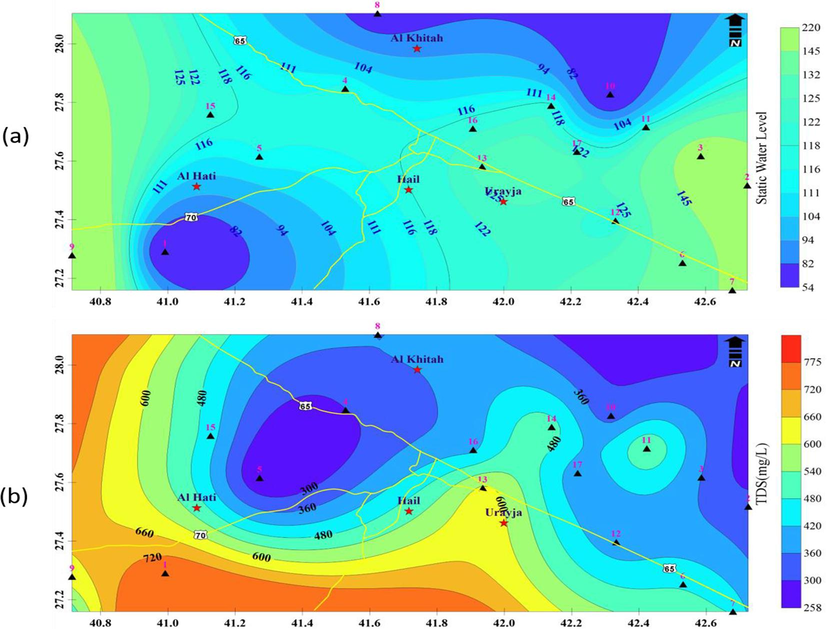
A) the static water level in the study area, b) spatial distribution of tds in the study area.
3 Results and discussions
The results of the physicochemical characteristics of the groundwater have been obtained. Then, compared to the World Health Organization’s (WHO, 2004 and 2011) as well as the Bureau of Indian Standards BIS (2012) recommended values for drinking water and irrigation activities (Table 1).
3.1 Groundwater quality
3.1.1 Total Dissolved Solids, TDS and pH, and Electrical Conductivity (EC)
The TDS content in the water has no health-based limit set by WHO, although beyond 1000 mg/l, the flavor of the water substantially changes. Very little TDS water has a bland flavor (Khan and Chohan, 2010). Geology has an impact on water's TDS since different minerals have varying degrees of solubility in water (WHO, 2011). The interaction of rocks with water and recharging from rainfall both affect TDS concentration. TDS typically establishes the overall quality of groundwater that can be used for a certain purpose. Poor sewage disposal practices, increased mineral dissolution leading to a smaller pH, or seawater intrusion could all contribute to a greater TDS content (Sarath Prasanth et al., 2012; Subba Rao, 2001; Ramesh et al., 2012). Based on the TDS value, the suitability of groundwater for different uses has been categorized, as indicated in Table 2a. According to Table 2a, all groundwater samples are within the levels that are acceptable for drinking water, hence the groundwater that is produced by these wells is good for use in agriculture. In the collected groundwater samples, the TDS values in the current investigation range from 285 to 775 mg.L-1 (Fig. 4b). All groundwater samples fall within the ranges that are safe for domestic drinking.
Besides, it is possible to assess how water interacts with rocks and other objects by looking at its acidic and alkaline qualities (Hem, 1985). According to international standards and the Bureau of Indian Standards (BIS, 2012), the acceptable pH range for drinking water is 6.5–8.5. (WHO, 2004) (Table 1). Acidic water is defined as having a pH of 7 or lower, and alkaline water has a pH of 7 or higher. The collected groundwater samples in the area of study have a pH value between 6.65 and 8.25. This shows that the groundwater of the study area is mainly alkaline in nature.
Moreover, the geochemical processes of ion exchange, reverse exchange, evaporation, silicate weathering, rock-water interaction, sulfate reduction, and oxidation are primarily responsible for the EC variation in general (Ramesh, 2008). The study area's nutrient enrichment, evaporation rate, and arid climate could all be contributing factors to the EC enrichment. High salinity and mineral content are linked to the higher electrical conductivity of water. Ions such as Cl-, and NO3 are present, which adds to the salinity of groundwater. According to WHO 2004 recommendations, 1500 μS·cm−1 is the highest permitted value for EC (Table 2b). According to Manjunatha and Asode (2021), the EC can often be divided into the following four parts: C1: is Low (0–249 μS·cm−1), C2: is Medium (250–749 μS·cm−1), C3: is High (750–2249 μS·cm−1), and C4: is Very High (2250–5000 μS·cm−1). Based on the function of the amount of dissolved mineral matter in the water, electrical conductivity (EC) is determined. Drinking and irrigation waters are typically classified using the criterion EC (Srinivasamoorthy et al., 2014). In the current study, the EC value ranges from 382 to 1250 μS·cm−1 (Fig. 2b). According to this figure, all samples display values less than 1500 μS·cm−1 indicating freshwater. The figure shows that EC smaller values are noticed in the eastern and northwestern zones of the area.
Electrical conductivity (μS·cm−1) for drinking
Classification
Electrical conductivity (μS·cm−1) for irrigation
Suitability for irrigation
<1500
Permissible
Below 250
Entirely safe
1500–3000
Not permissible
250–750
(Moderately saline)Safe under all conditions
>3000
Hazardous750–2250
(medium to high salinity)Safe only with permeable soil and moderate leaching
2250–4000
(high salinity)
Unfair for irrigation
4000–6000
(Very high salinity)
Above 6000
(Excessive salinity)
3.2 Physicochemical parameters
Calculations of the spatial distribution of TDS concentrations and hydrochemical facies can be used to estimate relative groundwater flow rates, identify areas of groundwater mixing, and discriminate between recharge and discharge zones. To depict the main ions' and hydrochemical facies' aerial distribution, contour maps were created.
3.2.1 Sulfate (SO42-)
The highest allowable limit of sulfate in groundwater is 400 mg/L, whereas the desired limit is 250 mg/L, according to WHO (2004). In the current investigation, the sulfate concentration ranges from 29 to 278 mg/L (Fig. 5b). Around well No. 1, in the southwest zone of the study area, higher sulfate values are detected. The presence of sulfide-bearing minerals, the dissolution of gypsum, the usage of sulfate-bearing fertilizers, and industrial wastes are all factors that contribute to the presence of sulfate in groundwater.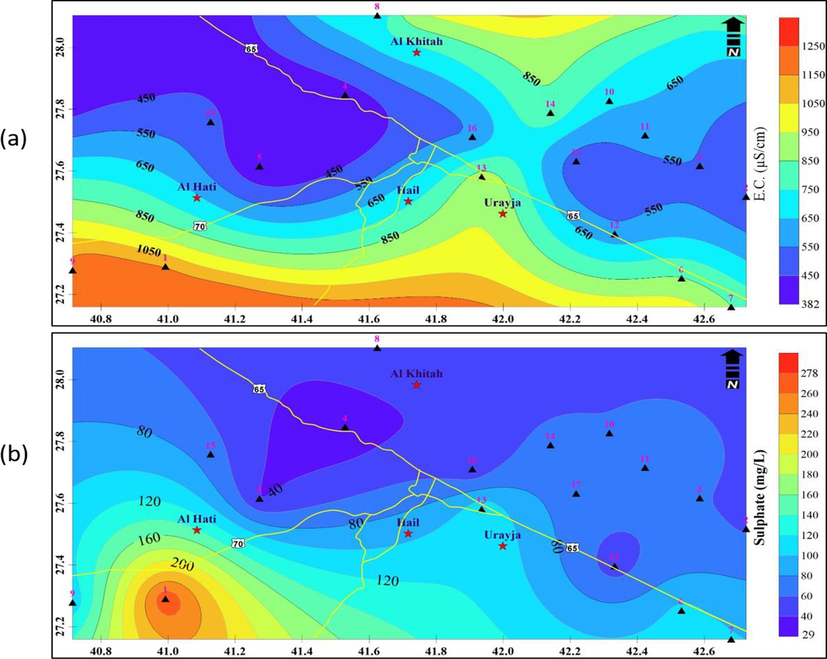
A) spatial distribution of ec and b) distribution of Sulphate in the groundwater.
3.2.2 Total hardness
Due to the presence of CO2 in the atmosphere and plant roots in the soil, precipitation that seeps into the ground is acidic. The groundwater becomes harder as a result of the low pH solution dissolving insoluble carbonates and contaminants such as sulfates, chlorides, and silicates. Higher hardness water should not be used for home or industrial uses (Sarath Prasanth et al., 2012; Gopinath et al., 2015; Tahlawi et al., 2016; Nag and Lahiri, 2012).
The carbonate hardness is primarily caused by the carbonate and bicarbonate salts of calcium and magnesium. Other than carbonate and bicarbonate salts, calcium and magnesium salts are responsible for non-carbonate hardness (such as calcium sulfate, CaSO4, or magnesium chloride, MgCl2). The sum of the hardness of carbonates and non-carbonates is the total hardness, which varies in severity with alkalinity. The bulk of natural water contains bicarbonate ions, which are typically coupled with calcium, magnesium, and to a lesser extent, sodium and potassium (Shov, 2014).
The main factors for water hardness are calcium and magnesium. The hardness is often expressed as an equivalent concentration of dissolved calcite and describes the concentrations of particular metallic ions in water, particularly those of magnesium and calcium (CaCO3). When detergent and the metallic ions in hard water interact, an insoluble deposit may result. If the water is hard, these kinds of metallic ions may also react with negatively charged ions to form a solid precipitate. Using the formula shown below, the total hardness of the water samples was calculated (Todd, 1980):
where the amounts of calcium and magnesium are given in milligrams per liter.
In the area of interest, the total hardness of the water samples ranges from 72 to 430 mg/L (Fig. 6a). The classification of the water samples by Sawyer and McCarty (1967) was soft, moderately hard, hard, and very hard (Table 2c). The gathered water samples are exceedingly hard, as shown in this table.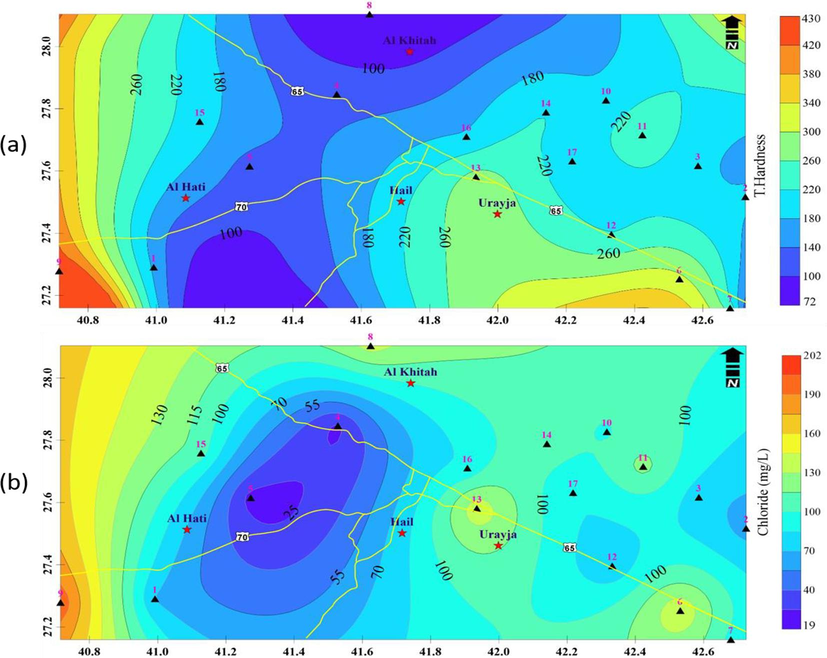
A)Total Hardness (TH) distribution in groundwater samples, b) Cl- concentrations in the groundwater samples.
Total hardness (mg L−1)
Type of water
Remarks
< 75
Soft
Require little or no softening
75–150
Moderately hard
Require little or no softening
150–300
Hard
Require softening
> 300
Very hard
Require softening
3.2.3 Chloride (Cl-)
Chlorides were a frequent component of pure natural water. Cl- was present in detectable concentrations between 19 and 202 mg/L (Fig. 6b). The percolation of irrigation return water or interconnection with higher, more salty strata may be to blame for the excessive levels of Cl- in the investigated groundwater (Sharaf and Hussein, 1996; UN-ESCWA and BGR, 2013). When groundwater with high amounts of Cl- is used for irrigation, the plants may become poisonous because the Cl- is not absorbed by the soil and instead travels with the water in the soil, where it is absorbed by plants and stored in their leaves (Hussain et al., 2010).
3.2.4 Ammonia (NH3)
When ammonia concentrations in water rise above the ppm limit, it becomes a poisonous toxin and a health risk. Unionized ammonia or the ammonium ion (NH4+) are the two forms of ammonia in water. Usually, total ammonia or ammonia is stated as the figure, which is the total of both types. Ammonia can also come from organic debris, feces, or fertilizers, which are the main sources of pollution in homes, businesses, and agriculture. The pH level has a significant impact on how much of the two types are present in water relative to one another. When the pH is high, unionized ammonia, a poisonous form, predominates. When the pH is low, the ammonium ion, which is comparatively harmless, dominates.
When the pH is below 8.0, less than 10 % of the ammonia is typically in its hazardous form. As the pH rises, this ratio grows significantly. The temperature has an impact on the equilibrium between NH3 and NH4 + . Warmer water contains more hazardous ammonia than colder water at any pH. Natural ammonia concentrations in groundwater are typically less than 0.2 mg/L. In layers with high concentrations of human compounds, iron, or wood, higher natural amounts (up to 3 mg/L) can be detected (Dieter et al., 1991). Ammonia concentrations in surface water can reach 12 mg/L. (WHO, 1986). The ammonia concentration in the study region ranges from 0.0 to 1.5 mg/liter (Fig. 7a). In general, it is less than 0.4 mg/liter, but well No. 4 has a unique circumstance that results in a high concentration that may be a common indicator of anthropogenic impacts, such as landfill leachate or agricultural activity and/or due to the decay of natural organic material.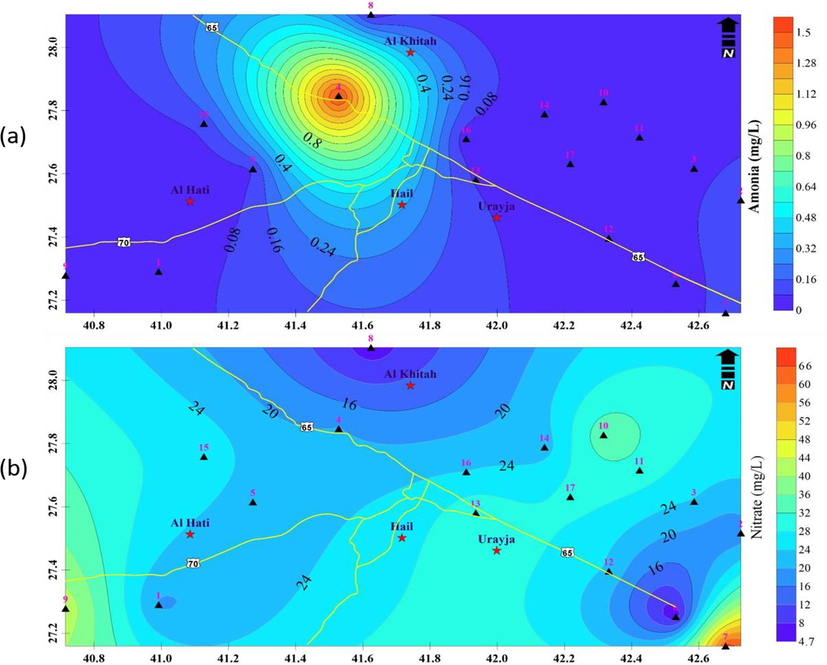
A) ammonia concentrations in the groundwater, b) nitrate concentrations in the groundwater samples.
3.2.5 Nitrate (NO3) and Nitrite (NO2)
Under aerobic conditions, the natural nitrate concentration in groundwater is a few mg/L and is highly dependent on the soil type and geology (WHO, 2011). In industrial locations, rainfall nitrate concentrations of up to 5 mg/L have been recorded (van Duijvenboden and Matthijsen, 1989). Normal surface water nitrate concentrations range from 0 to 18 mg/L, although agricultural runoff can cause these levels to rise. In most nations, the amount of nitrate in drinking water that is made from surface water does not exceed 10 mg/L. However, owing to runoff, sewage effluent discharge, and industrial waste discharge, the concentrations are higher in some locations. Nitrite concentrations in drinking water are typically less than 0.1 mg/L. In the Netherlands, a high value of 0.21 mg/L was found in 1993. (RIVM, 1993). As the water travels to the system's edges, the concentration of nitrite could rise. Generally, nitrification in distribution systems has the potential to elevate nitrite levels by up to 3 mg/L. (AWWARF, 1995). Fertilizers and household trash that were transformed into nitrates in the soil are the main sources of nitrogen compounds (Kumar et al., 2009).
Away from the Hail urban area and in the farmland where farmers applied fertilizers for agricultural activities, both ions' concentrations rise. In the studied region, the nitrate concentration ranges from 0.14 to 25.08 ppm (Fig. 7b). In the northern and eastern zones, the value rises while falling in the southwest. The nitrite readings range from 0.015 to 0.136 ppm (Fig. 8a) where the minimum values are recorded in the central zone and increased away from the center.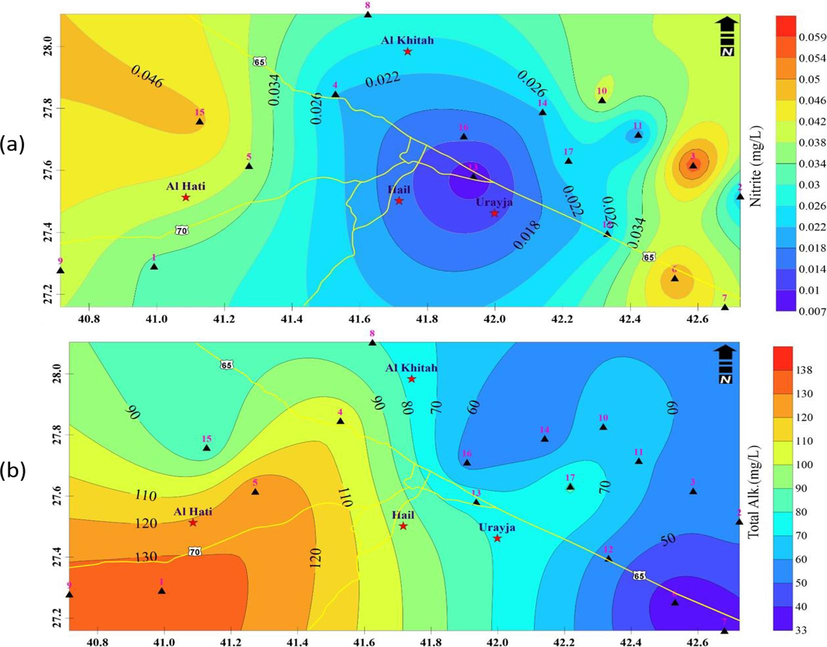
A) spatial variations of nitrite concentrations in the groundwater samples, b) total alkalinity values of groundwater samples.
3.2.6 Alkalinity
It is common to interpret the alkalinity of surface and groundwater in terms of the concentrations of the constituent’s carbonate, bicarbonate, and hydroxide. Water's ability to neutralize acids increases with increasing alkalinity; on the other hand, its ability to do so decreases with decreasing alkalinity. The phenolphthalein and total alkalinity of the water were measured to identify various alkalinity types. Bicarbonate is connected to neutral water's overall alkalinity (Shov et al., 2014). In irrigation water, bicarbonate is a significant anion that is linked to calcium and, to a lesser extent, magnesium (Basavarajappa and Manjunatha, 2015). The WHO's recommended limits for all groundwater samples are met; the HCO3– the maximum permitted limit is 300 mg L-1 (WHO, 2011). Since it is the most prevalent anion in groundwater, silicates and weathering are the main causes of its dissolution in groundwater (Srinivasamoorthy et al., 2014).
All of the sampling wells recorded normal levels ranging from 33 to 138 mg.L-1 (Fig. 8b) that were within the WHO's 2011 total alkalinity limits (200 mg.L-1). In the southwest of the Hail region, these values rise while falling in the east of Hail. The source of all the alkalinity in neutral water is bicarbonate (Shov et al., 2014). In irrigation water, bicarbonate is a significant anion concerning calcium and to a lesser extent magnesium (Basavarajappa and Manjunatha, 2015). Total alkalinity, a common anion in groundwater, dissolves primarily as a result of silicate breakdown and rock weathering (Srinivasamoorthy et al., 2014).
4 Conclusions
Groundwater samples from 17 wells in Hail area were collected, and their chemical and physical characteristics were examined and then compared to the World Health Organization's standard drinking water guidelines (SASO, 2000; WHO, 2008 and 2011). Based on the Hydrochemical analysis, groundwater contains acceptable concentrations of EC, total hardness, reasonable TDS, pH, Cl-, and alkalinity values. Groundwater has been classified based on TDS values, to determine its suitability for drinking and irrigation uses. All groundwater samples in the area of interest are freshwater (Freeze and Cherry, 1977). About 70.58 % of the sample has TDS levels below 500 mg/l, which are safe for drinking. Moreover, the EC of the groundwater revealed that 100 % of the samples fall within the permissible limit, though some samples are marginally well in quality by the World Health Organization (WHO) standard. Other factors influencing water quality are the type of rocks, the geological formation, and the weathering process occurring in the region. It can be concluded that the groundwater is valid for drinking and irrigation purposes. The outcome of this research work can be used by policy-makers, and local and regional authorities, to improve groundwater management and offer safe drinking water to all populations in arid and semi-arid areas.
Acknowledgments
The author extends his sincere appreciation to the Researchers Supporting Project number (RSPD2024R546) at King Saud University in Riyadh, Saudi Arabia
Declaration of competing interest
The authors declare that they have no known competing financial interests or personal relationships that could have appeared to influence the work reported in this paper.
References
- Alfaifi H. J., Kahal A. Y., Abdelrahman K., Zaidi F. K., Albassam A., Lashin A. (2020). Assessment of groundwater quality in Southern Saudi Arabia: a case study of Najran area. Arabian Journal of Geosciences (2020) 13:101.
- Groundwater Quality Assessment for Drinking and Irrigation Purposes at Al-Jouf Area in KSA Using Artificial Neural Network, GIS, and Multivariate Statistical Techniques. Water. 2023;2023(15):2982.
- [CrossRef] [Google Scholar]
- Integrated approach for the investigation of groundwater quality using hydrochemical and geostatistical analyses in Wadi Fatimah, western Saudi Arabia. Front. Earth Sci.. 2023;11:1166153.
- [Google Scholar]
- Nitrification occurrence and control in chloraminated water systems. Denver Co: American Water Works Association Research Foundation; 1995.
- An Assessment of Irrigation Water Quality with Respect to the Reuse of Treated Wastewater in Al-Ahsa Oasis, Saudi Arabia. Water. 2023;15:2488.
- [Google Scholar]
- Application of multivariate statistical methods and inverse geochemical modeling for characterization of groundwater - A case study: Ain Azel plain (Algeria) Geoderma. 2010;159:390-398.
- [Google Scholar]
- A Multidisciplinary Approach for Groundwater Potential Mapping in a Fractured Semi-Arid Terrain (Kerdous Inlier, Western Anti-Atlas, Morocco) Water. 2022;14:1553.
- [CrossRef] [Google Scholar]
- Estimating and plotting of groundwater quality using WQIUA and GIS in Assiut Governorate, Egypt. World J Eng Technol. 2016;4:59-70.
- [CrossRef] [Google Scholar]
- Groundwater quality assessment for drinking purposes: a case study in the Mekong Delta. Vietnam: Scientific Reports; 2023. 10.1038/s41598-023-31621-9
- (2015): Hydrogeochemical characteristics of coastal groundwater in Nagapattinam and Karaikal aquifers: implications for saline intrusion and agricultural suitability. Coast Sci J Figshare 2015
- [CrossRef] [Google Scholar]
- (1964): Modified classification procedure for rating irrigation waters. SoilSci. 1964;98:264-269.
- [Google Scholar]
- (1965): Modified Hill-piper diagram for the presentation of water analysis data. Curr Sci. 1965;34:131-314.
- [Google Scholar]
- Study and interpretation of the chemical characteristics of natural water. USGS Water Supply Paper. 1985;2254:117-120.
- [Google Scholar]
- Land cover classification of Hail-Saudi Arabia using remote sensing. Int. J.Geosci.. 2012;3:349-356.
- [Google Scholar]
- Guidelines for irrigation water quality and water management in the Kingdom of Saudi Arabia: an overview. J. Appl. Sci.. 2010;10(2):79-96.
- [Google Scholar]
- Assessing Groundwater Quality for Drinking Purpose in Jordan: Application of Water Quality Index. Journal of Ecological Engineering.. 2019;20(3):101-111.
- [Google Scholar]
- Iddrisu, U. F., Valentine Chi Mbatchoua, Edward Kwaku Armaha and Bright Selorm Amedormeb (2023): Groundwater quality assessment for sustainable irrigation in Nanton district, Ghana. Water Practice & Technology Vol 18 (18), : 10.2166/wpt.,125.
- (1940): Permissible composition and concentration of irrigation waters. Proc ASCE. 1940;66:607.
- [Google Scholar]
- Hydrochemistry for the assessment of groundwater quality in the Kathua region, Jammu and Kashmir. India. Appl. Water Sci.. 2022;12:143.
- [Google Scholar]
- Assessment of subsurface water quality for irrigational suitability in Raichur Taluk, one of the hard rock regions of Karnataka. J. Appl. Geochem.. 2021;23(2):99-107.
- [Google Scholar]
- Hydrochemical characteristics of groundwater for domestic and irrigation purposes in Dwarakeswar watershed area, India. Am J Clim Change. 1979;01(04):217-230.
- [CrossRef] [Google Scholar]
- Hydrochemical characteristics of groundwater for domestic and irrigation purposes in Periyakulam Taluk of Theni District, Tamil Nadu. I Res J Environ Sci. 2012;1:19-27.
- [Google Scholar]
- RIVM, 1993. Maintenance of the environmental law 1995/1997. The quality of drinking water in the Netherlands in 1993. Bilthoven, National Institute for Public Health and the Environment (RIVM Report No. 731011007).
- Salem Z. E., Abdelrahman k., Kovácˇiková S., Badran O. M., 2021. Use of various statistical techniques to assess the vertical and lateral change in the groundwater chemistry of Quaternary aquifer in an irrigated highly populated area. Journal of King Saud University – Science 33, 101556.
- Evaluation of groundwater quality and its suitability for drinking and agricultural use in the coastal stretch of Alappuzha District, Kerala, India. Appl Water Sci.. 2012;2(3):165-175.
- [CrossRef] [Google Scholar]
- Chemistry of sanitary engineers (2nd ed.). New York: McGraw Hill; 1967.
- SESD, 2013. U.S. Environmental Protection Agency-Science and Ecosystem Division, Operating Procedure for Groundwater Sampling, SESDPROC-301-R3.
- Hydrochemical characterization and quality appraisal of groundwater from Pungar sub-basin, Tamilnadu, India. Journal of King Saud University – Science. 2014;26:37-52.
- [Google Scholar]
- Subba Rao, N., 2001. Geochemistry of groundwater in parts of Guntur district, Andhra Pradesh, India. Env Geol 41(5), 552–562. 10. 1007/s002540100431.
- Groundwater quality and its suitability for drinking and agricultural use in Chithar River Basin, Tamil Nadu, India. Environ. Geol.. 2005;47(8):1099-1110.
- [Google Scholar]
- Groundwater hydrology ((2nd ed.).). New York: Wiley; 1980. p. :31.
- van Duijvenboden, W.; Matthijsen, A.J.C.M., 1989. Integrated criteria document nitrate. Bilthoven, National Institute for Public Health and the Environment (RIVM Report No. 758473012).
- Nitrate and nitrite in drinking water, background document for development of WHO guidelines for drinking-water quality. WHO/SDE/WSH/07.01/16/Rev/1 2011
- [Google Scholar]
- World Health Organization, WHO (2004): WHO guidelines for drinking-water quality, 4th ed.
- Factors Governing Groundwater Chemistry in Paleozoic Sedimentary Aquifers in an Arid Environment: A Case Study from Hail Province in Saudi Arabia. Arab J Sci Eng 2014
- [CrossRef] [Google Scholar]


