

Translate this page into:
Groundwater potentiality in hard-rock terrain of southern Saudi Arabia using electrical resistivity tomography approach
⁎Corresponding author at: Kamal Abdelrahman, Department of Geology and Geophysics, College of Science, King Saud University, Riyadh, Saudi Arabia. khassanein@ksu.edu.sa (Kamal Abdelrahman)
-
Received: ,
Accepted: ,
This article was originally published by Elsevier and was migrated to Scientific Scholar after the change of Publisher.
Peer review under responsibility of King Saud University.
Abstract
To detect groundwater-bearing zones in southern Saudi Arabia, 10 profiles of 2D electrical have been constructed resistivity tomography at five selected sites. The collected data were corrected and processed using the RES2DINV software. The results demonstrated that site-1 contains two groundwater-bearing zones; the first zone is situated 13 m beneath the ground surface, while the depth of the second zone varies from 4 m to 15 m. A promising 15-m-deep groundwater-bearing zone was identified at site 2. The groundwater-bearing zones exhibit depths of 40, 10, and 10 m at sites 3, 4, and 5, respectively. The detected groundwater-bearing zones are notably shallow, with a depth of 20 m below the ground surface and with lateral extension up to 200 m. These aquifers prevail in the alluvial deposits, where the weathered/fractured or fresh basement rocks underlying these aquifers. Moreover, rainfall recharges these unconfined aquifers, as evidenced by the increasing water levels along the main Wadi channels flow during rainy seasons. Sites 2, 3, and 5 are considered as groundwater-bearing sources with high potential. Because this unconfined aquifer can be swiftly replenished by the 300–360 mm of annual rainfall in the southern Saudi lowlands, it is a promising area for groundwater supply for future urbanization plans and agricultural projects in neighboring areas.
Keywords
Groundwater-bearing zones
ERT
Southern Saudi Arabia

1 Introduction
Saudi Arabia is a dry region with scarce surface water resources; therefore, exploring groundwater resources for drinking, irrigation, and various other applications is necessary. Fractionation processes can considerably affect the groundwater in arid places, such as Saudi Arabia, where precipitation is infrequent and evaporation rates are high. This observation is applicable to alluvial deposits in the kingdom’s southern region. Memon et al. (1984), Jamman (1978), and Alharbi et al., (2023) discovered that the primary determinants of groundwater salinity in the main Wadis of the southern region are rock types and agricultural activities. Groundwater supplies are further influenced by regional geological, morphological, tectonic, and climatic factors. The alluvium fractures and fills hold the majority of the available water in the arid regions. Hence, any assessment of a groundwater supply is considerably affected by geological factors that render the recharging process easier by linking surface discharge to the groundwater reservoir. In particular, the recharge process is controlled by geological features comprising faults, voids, fissures, fractures, crevices, solution cavities, and other structural geological characteristics.
Most Wadis in southern Saudi Arabia are composed of Quaternary deposits, weathered, and fractured basement rocks. The majority of groundwater reserves are believed to be concealed within Quaternary strata. Moreover, groundwater is often located in the Wadi alluviums of arid regions as unconfined aquifers with a saturation thickness that seldom surpasses 100 m. For instance, in southern Saudi Arabia, the deepest alluvium stratum is approximately 60 m deep. Therefore, deeper wells cannot be excavated to capture more groundwater. Consequently, knowledge of groundwater depth remains one of the limiting factors for the strategic planning of groundwater resources in the southern region of the Kingdom of Saudi Arabia. The underlying unsaturated thickness will be considered for potential post-recharge groundwater reservoir improvement. Besides thickness, the size of the groundwater reservoir is another element influencing spatial availability.
The measurement of direct-current (DC) resistivity is a conventional geophysical method in which two electrodes are employed to inject electricity into the ground, while two additional electrodes measure the electric potential difference. These measurements are commonly conducted along a line or at a specific location on the surface of the ground, and the potential differences are subsequently converted into sounding curves or pseudo-sections of apparent resistivities, illustrating resistivity variations in subsurface rocks. We can characterize the subsurface geological structure and identify anomalies using subterranean resistivity data analysis. With the evolution of computer technology and numerical computing techniques, substantial data collection from fields and precise numerical simulations of subsurface electrical fields are possible (Smith and Vozoff, 1984; Sasaki, 1992; Dahlin, 1996). Electrical resistivity tomography (ERT), a computerized tomography technique, was developed as a result of progressions made from the traditional DC resistivity explorations. The technique employs multi-electrode equipment or systems to automatically procure electrical resistivity profiles. Currently, ERT is extensively utilized in mineral exploration, civil engineering, hydrological prospecting, environmental studies, and archaeological mapping due to its straightforward conceptual design, economical equipment, and convenience of use (Dahlin and Zhou, 2004).
Owing to their reliability and simplicity in collecting subsurface information non-destructively, based on resistivity contrasts between dissimilar layers, electrical resistivity surveys have long been employed for groundwater exploration in arid regions (Pellerin, 2002; Yadav and Singh, 2007; Store et al., 2000). ERT has been implemented in most groundwater investigations to associate the electrical characteristics of geologic formations with their hydraulic content (Flathe, 1955 and 1970; Ogilvy, 1970; Zohdy et al., 1974). The shape of the aquifers has remained a focal point in previous analyses (Robin et al., 1995). Factors such as the salinity of the formation fluid, lithology, porosity, and the saturation of the aquifer predominantly affect electrical resistivity. This method has been effectively utilized globally to evaluate groundwater quality. Aquifer boundaries, as well as the depth, type, and thickness of alluvium, are frequently discerned through the electrical resistivity approach. Additionally, this approach depicts the porosity, water content, and hydraulic conductivity of the aquifer, as well as the boundary between freshwater and saltwater. In Saudi Arabia, ERT has been regionally applied in intricate geological environments for cavity detection (Zaidi and Kassem, 2012; Alzahrani et al., 2022); seawater intrusion (Alfaifi et al., 2019); and groundwater potentiality in hard rocks (Almadani et al., 2017; Alshehri and Abdelrahman, 2021 and 2023a&b; Alshehri et al., 2022; Alarifi et al., 2022 a & b).
Prior to groundwater exploration in igneous rock, geological structures such as geological contacts, faults, and fissures must be located. Geology of the southern Saudi Arabia considerably affects the groundwater potential, which is a portion of the Arabian Shield. Groundwater investigation is made particularly challenging by the hard-rock topography when possible groundwater zones are connected to fractured and fissured rocks. The thickness of the weathered/fractured layer above the massive basement is the fundamental factor affecting the groundwater potential in this region. To identify the groundwater-bearing strata and their expansion across the southern Saudi Arabia pathway, the depths of competent bedrock and groundwater table and layer borders were evaluated in this study. Basement rocks that have undergone extensive deformation and fracture make up southern Saudi Arabia. Therefore, groundwater will be refilled by the Quaternary Wadi fill deposits and fissures and fractures in the bedrock. This area of interest has never been studied previously, which substantiates the novelty of this study, especially in terms of detecting groundwater resources. This is because the studied sites are adjacent to numerous settlements that depend on water for domestic and agricultural usage.
2 Materials and methods
2.1 Study area
The region under investigation is situated in southern Saudi Arabia, as depicted in Fig. 1. The primary drainage basins in this southern region are expected to encompass the major wades of the region, which serve as the primary supply of groundwater for the neighboring communities. Within the upper reaches of the basin, the average annual precipitation is approximately 280 mm (Kahal et al., 2021). More than 70% of this yearly precipitation descends between December and January, constituting the rainy season that persists from December to May. Precipitation is scant throughout the remaining months. The lower parts of the basin, where the annual average precipitation is less than 70 mm, rank among the most arid regions in this area. The high yearly evaporative capacity, exceeding 1000 mm yr−1, appears quantitatively consequential for the overall water quality and balance. Maximum temperatures during the summertime typically range between 30 °C and 35 °C. However, impermeable lithologies in the higher topographical catchment area cause a substantial proportion of rainwater to be channeled into surface water. The water table, traditionally regarded as the principal source of aquifer recharge, can rapidly assimilate runoff water into the aeration zone. The geological setting exerts a pronounced influence on groundwater accumulations, particularly where the thin Quaternary alluvial deposits atop the bedrock become partially saturated with water during recharge events, as illustrated in Fig. 2. Following the receding of floodwaters, subsurface drainage and evaporation processes result in a temporary yet dramatic decrease in the water level. The majority of the operational wells have been excavated through diverse cracked and weathered rocks. Although the supplies from the surficial deposits above these rocks can be inconsistent and may entirely deplete during the dry season, the largest groundwater extractions are sourced from these zones, wherein the water table remains relatively shallow.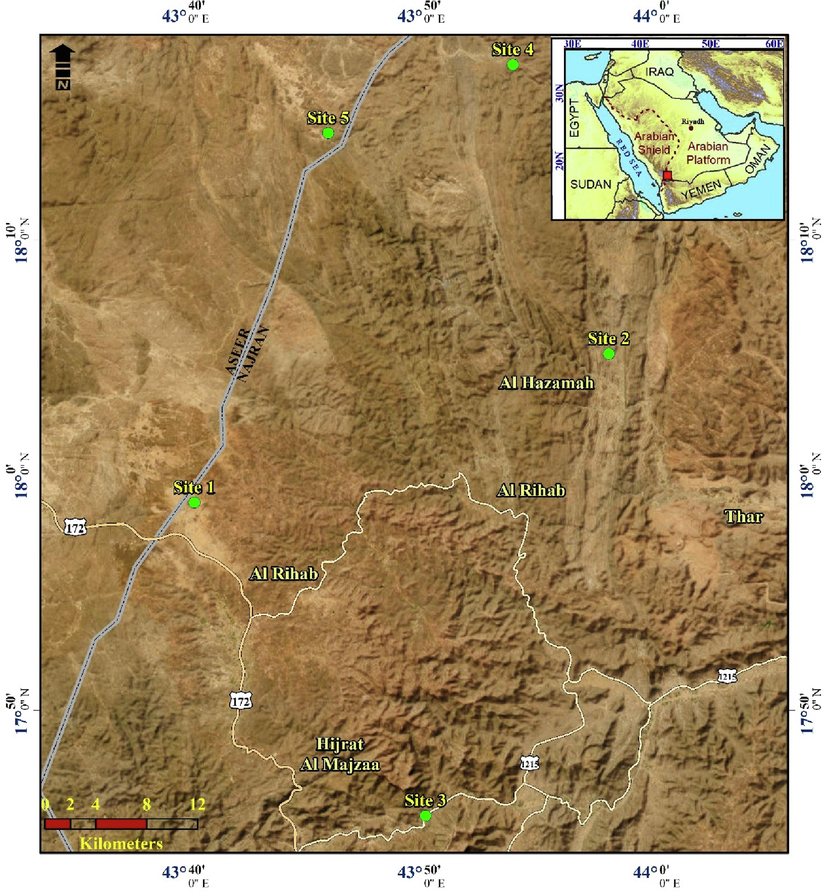
Location map of the study area including ERT surveying sites.
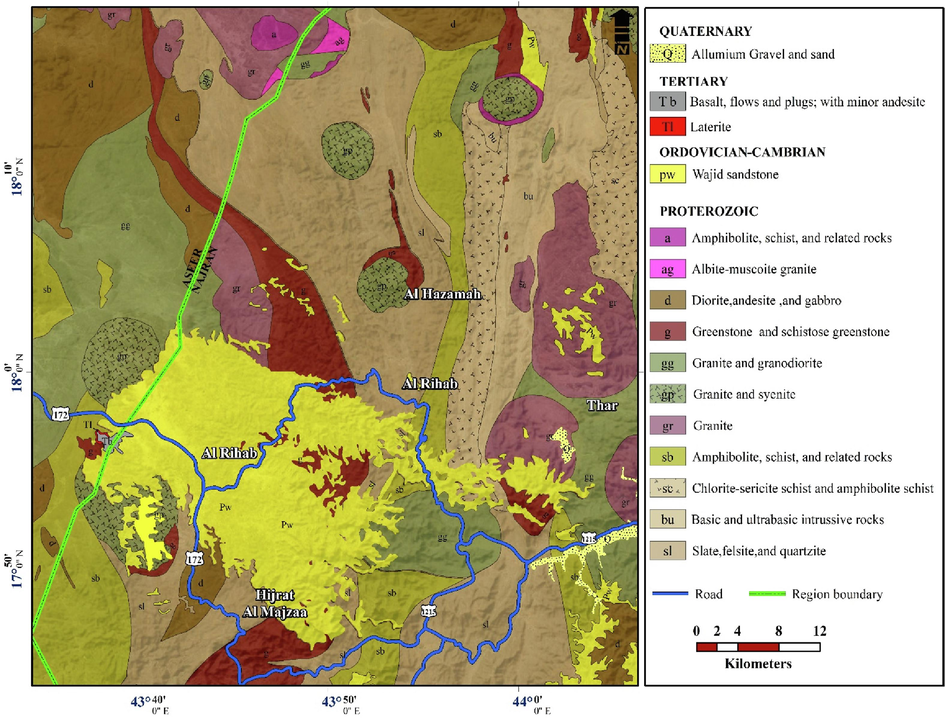
Geological map for the area of study.
2.2 Methodology
In 2D ERT, a system employing a multi-electrode resistivity meter, where electrodes are aligned uniformly along a straight line, is utilized. Active electrodes for each measurement are subsequently selected using a computer-controlled mechanism (Griffiths and Barker, 1993; Keller and Frischknecht, 1996). The length of the array delineates the maximum depth penetration attainable for ERT investigations. The obvious subsurface electrical resistivity distribution is gauged using a set of four electrodes. By employing a direct current (DC) or an extremely low–frequency alternating current between a paired set of electrodes, and by observing the consequential electrical potential difference with an additional pair of electrodes, the apparent resistivity can be computed using a derivation of Ohm’s Law. The subsurface resistivity distribution is thereby determined using the resistivity method. Table 1 in Keller and Frischknecht (1996) shows the resistivity values for various customary rocks and soil types. The resistivity metrics for igneous and metamorphic materials are generally elevated. The resistivity of these rocks is contingent on their degree of fracturing, as fractures often harbor groundwater, typically due to low water table. Correspondingly, the resistance of the rock decreases with increasing fracturing. For instance, the resistivity of granite ranges from 10,000 Ω·m in arid conditions to 5,000 Ω·m in damp conditions. When saturated with groundwater, these materials' resistivity values fluctuate between a few Ω·m to less than 100 Ω·m. Contrarily, soils above the water table, being dry, exhibit resistivity values in the hundreds to thousands of Ω·m, unlike the soils beneath the water table, which typically exhibit resistivity values less than 100 Ω·m. Moreover, compared to sand, clay manifests a substantially lower resistivity. Factors such as the amount of connected pore water, porosity, total dissolved solids including salts, and mineral composition, influence the resistivity of soil or rock (Zohdy et al., 1974; Summer, 1976; Reynolds, 1997; Rubin et al., 2006). The resistivity values of common rocks and soils are cataloged in Table 1.
Material
Resistivity (Ω.m)
Igneous/metamorphic rocks
Granite
Weathered granite
Basalt
Quartz
Marble
Schist
5 X 10³ –108
103 –105
103-106
103 − 2x10⁶
102 –2.5x10⁸
2–104
Sediments
Sandstone
Conglomerate
Shale
Limestone
8–4 x10³
2x10³ - 104
20–2 x10³
50 – 4 x10³
Unconsolidated sediments
Alluvium
Sand
Clay
Marl
10–800
60–1000
1–100
1–70
Groundwater
Freshwater
Saltwater
10–100
0.2
2.3 ERT field data collection
Direct current is used in ERT, which is a near-surface geophysical technique and is deployed to ascertain the earth’s resistivity. Upon the generation of an electric field, the electric voltage within the ground undergoes fluctuations corresponding to the electric resistance of the disparate materials present. The underlying concept of surface electrical resistivity surveys posits that the distribution of electrical potential in the ground surrounding a current-carrying electrode is governed by the electrical resistivities and spatial arrangement of the adjacent soils and rocks. Pertinent to the current study, data from ERT scans across five sites were compiled in July 2022 (Fig. 1). At each designated site, two intersected profiles were established: one oriented parallel to the principal Wadi flow and the other directed across the Wadi flow. The execution of most electrical resistivity methodologies necessitates two electrodes firmly embedded in the earth to transmit electrical currents into the subsurface strata. By monitoring the resulting alterations in electrical potential at further pairs of implanted electrodes, discrepancies in resistivity can be discerned (Dobrin, 1988; Ozcep et al., 2009; Alile et al., 2011). In this study, Iris Syscal Pro resistivity instruments from IRIS Instrument (Oreland, France) were selected, owing to their provision of the commendable resolution, which is attributed to their employment of a dipole–dipole array coupled with multiple electrode locations (Ward, 1990; Bernard et al., 2006). To undertake a resistivity survey and secure high-definition data, a variable number of electrodes were utilized for each profile, contingent on the accessible area and the breadth of the principal wades (Table 2). The placement of stations along the survey lines was facilitated using the Garmin Navigation System (Garmin Ltd., Southampton, UK). Parallel Cross Parallel Cross Parallel Cross Parallel Cross Parallel cross
Parameter
Profile No. 1
Profile No. 2
Profile No. 3
Profile No. 4
Profile No. 5
Number of spreads
1
1
1
1
1
Number of electrodes
58
38
126
50
46
Electrode spacing
1.5 m
1.5 m
1.5 m
1.5 m
1.5 m
Total length
78 m
57 m
189 m
75 m
69 m
Instrument used
IRIS Syscal Pro resistivity meter
IRIS Syscal Pro resistivity meter
IRIS Syscal Pro resistivity meter
IRIS Syscal Pro resistivity meter
IRIS Syscal Pro resistivity meter
Orientation relative to the main Wadi Flow
Surface conditions
Sandy soil with gravel
Sandy soil with gravel
Sandy soil with gravel
Sandy soil with gravel
Sandy soil with gravel
3 Data analysis
The geoelectric data procured during field measurements are encapsulated by the apparent resistivity pseudo-sections, which approach the subsurface resistivity. The resistivity field data, extracted from the individual spread by employing the dipole–dipole array, underwent processing via Prosys II software from IRIS Instruments. Distinct profiles were concatenated prior to inversion, and efforts were undertaken to construct a realistic model that accurately depicts the continuous distribution of calculated electrical resistivity in the subsurface. To this end, values characterized by noise and spikes were eliminated. Moreover, the electrical resistivity data were meticulously filtered to remove readings significantly influenced by noise, and extremes of high and low resistivity concerning adjacent stations at selected sites were expunged.
Subsequently, the rapid two-dimensional (2D) resistivity inversion procedure was executed utilizing the RES2DINV software (Loke and Barker, 1996; Loke, 2002). This inversion method was innovatively designed for the interpolation and interpretation of field data stemming from electrical geophysical prospecting (2D sounding) of electrical resistivity. According to Sasaki (1989), DeGroot-Hedlin and Constale (1990), and Loke et al. (2003), it uses finite element and finite difference regularized least-squares optimization techniques. The technology of electrical resistivity imaging can now render more reliable subsurface images, abetted by the advent of automated data-collection methodologies with efficient and user-friendly inversion software (Aning et al., 2013).
To attenuate the divergence between the computed and empirical apparent resistivity values, the resistivity of the model underwent reformulation through multiple iterations. Such discrepancy may be quantified and graphically depicted via a root-mean-square (RMS) value. However, the resultant model, despite potentially bearing a low RMS, may not invariably constitute the most precise geological representation. Variability in site conditions leads to instances where some models demonstrate a minimal RMS error (less than 5%), while others manifest substantial RMS error (exceeding 10%). In particular circumstances, models with elevated RMS might still find application if they align more congruously with other profiles and offer a more accurate portrayal of the geological milieu. The ERT profiles disclose that localized fluctuations in subsurface resistivity were the causal factors for the vertical alterations in resistivity values. The data inversion procedure, predicated on the formulation of the subsurface model proximate to the apparent resistivity one, was executed through the optimization technique. The model underwent successive revisions until a satisfactory alignment between the calculated and observed sections was achieved.
4 Results and discussion
The 2D geoelectric cross-sections of two ERT profiles intersect at site-1 (Fig. 3), where the upper segment aligns parallel to the primary Wadi flow and the lower segment stretches across the Wadi trajectory. These sections have a depth of 20 m, with each profile comprising 58 electrodes spaced at intervals of 1.5 m and measuring an aggregate length of 78 m. The data from this section indicates that the resistivity spans the entire profile, ranging from 0 Ω·m to 3600 Ω·m. Within the upper section (a), two groundwater-bearing zones characterized by low resistivity (less than 100 Ω·m) are discernible. The first zone extends horizontally from the 28th to the 45th meter from the commencement point of the profile and reaches a depth of 13 m beneath the ground surface. Meanwhile, the second zone initiates at the 45th meter and extends beyond 40 m to the termination of the profile, with a depth ranging from 4 m to 13 m. The bottom section reveals two zones of constrained expansion; the initial one stretches laterally from 25 m to 33 m and from 12 m to 16 m in depth, while the second one spans from 55 m to the profile’s conclusion, with a depth ranging from 5 m to 15 m. Notably, both sections exhibit shallow depths for groundwater-bearing zones, encompassed within the alluvial deposits. Subjacent to these zones, a high-resistive zone is encountered in the eastern and western portions, with resistivity levels registering at 2500 Ω·m. Represented by weathered or fractured basement rocks, this zone culminates at a depth of 20 m at the profile’s end.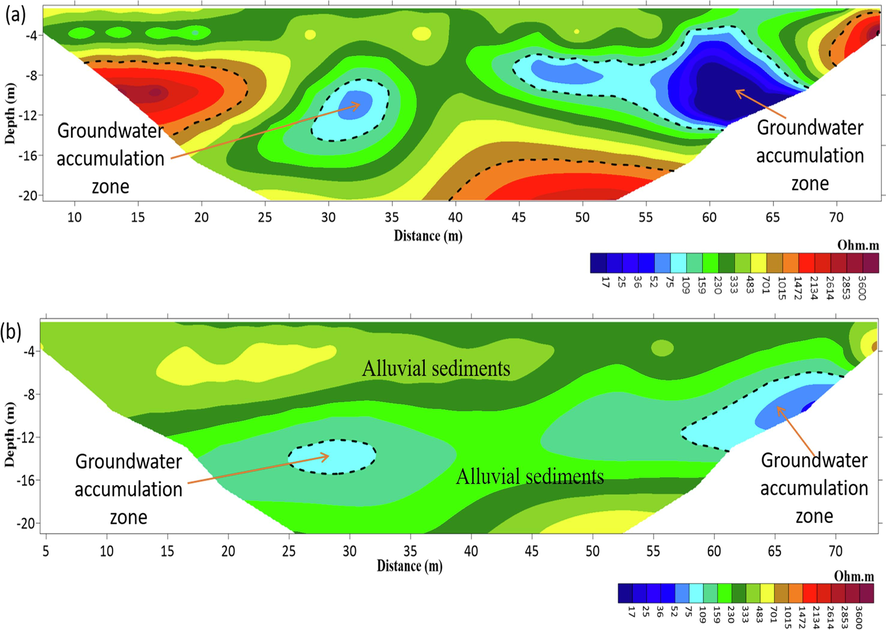
Inverted ERT 2D geoelectric cross-sections at Site −1.
The geoelectric 2D models for site-2, with resistivity ranging from 0 Ω·m to 3600 Ω·m, are depicted in Fig. 4. This section descends to a depth of 15 m. The upper section (a) reveals a pronounced and discernible groundwater-bearing zone, extending from the 15th to the 50th meter from the outset of the section. This aquifer, distinguished by low resistivity (less than100 Ω·m), pervades the entire profile, sustaining a depth of 15 m to the conclusion of the section. The lower segment (b) demonstrates analogous characteristics, with the groundwater aquifer situated within the alluvial deposits of the Wadi fill.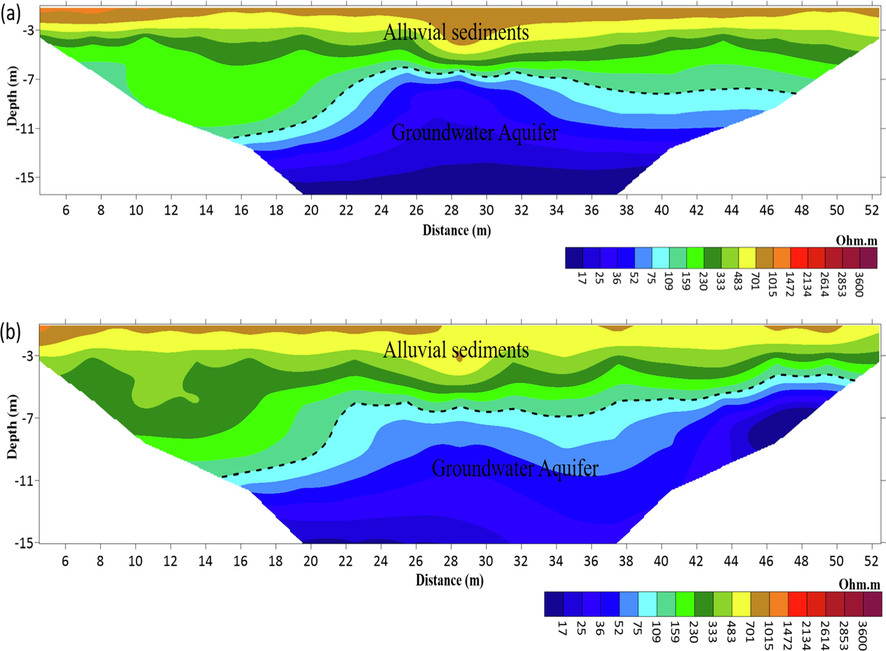
Inverted ERT 2D geoelectric cross-sections at Site −2.
The geoelectrical cross-sections at site-3 are shown in Fig. 5, substantiating a vast range of resistivities from 0 Ω·m to 3600 Ω·m and extending to a depth of 40 m. The groundwater-bearing zone, characterized by a shallow region of low resistivity (less than 100 Ω·m), is evident in the upper section (a). Positioned within alluvial deposits, this zone pervades the entire profile and descends to a depth of 25 m. Moreover, the basement rocks that are fractured and weathered are represented by a high resistivity zone (exceeding 1000 Ω·m) in the section’s lowest portion. Furthermore, the most inferior zone possesses exceedingly high resistivity (greater than 2500 Ω·m), indicative of massive or fresh basement rocks. These characteristics are similarly depicted in the lower section (b).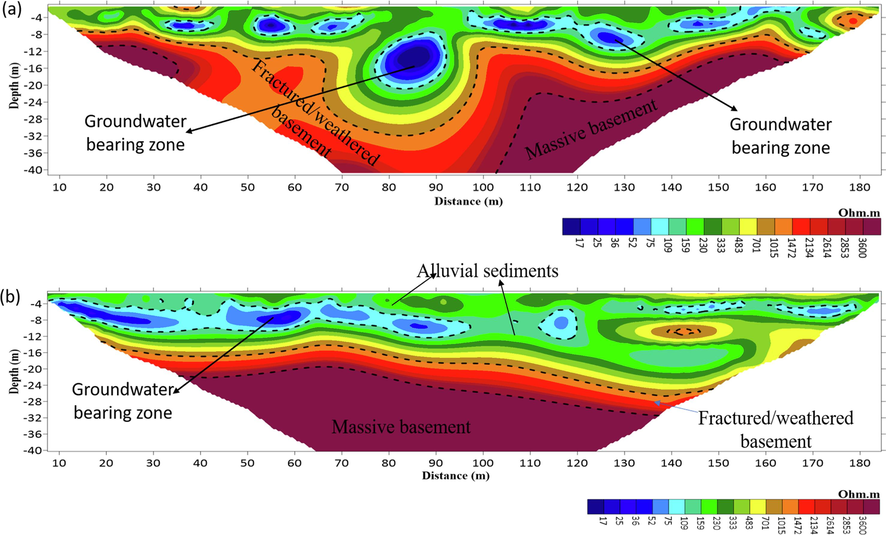
Inverted ERT 2D geoelectric cross-sections at Site −3.
Fig. 6 presents the geoelectric 2D models for site-4, wherein the resistivity spans from 0 Ω to 3600 Ω·m, across a depth of 20 m. The upper portion (a) unveils a distinct and well-defined groundwater-bearing zone, extending between 15 and 50 m from the section’s initiation point. This low resistivity area (100 Ω·m) traverses the entire profile and is constituted by the Wadi fill’s alluvial deposits, reaching a depth of 10 m. Subjacent to this zone, the basement rocks manifest high resistivity, suggesting fractured or weathered rocks, whereas the massive basement rocks near the terminating depth denote fresh basement rocks, as evidenced by their extremely high resistivity. The bottom section (b) illustrates these same attributes.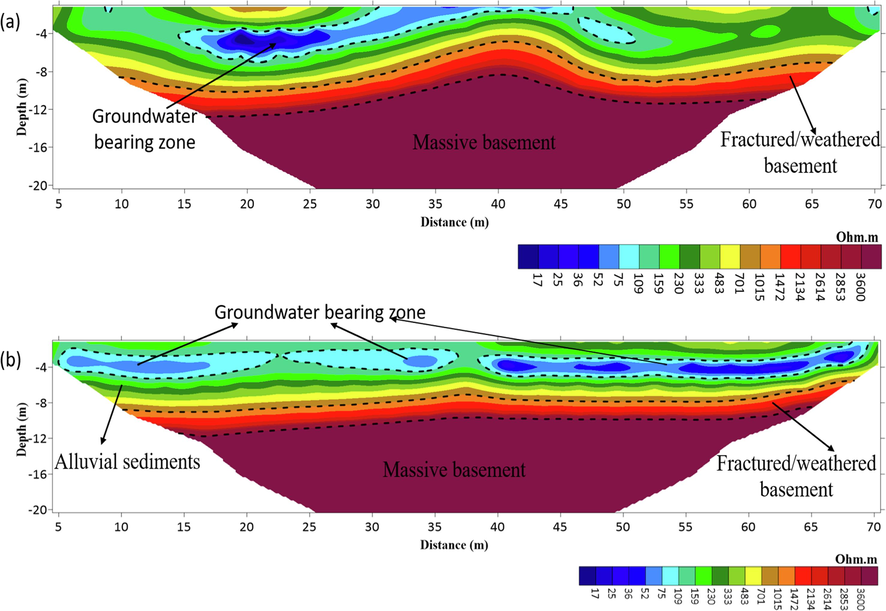
Inverted ERT 2D geoelectric cross-sections at Site −4.
For site-5, the geoelectric 2D models, with resistivity ranging from 0 Ω to 3600 Ω·m, are portrayed in Fig. 7, across a 20-meter depth. The upper model (a) reveals a distinct groundwater-bearing zone, extending between 15 and 50 m from the starting point of the section. This low resistivity zone (100 Ω·m), occupying the entire profile, is comprised of the alluvial deposits of Wadi fill and reaches a depth of 10 m. Positioned beneath this region lies a high resistivity zone, representing weathered or fractured basement rocks. These attributes are consistently represented in the lower part (b).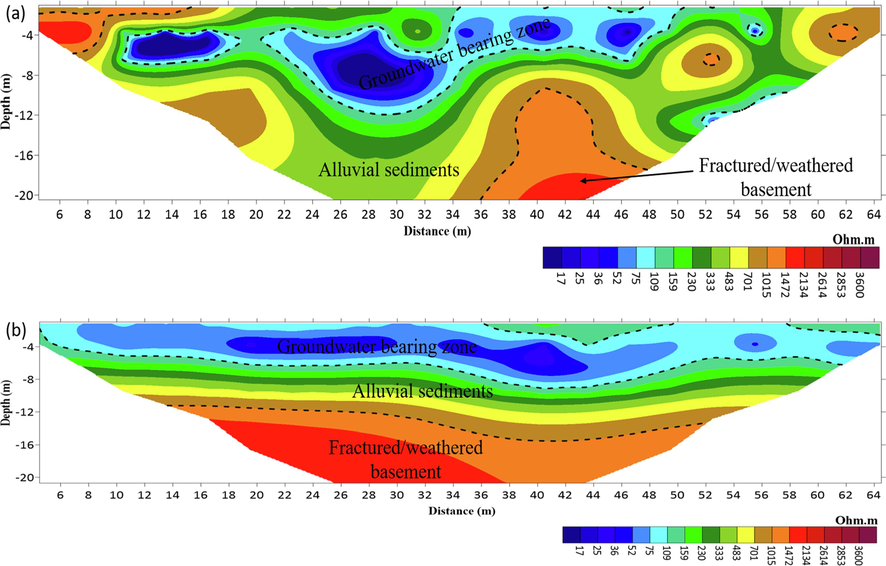
Inverted ERT 2D geoelectric cross-sections at Site −5.
5 Conclusions
The 2D geoelectric cross-sections at site 1 exhibit two distinct groundwater-bearing zones. The first zone, situated 13 m beneath the surface, runs horizontally from 28 m to 45 m from the profile’s commencement. The second zone’s depth varies between 4 and 13 m, commencing at the 45th meter and extending for over 40 m. In contrast, the bottom section reveals two areas of limited extension: the first one extends laterally from 25 m to 33 m and ranges from 12 m to 16 m in depth, whereas the second spans 55 m with a depth range of 5–15 m.
The upper geoelectric 2D model of site-2 exhibits a prominent and discernible groundwater-bearing zone, stretching between the 15th and 50th meters from the section’s initiation point and descending to a depth of 15 m. The bottom section illustrates these same characteristics.
Further emphasizing the wide resistivity range from 0 Ω·m to 3600 Ω·m, the geoelectrical cross-sections at site-3 display a groundwater-bearing zone in the upper section (a), characterized by a shallow area of low resistivity (less than100 Ω.m) that descends to a depth of 25 m. A high resistivity zone (greater than1000 Ω·m) in the lowest part of the section represents the weathered and/or fractured basement rocks, while the lowest zone, with its extremely high resistivity (greater than2500 Ω·m), indicates massive or fresh basement rocks. These attributes are consistently depicted in the bottom section (b).
In the geoelectric 2D models for site-4, the upper section reveals a groundwater-bearing zone extending between 15 and 50 m from the starting point of the section, reaching a depth of 10 m. The underlying basement rocks exhibit a high resistivity value. The geoelectric 2D models for site-5 reveal a groundwater-bearing zone, stretching between 15 and 50 m from the section’s beginning point, as evidenced in the upper model (a). This zone penetrates to a depth of 10 m, beneath which lies a high resistivity zone, representing weathered or fractured basement rocks.
Acknowledgments
Deep thanks and gratitude to the Researchers Supporting Project number (RSP2024R351), King Saud University, Riyadh, Saudi Arabia for funding this research article.
Declaration of Competing Interest
The authors declare that they have no known competing financial interests or personal relationships that could have appeared to influence the work reported in this paper.
References
- Alarifi S. S., Abdelrahman, K., Hazaea B. Y. 2022a. Depicting of groundwater potential in hard rocks of southwestern Saudi Arabia using the vertical electrical sounding approach. Journal of King Saud University – Science 34 (2022) 102221.
- Alarifi S. S., Abdelrahman, K., Hazaea B. Y. 2022b. Near-surface groundwater exploration using the geoelectrical resistivity method: A case study of Wadi Nisah, Riyadh, Saudi Arabia. Journal of King Saud University – Science 34, 102207.
- Integrated geophysical and hydrochemical investigations for seawater intrusion: a case study in southwestern Saudi Arabia. Arab. J. Geosci.. 2019;12:372.
- [CrossRef] [Google Scholar]
- Identification of groundwater potential zones in the Rabigh-Yanbu area on the western coast of Saudi Arabia using remote sensing (RS) and geographic information system (GIS) Front. Earth Sci.. 2023;11:1131200.
- [CrossRef] [Google Scholar]
- Geoelectric investigation of groundwater in Obaretin -Iyanomon locality, Edo state. Nigeria. J. G. Min. Res.. 2011;3(1):13-20.
- [Google Scholar]
- Hussain Alfaifi, Abdullah Al-Amri, Mohamed Fnais, Elkhedr Ibrahim, Abdelrahman, K., Mohammed Shehata and Faisal Zaidi (2017): Hydrochemical characteristics and evaluation of the granite aquifer in the Alwadeen area, southwest Saudi Arabia. Arab. J. Geosci.. 2017;10:139.
- [CrossRef] [Google Scholar]
- Groundwater Potentiality of Wadi Fatimah, Western Saudi Arabia: Geophysical and Remote Sensing Integrated Approach. Water. 2023;15:1828.
- [CrossRef] [Google Scholar]
- Integrated approach for the investigation of groundwater quality using hydrochemical and geostatistical analyses in Wadi Fatimah, western Saudi Arabia. Front. Earth Sci.. 2023;11:1166153.
- [CrossRef] [Google Scholar]
- Alshehri, F. and Abdelrahman, K. 2021. Groundwater resources exploration of Harrat Khaybar area, northwest Saudi Arabia, using electrical resistivity tomography. Journal of King Saud University – Science 33, 101468.
- Alshehri, F., Abdelrahman, K., Alyousef, R. 2022. An integrated approach for the identification of potential shallow groundwater zones in west-central Saudi Arabia. Journal of King Saud University – Science 34, 101915.
- Alzahrani, H., Abdelrahman, K., Hazaea, S. 2022. Use of geoelectrical resistivity method for detecting near-surface groundwater potential zones at Riyadh city, Saudi Arabia. Journal of King Saud University – Science 34, 102253.
- 2D Electrical Resistivity Tomography (ERT) Survey using the Multi-Electrode Gradient Array at the Bosumtwi Impact Crater, Ghana. J. Environ. Earth Sci.. 2013;3:5.
- [Google Scholar]
- Bernard, J., Orlando Leite, Fabrice Vermeersch 2006. Multi-electrode resistivity imaging for environmental and mining applications. http://www.iris-instrument.com.
- 2D resistivity surveying for environmental and engineering applications. First Break. 1996;14:275-283.
- [Google Scholar]
- A numerical comparison of 2D resistivity imaging with 10 electrode arrays. Geophys. Prospect.. 2004;52:379-398.
- [Google Scholar]
- Occam’s inversion generates smooth two-dimensional models from magnetotelluric data. Geophys. 1990;55:1613-1624.
- [Google Scholar]
- Introduction to Geophysical Prospecting. New York: McGraw-Hill; 1988. p. :867.
- Possibilities and limitations in applying geoelectrical methods to hydrogeological problems in the coastal areas of northwest Germany. Geophys. Prospect.. 1955;3:95-110.
- [Google Scholar]
- Flathe, H. 1970. Interpretation of geoelectrical resistivity measurements for solving hydrogeological problems. In: Morely, E. W. (Ed.), Mining and Groundwater Geophysics: Geological Survey of Canada Economic Geological Report no. 26: 580-597.
- Two-dimensional resistivity imaging and modeling in areas of complex geology. J. Appl. Geophys.. 1993;29(3–4):211-226.
- [Google Scholar]
- Jamman, A. M. 1978. Hydrogeology of Wadi Naman, Saudi Arabia. M.Sc. Thesis, 132 p. Faculty of Earth Sci., King Abdulaziz Uni., Jeddah.
- Physio-chemical properties of groundwater and their environmental hazardous impact: A case study of Southwestern Saudi Arabia. Journal of King Saud University – Science. 2021;33:101292.
- [Google Scholar]
- Electrical methods in geophysical prospecting. Oxford: Pergamon Press Inc.; 1996.
- Rapid least-squares inversion of apparent resistivity pseudo-sections by a quasi-Newton Method. Geophys. Prospect.. 1996;1996(44):131-152.
- [Google Scholar]
- A comparison of smooth and blocky inversion methods in 2-D electric imaging surveys. Explor. Geophys.. 2003;34:182-187.
- [Google Scholar]
- Loke, M.H. 2002. RES2DINV, Ver. 3.50, Rapid 2-D resistivity and IP inversion using the least square method.
- Ogilvy, A.A. 1970. Geophysical prospecting for groundwater in the Soviet Union, in Morely E. W., (Ed.), Mining and Groundwater Geophysics: Geological Survey of Canada Economic Geological Report no. 26:536-543.
- Correlation between electrical resistivity and soil-water content: Istanbul and Golcuk. Int. J. Phys. Sci.. 2009;4(6):362-365.
- [Google Scholar]
- Applications of electrical and electromagnetic methods for environmental and geotechnical investigations. Surv. Geophys.. 2002;23:101-132.
- [Google Scholar]
- An Introduction to Applied and Environmental Geophysics. New York: Wiley; 1997. p. :796.
- Robain, H., Braun, J.J., Albouy Y. and Ndam, J. 1995. An electrical monitoring of an elementary watershed in the rain forest of Cameroon, Proceedings of 1st Environmental and Engineering Geophysics Meeting, Torino, Italy, 411-414.
- Rubin, Y. and Hubbard, S.S., Eds. 2006. Hydrogeophysics, water science, and technology library, v. 50: Dordrecht, The Netherlands, Springer, p. 523.
- Two-dimensional joint inversion of magnetotelluric and dipole-dipole resistivity data. Geophysics. 1989;54:174-187.
- [Google Scholar]
- Resolution of resistivity tomography inferred from numerical simulation. Geophys. Prospect.. 1992;1992(40):453-464.
- [Google Scholar]
- Twodimensional DC resistivity inversion for dipole–dipole data. IEEE Trans. Geosci. Remote Sens.. 1984;GE-22:21-28.
- [Google Scholar]
- Electrical resistivity tomography to investigate geological structures of earth’s upper crust. Geophys. Prospect.. 2000;48:455-471.
- [Google Scholar]
- Sumner, J.S. 1976. Principles of Induced Polarization for Geophysical Exploration. Developments in Economic Geology 5. Elsevier Science Publishing Co.
- Ward, S.H. 1990. Resistivity and induced polarization methods. In: Ward, S.H. (Ed.), Geotechnical and Environmental Geophysics, vol 1: Review and Tutorial. Society of Exploration Geophysicists, Special Publication, 5, pp 147–189.
- Integrated resistivity surveys for delineation of fractures for groundwater exploration in hard rock area. J. Appl. Geophys.. 2007;62(3):301-312.
- [Google Scholar]
- Use of electrical resistivity tomography in delineating zones of groundwater potential in arid regions: a case study from Diriyah region of Saudi Arabia. Arab. J. Geosci.. 2012;2012(5):327-333.
- [CrossRef] [Google Scholar]
- Zohdy, A. A. R., Eaton, G.P., and Mabey, D.R. 1974. Application of surface geophysics to groundwater investigations: Techniques of water-resources investigations of the United States Geological Survey, Book 2, Chapter D1, pp: 116.
Appendix A
Supplementary data
Supplementary data to this article can be found online at https://doi.org/10.1016/j.jksus.2023.102928.
Appendix A
Supplementary data
The following are the Supplementary data to this article:


