

Translate this page into:
Groundwater aquifer detection using the time-domain electromagnetic method: A case study in Harrat Ithnayn, northwestern Saudi Arabia
⁎Corresponding author. falshehria@KSU.EDU.SA (Fahad Alshehri)
-
Received: ,
Accepted: ,
This article was originally published by Elsevier and was migrated to Scientific Scholar after the change of Publisher.
Peer review under responsibility of King Saud University.
Abstract
Eight time-domain electromagnetic profiles were carried out in Harrat Ithnayn, northwestern Saudi Arabia, to detect potential groundwater-bearing aquifers in the area. The collected data were processed and analyzed, with the results inferred or extrapolated between one-dimensional vertical soundings to obtain two-dimensional resistivity sections of the subsurface geological setting. We found that the resistivity values change laterally and vertically throughout the area. High resistivity values (greater than 100 Ohm-m) occupy most of the sections down to depths of approximately 100–150 m, whereas the low-resistivity regions of the section appear to be shallower than 100 m toward the west in the northern part of Harrat Ithnayn. The high-resistivity regions correspond to the Harrat basalts and are underlain by low resistivity (down to a few Ohm-m) in the saturated zones. There are also localized regions of low resistivity at depths of approximately 20–30 m, indicating shallow local groundwater aquifers. Aquifer thickness varies from approximately 50 to more than 100 m. In the southern part, the resistivity sections indicate that the main aquifer is at a depth of 150–200 m (possibly near 170 m) below the basalt. A saturated zone or shallow aquifer approximately 20–30 m thick also exists at a depth of approximately 15 m. In both the shallow and deep aquifers, the resistivity values indicate that there is good quality fresh water.
Keywords
Time-domain electromagnetic (TDEM)
Groundwater aquifers
Harrat Ithnayn
Saudi Arabia

1 Introduction
Many geophysical techniques have been used for groundwater characterization, but the greatest success has been shown with electrical and electromagnetic methods (Eke and Igboekwe, 2011). Electromagnetic (EM) methods are widely used for groundwater exploration. These methods are either used exclusively or used in combination with the electrical resistivity tomography method (Omosuyi et al., 2007; Buselli and Lu, 2001; Olorunfemi et al., 1996). Even though varying degrees of success have been achieved using the EM method, data interpretation remains a problem. Detailed interpretations of geophysical data are useful for the effective delineation of groundwater-bearing zones or features. Meulenbeld and Hattingh (1999) and Aked (1995) emphasized the careful interpretation of geophysical data as a useful tool to delineate water-bearing features.
The time-domain electromagnetic (TDEM) measurements are conducted using ungrounded square or circular loops lying on the ground surface. In this configuration, short direct current pulses are introduced by the transmitter loop, which is turned off after a specified time-on period (Hoekstra and Blohm, 1990). The time it takes for the current to return to zero after being turned off primarily depends on the loop size (Pellerin et al., 1994). The depth of investigation is directly proportional to the shut-off time, the recording time interval, and the loop size (Spies, 1989). When the transmitter loop is turned off, the primary field rapidly decays, eddy currents are generated in the conductive material below the loop, and the decaying currents induce a new EM field (a secondary EM field), which causes a new current at even greater depths.
In areas where groundwater occurrences are structurally controlled, it is suitable to use a method that is sensitive to fractures. Widely used, EM methods have been considered suitable for detecting and delineating fracture zones. According to McNeill and Snelgrove (1986), TDEM systems were originally developed for mineral exploration and were later discovered to be apt for detecting and measuring small conductivity changes caused by the presence and quality of groundwater (Farag et al., 2019). These systems have also been used to detect geological structures favorable for groundwater, such as faults and fracture zones. Interpretation techniques take advantage of the sensitivity of the TDEM equipment to detect fractures for the delineation of geological features or water-bearing zones (McNeill and Snelgrove, 1995) and consider the geology of the area and other hydrogeological factors. Often, significant geologic features may be entirely overlooked as a result of an inability to recognize simple data patterns. Recognizing and carefully interpreting fractures or fracture systems in geophysical data can have a significant positive impact on borehole drilling results.
In EM surveys, the total sum of the fields is measured (Oghenekohwo, 2008). According to Maxwell’s equations, the observed difference between the transmitted (primary) EM field and the received (secondary) EM field provides information concerning the nature and electrical properties of the subsurface conductive body. EM techniques have been widely used for groundwater exploration (Edet, 1990; McNeill, 1990; Olayinka, 1990; Bayor, 2004; Chegbeleh et al., 2009; Jika and Mamah, 2014; Al-Amoush et al., 2015; Seidu et al., 2019).
In Saudi Arabia, volcanic fields, known in Arabic as harrat, were deposited during the Cenozoic Era as a consequence of the rifting and drifting of the Arabian Plate away from the African Plate, which led to the formation of the Red Sea and a volcanically active passive continental margin on western Arabia (Fig. 1). This volcanic activity spanned a large period of time from the Oligocene (30 Ma) to historical times. The volcanic fields extend from their northern border with the Levant to their southern border with Yemen. There are 13 distinct volcanic fields in western Saudi Arabia. Fortunately, most of the volcanoes are extinct, very few erupted more than 1000 years ago, and only one erupted as recently as 1256 CE.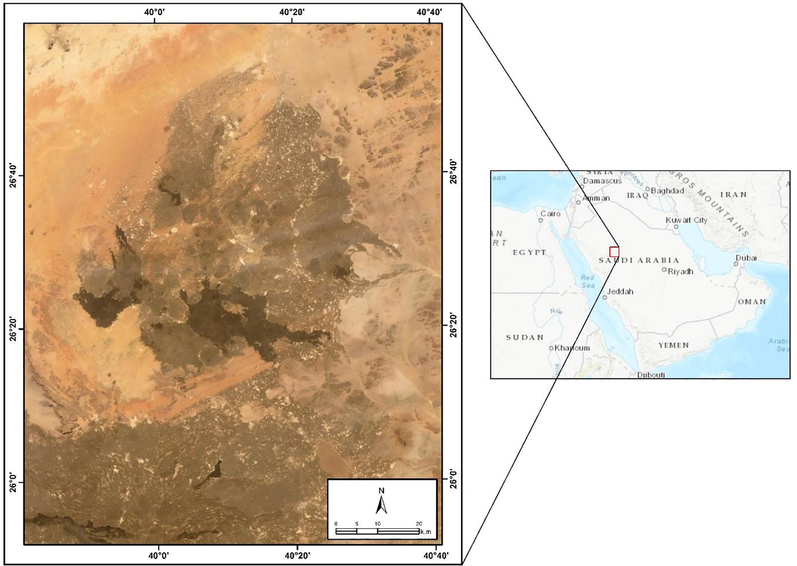
Location map of Harrat Harrat Ithnayn investigated area.
The Harrat Ithnayn volcano is a volcanic field located in northwestern Saudi Arabia north of the Harrat Khaybar volcanic field and has a size of 4000 km2 (Fig. 1). The inhabitants of the scattered and remote communities in Harrat Ithnayn require a sustainable source of potable water for drinking and domestic usage. Accordingly, this study was organized to detect subsurface groundwater aquifers via the creation of a two-dimensional hydrogeophysical model along the study area with a lateral and vertical extension through the Harrat Ithnayn area.
2 Geological and hydrological setting
Harrat Ithnayn is the northernmost volcanic field in the Mecca–Medina–Nafud (MMN) volcanic line and the least studied. Harrat Ithnayn represents the most recent episode of the northern progression of volcanism along the MMN line (Fig. 1). Volcanism started in Harrat Rahat (>10 Ma), then moved to Harrat Khaybar (>6 Ma), and finally began at Harrat Ithnayn (>2 Ma) (Camp and Roobol, 1991; Camp and Roobol, 1992; Shaw et al., 2004, Alhejji, 2019). The lava fields of the Harrat Ithnayn volcanic field cover an area of approximately 4000 km2 with an average thickness of approximately 50 m (Roobol and Camp, 1991a). The Harrat Ithnayn volcano consists of various shield volcanoes and scoria cones and contains large basaltic flows with lava caves. The youngest lava flows from Harrat Ithnayn are less than 4500 years old. The Harrat Ithnayn volcanic field started to erupt approximately 3 Ma, and it overlies Cambrian sandstones and Precambrian basement rocks (Coleman et al., 1983; Camp et al., 1991). Compositionally, this phase generated transitional to strongly alkali basaltic rocks (Camp and Roobol, 1992; Konrad et al., 2016; Abdelmalik, 2020; Abdelmalik and Abd-Allah, 2018). Camp and Roobol (1992) attributed the younger volcanism in western Arabia (Fig. 2).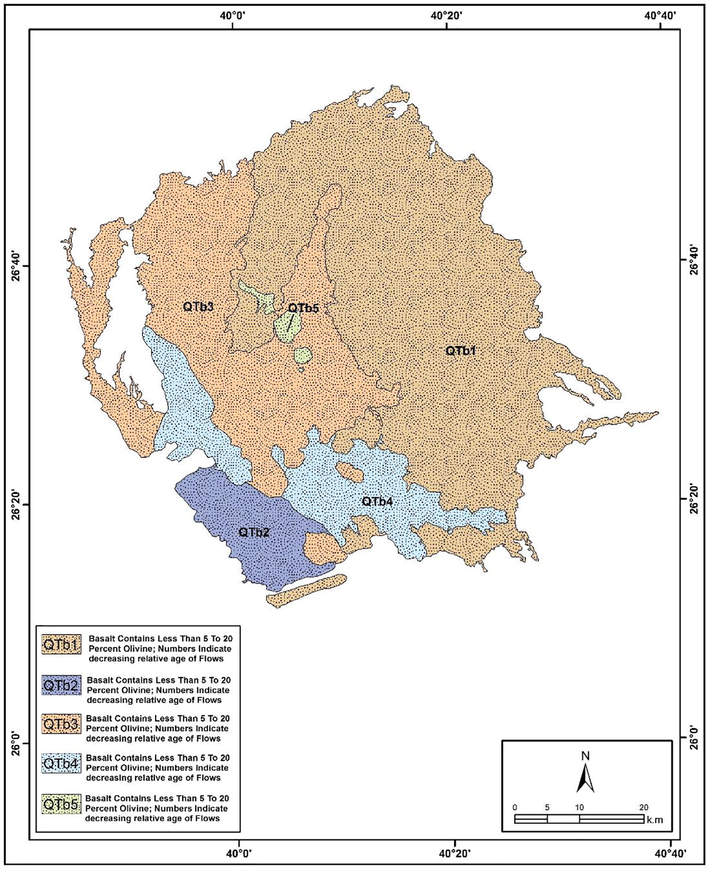
Geological setting of the study area.
Volcanic vents are roughly aligned in the north–south direction. The magmas of Harrat Ithnayn are of basaltic and basanitic composition and lack the silicic components present in neighboring Harrat Khaybar. Ithnayn is one of three coalesced basaltic lava fields, namely, harrats Khaybar, Ithnayn, and Kura, which constitute the largest contiguous area of Cenozoic basalt in Saudi Arabia, similar in extent (20,564 km2) and volume (1850 km3) to Harrat Rahat, which is situated only 25 km to the south (Camp et al., 1991). Various lava caves exist across the Arabian basaltic volcanic fields. One of the best known in the Harrat Ithnayn volcanic field is the 530-m-long Kahf Al Shuwamis lava tube, located at the base of the Hazim Al Khadra volcano, 240 km north–northeast of Medina.
Hydrogeologically, Harrat Ithnayn is located in the Rumah Basin which is the largest drainage basin of north-central Saudi area with approximately 71.000 Km2 (Person-Basil, 1968). Its catchment area lies west of the Arabian Shield or the basement complex. The wadi probably was a perennial stream during the pluvial period, sometime in the Late Pleistocene. Due to the presence of mobile sands and the reduced volume and frequency of its flow, the wadi now terminates about 50 km and flow may still occur any time from October to May (Sowayan and Allayla, 1989). For a 10-year record at a station located about 50 km east of Harrat Ithnayn investigated area, the maximum volume of flow in one year was found to be 32.5×10⁶ m3 (Ministry of Agriculture and Water, 1969). Winter rainfall over the study area ranges between 9.1 and 15.53 mm, spring rainfall varies from 10.62 to 24.75 mm, summer rainfall varies from 0 to 1.5 mm, and autumn rainfall varies from 8.98 to 37.39 mm. The water table depths in the study area vary from 3.9 to 207 m, with an average depth of 31.96 m.
3 Electromagnetic data collection
The electromagnetic method has been developed in the early eighties for studying deep structures. Since the 1985s, the development of new instrumentation and interpretation methods has further refined the TEM method and allowed its application in geological, hydrogeological, engineering and environmental studies, and today it represents a potentially promising method for investigating electrical parameters of the subsurface medium. TEM technique produces 1-D and 2-D geo-electrical cross-sections in a similar manner to electrical cross-sections with a depth of investigation ranging from few to hundreds of meters with high vertical and lateral resolution. TDEM field measurements were conducted during November – December in 2020 at eight selected sites distributed in the Harrat Ithnayn area (Fig. 3). These data were acquired using a Zonge GDP32 instrument, with a transmitter loop size of 50 m and a receiver loop size of 10 m. This enabled the electrical resistivity section to be determined down to a maximum depth of approximately 250–300 m below the surface, depending on the shallow resistivity conditions. The stacking time was set to approximately 5 min with a 50-Hz noise filter to avoid aliasing effects of any possible galvanic interference. The length of all TDEM lines was 800 m, except line No. 6, which extended 600 m. Optimal site selection was adopted such that the spatial distribution of the TDEM data sampled most of the study area and nearby locations.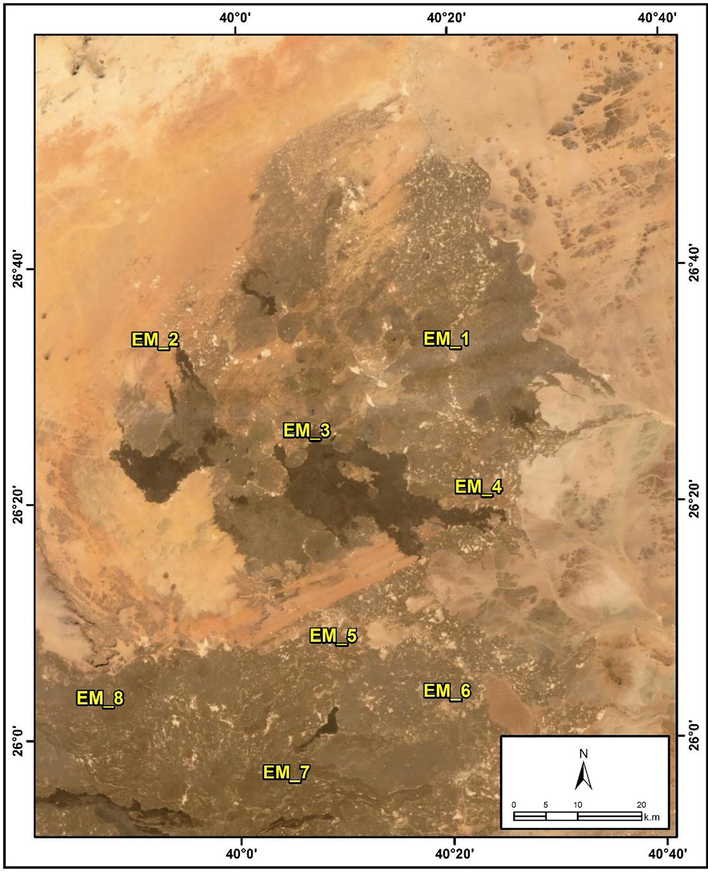
Location of TDEM profiles in Harrat Ithnayn.
4 Results and analysis
The TDEM data were processed using the TEMRESEARCHER (TEM-Researcher Software, 2007) software, which enables the generation of pseudo- and inverse resistivity sections from one-dimensional sounding resistivity. Then, the one-dimensional sections were inferred or extrapolated to obtain two-dimensional subsurface resistivity sections.
Resistivity section at EM-2 site (Fig. 4) illustrates structural variation in its upper 200 m. This section indicates that high resistivity values (greater than 100 Ohm-m) occupy most of the section down to depths of approximately 100–150 m, even though this is slightly variable along the profile, and the lower resistivity part of the section appears to be shallower than 100 m toward the west. The high-resistivity regions likely correspond to the Harrat basalts and, along most of the profile, are underlain by lower resistivity values (blue areas down to a few Ohm-m) as a result of saturated zones. There are also two lower resistivity regions at stations with distances of 60 and 240 m that may indicate local shallow aquifers at a depth of approximately 20 m, even though the precise lateral extent of these regions cannot be determined from these data. The lower limits of the deeper aquifers are not well defined in some places but appear to be quite variable, with an aquifer thickness possibly exceeding 100 m near the center of the profile. Given that the resistivity values in the section are not exceptionally low, it is possible that the water is fairly fresh.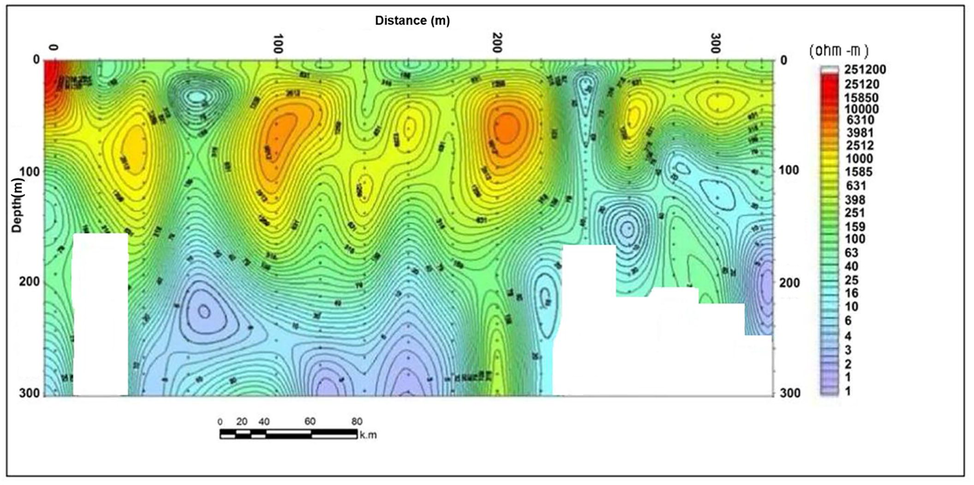
Two-dimensional TDEM resistivity subsurface section at EM-2 site of surveying profile.
The EM-4 profile (Fig. 5) illustrates low-resistivity zone (less than 100 O-m) extends till a depth of approximately 30 m that may represent a moist zone. This zone underlain by very high resistivity zone (1000–8000 Ohm-m) extends down to 120 (in the eastern side) and 150 m at the middle of the profile indicating basaltic sequence of this zone. The lower part of this profile presents a low resistivity zone (less than 100 O-m) appears at the southwestern zone of this profile. This zone represents the groundwater bearing zone that extends till the end of the profile. The western part of Harrat Ithnayn appears to have shallower aquifers than the eastern part, and drilling to depths of approximately 150 m should enable the saturated zones shown in the diagrams to be tested.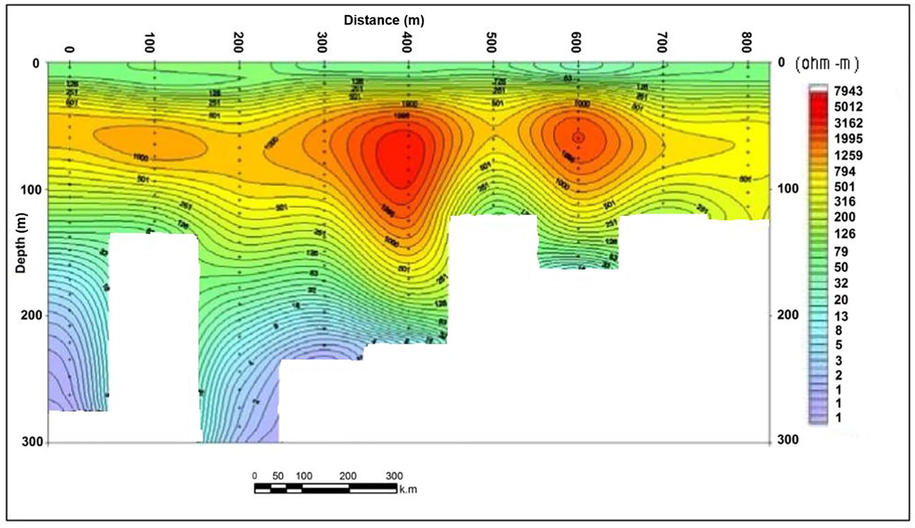
Two-dimensional TDEM resistivity subsurface section at EM-4 site of surveying profile.
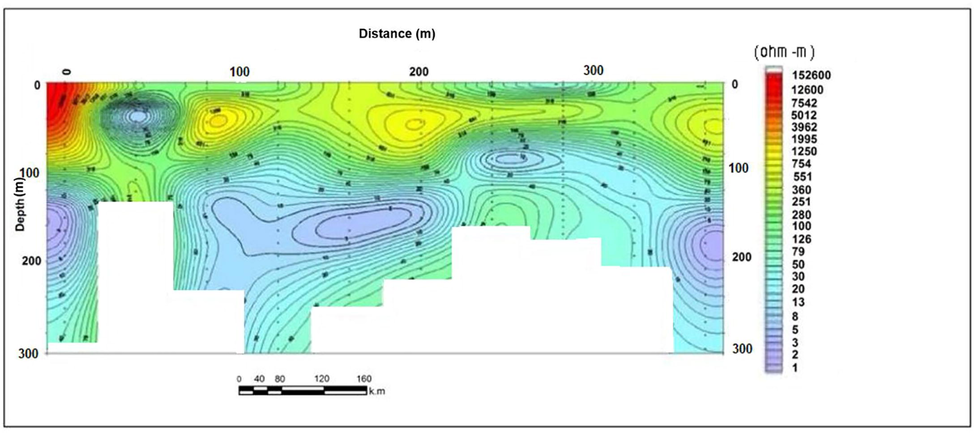
The resistivity section underlying EM-6 profile (Fig. 6) indicates that the upper surface of the saturated zone is at a depth of approximately 150–200 m. The lower limits of the zone are not defined, but the water may be reasonably fresh. In addition, the resistivity section along profile EM-8 (Fig. 7) suggests that the main aquifer is at a depth of 150–200 m (possibly near 170 m) below the basalt, even though the upper surface of the saturated zone cannot be located precisely from this section. The saturated zone appears to be slightly shallower at the most southerly data point. A saturated zone or shallow aquifer approximately 20–30 m thick also exists at a depth of approximately 15 m across most of the section and is best defined at stations 100, 200, and 300. In both the shallow and deep aquifers, the resistivity values indicate that there is brackish groundwater (Bauer et al., 2006; Nowroozi et al., 1999).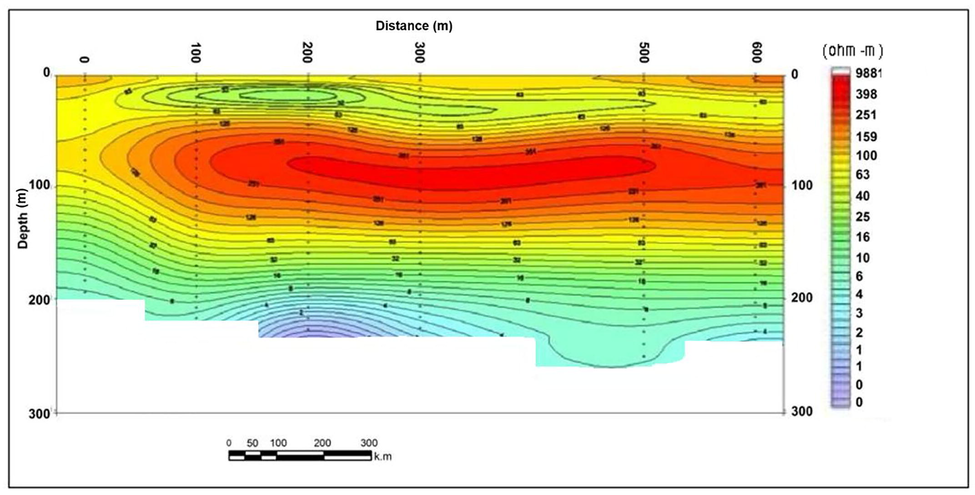
Two-dimensional TDEM resistivity subsurface section at EM-6 site of surveying profile.
Two-dimensional TDEM resistivity subsurface section at EM-8 site of surveying profile.
5 Conclusions
Eight TDEM profiles were conducted at Harrat Ithnayn, where they were distributed over the entire study area. The results from EM indicated that there are distinct lateral/vertical changes in the resistivity values which inferred as a variation in the subsurface structure. Basaltic rocks appear at different depths and with different extensions; this, in turn, is accompanied by obvious changes in the depths of the water-bearing zones in the region. Moreover, the depth of the water-bearing zones differs in the northern part of the region from that in the south as it is less than 100 m in the north but extends from 100 to 150 m in the south. There are also water-saturated areas at shallow depths of 15–20 m in the northern part of the region, as well as at a depth of 15 m in the south. There exists a saturated zone or shallow aquifer that is approximately 20–30 m thick.
On the basis of the electrical resistivity values, it is likely that the groundwater in the study area is fresh. Therefore, drilling of groundwater wells in the areas identified in this study is recommended to provide the water needed for drinking, household purposes, and other activities for the residents of the urban communities spread throughout the study area.
Acknowledgements
The authors extend their appreciation to Researchers Supporting Project number (RSP-2021/327), King Saud University, Riyadh, Saudi Arabia
Declaration of Competing Interest
The authors declare that they have no known competing financial interests or personal relationships that could have appeared to influence the work reported in this paper.
References
- Landsat 8: Utilizing Sensitive Response Bands Concept for Image Processing and Mapping of Basalts. Egyptian Journal of Remote Sensing and Space Science.. 2020;23(3):263-274.
- [CrossRef] [Google Scholar]
- Integration of remote sensing technique and field data in geologic mapping of an ophiolitic suture zone in western Arabian Shield. Journal of African Earth Sciences. 2018;146:180-190.
- [CrossRef] [Google Scholar]
- Aked, L.G. 1995. Divining Power, a New Technique for Water Divining is Cost Effective and Finds More Water at Less Depth. L.G. Aked Investigates. African Review of Business and Technology.
- Geophysical Investigation Using Time Domain Electromagnetic Method (TDEM) at Wadi Deir Al-Kahaf Area/Jordan for Groundwater Artificial Recharge Purposes. Journal of Water Resource and Protection. 2015;7(3):143-151.
- [CrossRef] [Google Scholar]
- Timing and Composition of Volcanism at Harrat Ithnayn, Western Saudi Arabia. Oregon State University; 2019. p. :82p. Masters Thesis
- Bayor, J. S. (2004). Application of the Electromagnetic and the Electrical Resistivity Methods in Groundwater Exploration in the Tolon-Kumbungu District of the Northern Region of Ghana.
- (2006) Geoelectrical imaging of groundwater salinization in the Okavango Delta. Botswana. Journal of Applied Geophysics. 2006;60(2):126-141.
- [Google Scholar]
- Groundwater Contamination Monitoring with Multichannel Electrical and Electromagnetic Methods. Journal of Applied Geophysics. 2001;48(1):11-23.
- [Google Scholar]
- Camp, V. E., Roobol, M. J., and Saudi Arabia, Mudīrīyah al-ʻĀmmah lil-Tharwah al-Maʻdinīyah. (1991). Geologic map of the Cenozoic lava field of Harrats Khaybar, Ithnayn, and Kura, Kingdom of Saudi Arabia. Jiddah, Saudi Arabia]: Ministry of Petroleum and Mineral Resources, Directorate General of Mineral Resources.
- The Arabia Continental Alkali Basalt Province: Part II. Evolution of Harrats Khaybar, Ithnayn, and Kura, Kingdom of Saudi Arabia. Geological Society of America Bulletin. 1991;103(3):363-391.
- [Google Scholar]
- Upwelling Asthenosphere Beneath Western Arabia and its Regional Implications. Journal of Geophysical Research. 1992;97(B11):15255-15271.
- [Google Scholar]
- Electromagnetic Geophysical Survey for Groundwater Exploration in the Voltaian of Northern Ghana. Journal of Environmental Hydrology. 2009;17 Paper 9
- [Google Scholar]
- Coleman, R. G., Gregory, R. T., and Brown, G. F. (1983). Cenozoic Volcanic Rocks of Saudi Arabia: Saudi Arabian Deputy Ministry for Mineral Resources Open-File Report USGS-OF-03-93, 82.
- Application of Photo-Geologic and Electromagnetic Techniques to Groundwater Exploration in North-Western Nigeria. Journal of African Earth Sciences. 1990;11(3-4):321-328.
- [Google Scholar]
- Geoelectrical Investigation of Groundwater in Some Villages in Ohafia Locality, Abia State, Nigeria. British Journal of Applied Science and Technology. 2011;1(4):190-203.
- [Google Scholar]
- Farag K. S. I., Howari F. M., Abdelmalik K. W., (2019). Imaging of Hydrothermal Altered Zones in Wadi Al-Bana, in Southern Yemen, Using Very Low Frequency–Electromagnetic and Remote Sensing Data. Arabian Journal of Geosciences. 2019, 12(18), 554. https://doi.org/10.1007/s12517-019-4702-8.
- Asthenosphere-Lithosphere Interactions in Western Saudi Arabia: Inferences from 3 He/4 He in Xenoliths and Lava Flows from Harrat Hutaymah. Lithos. 2016;248-251:339-352.
- [Google Scholar]
- Summary of Climatological Data. Riyadh, Saudi Arabia: Open-files; 1969.
- Electromagnetic Geophysical Method Applied to Ground Water Exploration and Evaluation. Developing World Water; 1986.
- Use of Electromagnetic Methods for Groundwater Studies. In: Ward S.H., ed. Geotechnical and Environmental Geophysics 01. Tulsa: Society of Exploration Geophysicists; 1990. p. :191-218.
- [Google Scholar]
- Electromagnetic Geophysical Methods Applied to Groundwater Exploration and Evaluation. Geonics Limited; 1995.
- Nowroozi A. A., Horrocks S. B., and Henderson P. (1999). Saltwater intrusion into the freshwater aquifer in the eastern shore of Virginia: a reconnaissance electrical resistivity survey. Journal of Applied Geophysics, vol. 42, no. 1, pp. 1–22, 1999.
- Case histories of time-domain electromagnetic soundings in environmental geophysics. In Geotechnical an Environmental Geophysics 1990
- [Google Scholar]
- Application Of Electromagnetic Method And Electrical Resistivity Sounding In Hydrogeological Studies, A Case Study Of Vandeikya Area, Central Nigeria. International Journal of Scientific and Technology Research. 2014;3(2)
- [Google Scholar]
- A Comparison of Resistivity and Electromagnetic as Geophysical Techniques. Diploma Thesis Report, African Institute of Mathematical sciences AIMS, University of Cape Town, South. Africa. 2008;27
- [Google Scholar]
- Olorunfemi, M. O., Dan-Hassan, M. A., and Ojo, J. S. (1996). On the Scope and Limitations of the Electromagnetic Method in a Precambrian Basement Terrain – a Nigerian Case Study. International Journal of Rock Mechanics and Mining Sciences and Geomechanics Abstracts, Vol. 33(5), 216A-216A.
- Electromagnetic Profiling for Groundwater in Precambrian Basement Complex Areas of Nigeria. Hydrology Research. 1990;21(3):205-216.
- [Google Scholar]
- Investigation of Groundwater Prospect Using Electromagnetic and Geoelectric Sounding at Afunbiowo, near Akure, Southwestern Nigeria. The Pacific Journal of Science and Technology. 2007;8(2):172-182.
- [Google Scholar]
- VETEM-A Very Early Time Electromagnetic System. In: Proceedings of the Symposium on the Application of Geophysics to Engineering and Environmental Problems. Boston: SAGEEP; 1994. p. :795-802.
- [Google Scholar]
- Person-Basil, Consultants (1968): Agricultural and water resources: the great Nafud sedimentary basin, Unpublished report represented to the Ministry of Agriculture and water, Riyadh, Saudi Arabia.
- Roobol, M. J., and Camp, V. E. (1991a). Geology of the Cenozoic lava field of Harrats Khaybar, Ithnayn, and Kura, Geosci. Map GM-131, 1:250,000 scale, with text, 76 pp., Saudi Arabian Dir. Gen of Miner. Resour., Jiddah, 1991a
- Combined Electrical Resistivity Imaging and Electromagnetic Survey for Groundwater Studies in the Tarkwa Mining Area. Ghana. Ghana Mining Journal. 2019;19(1):29-41.
- [Google Scholar]
- Petrogenesis of the Largest Intraplate Volcanic Field on the Arabian Plate (Jordan): A Mixed Lithosphere-Asthenosphere Source Activated by Lithospheric Extension. Journal of Petrology. 2004;44(9):1657-1679.
- [Google Scholar]
- Sowayan, A.M. and Allayla, R. (1989): Origin of Saline ground water in Wadi Ar-Rumah, Saudi Arabia. Groundwater, Vol. 27, No.4, July-August, 481-490.
- Depth of Investigation in Electromagnetic Sounding Methods. Geophysics. 1989;54(7):872-888.
- [CrossRef] [Google Scholar]
- TEM-Researcher Software. (2007). Applied Electromagnetic Research (AEMR), Netherlands.
Appendix A
Supplementary data
Supplementary data to this article can be found online at https://doi.org/10.1016/j.jksus.2021.101684.
Appendix A
Supplementary data
The following are the Supplementary data to this article:


