

Translate this page into:
Geotechnical assessment of near-surface sediments and their hazardous impact: Case study of Jizan city, southwestern Saudi Arabia
-
Received: ,
Accepted: ,
This article was originally published by Elsevier and was migrated to Scientific Scholar after the change of Publisher.
Peer review under responsibility of King Saud University.
Abstract
Abstract
The geotechnical parameters of near-surface sediments in Jizan city have been assessed through shear wave velocity (Vs) from twenty-two profiles of multi-channel analysis of surface waves (MASW) through Jizan city. The Vs varies between 106 and 560 m/s indicating wide range of soil stiffness properties. While the allowable bearing capacity, qa varies from less than 1 kg/cm2 at sites till depth 21 m indicating very soft/loose materials; these are considered by building codes as special cases and increased into 2.5 kg/cm2 suggesting stiff or medium dense materials Moreover, qa reaches 6.5 kg/cm2 indicating dense materials, while reaches 8.5 kg/cm2 suggesting the presence of very dense materials. Accordingly, the allowable bearing capacity at a depth of 13 m is less than the recommended values for foundation materials by building codes. Jizan city differentiated into two zones; Jizan salt dome to the west and sabkha deposits to the east. Several weakness zones in the Jizan salt dome zone have been detected with significant variations in the topography of salt rock. While sabkha deposits have low shear strength which requires engineering treatment before construction. Furthermore, shear modulus varies both vertically and laterally through Jizan city where values of shear strength of the near-surface sediments overlying salt rocks are greater than those of sabkha zone. Therefore, deep foundation and ground improvement are highly recommended.
Keywords
MASW technique
Shear-wave velocity
Sabkha sediment
Jizan salt dome
Saudi Arabia

1 Introduction
Site soil settings have a vital role in the design ground motions of the building design codes. Over the past 40 years, soil site conditions have been subjected to detailed and extensive evaluations. The recent stipulations of building design codes are based on laborious and costly field geotechnical and geophysical measurements of soil site characterizations. Therefore, site-specific seismic zonation has been recognized as the most appropriate and economical solution for site categorization.
Although most established editions of international and US codes assign a single site coefficient to each site class, lately, soil site provisions have been subjected to significant evaluation, not only on site class description but also on the associated coefficients. MASW method is considered as one of powerful techniques for the estimation of Vs and has been effectively applied in assessing the geotechnical parameters of near-surface deposits (Anbazhagan et al. 2013). Soil site classes have been proposed by Borcherdt et al. (1994) with more detailed geotechnical characterizations, have been incorporated into National Earthquake Hazards Reduction Program (NEHRP) provisions since 1994.
This study oriented for assessing the geotechnical parameters of the near-surface deposits in Jizan city (Fig. 1), comprising of systematic geotechnical and geophysical field data measurements through identification of soil profiles and assessment the dynamic soil properties based on Vs profiles reaching depths 50 m below the ground level as well as borehole geotechnical data from several test sites across the city. The Vs was measured at 22 sites, while soil profile was assigned by the local geotechnical soil test authorities according to American Society for Testing and Material (1992).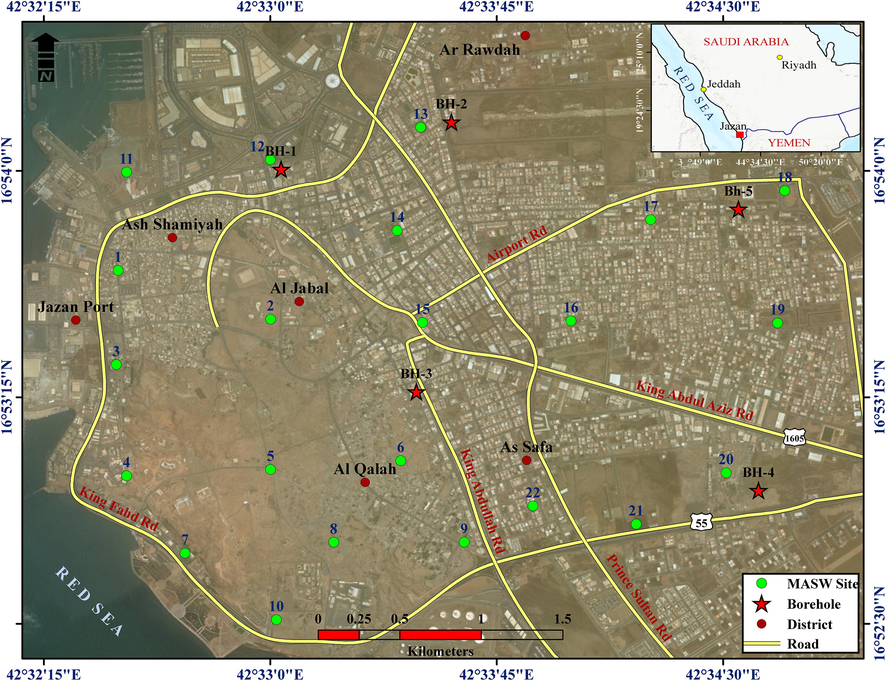
Location map of Jizan study area as well as the locations of MASW sites.
2 Geological setting of the study area
Jizan area covered by alluvial deposits of Red Sea coast. Different tectonic movements have been documented wherever the Tertiary deposits crop out along a narrow coastal plain with a width of 5–10 km. The extension of these deposits with 2–5 km showing substantial facies differences. Extensive subsidence took place between the end of the Oligocene and the end of the lower Miocene. It was associated by some tectonic readjustment led to upward salt diapiring during the Upper Pliocene and Pleistocene. The plain is restricted eastward by the Arabian Shield escarpment and westward by the sharp break-in slope at the edge of the Red Sea trough. In Jizan area, the coastal plain is entirely flat other than the Jizan salt dome, which rises 50 m (amsl). The geologic setting of Jizan is the product of the three major periods encompassing late Proterozoic rocks of the Arabian Shield, remnants of sedimentary rocks deposited on the Shield between the Cambrian and early Tertiary times, and igneous and sedimentary rocks deposited in the Red Sea basin between the middle Tertiary and the present (Blank et al., 1986). The Arabian Shield rocks consist of the late Proterozoic quartz-rich schists that were heavily foliated to gneissic granite. Deposition of the Cambrian to lower Tertiary rocks was controlled by fluctuations in the positions of the shorelines of the surrounding marine basins (Fig. 2).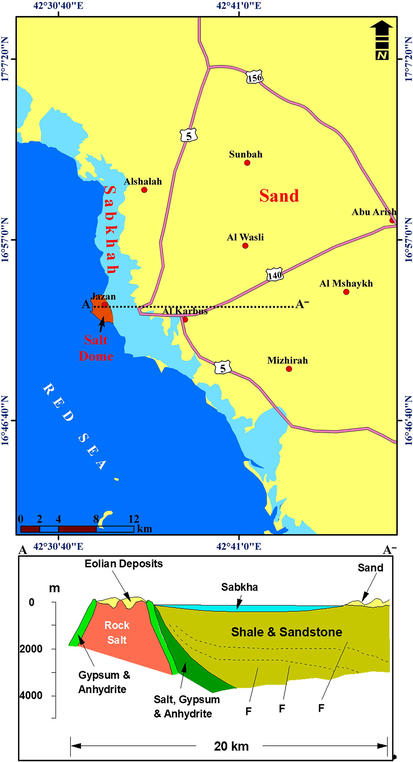
Surface geologic setting of the Jizan area (modified after Blank et al., 1986) where the geologic cross-section is drawn on the map.
In traversing from west to east, the following units were encountered: the sabkha unit (200–300 m), wide zone of Quaternary alluvial deposits (30–35 km), Quaternary basalts, followed by narrow zone of Tertiary igneous rocks with Ordovocian sandstones exposed by faulting. Farther east, the Precambrian basement complex forms the elevated mountains. Rock salt and associated cap rocks, consisting mostly of gypsum, have diapirically moved upward. While the cap rocks are extremely faulted and disturbed, the succession at the salt dome is as follows: massive halite with thin anhydrite reaching about 1500 m thickness and 50 m of fine silty sandstone and shale rich in organic matter. The bottom of the salt dome is estimated to reach approximately 5000 m below sea level. When erosional processes subsequently remove the salt dome surfaces, most of the overlying country and cap rocks.
Alluvial terrace deposits constitute about 40% of the Quaternary deposits. They are primarily composed of sand and gravel, with lesser amounts of cobbles and finer silts. Large elongated bodies of sabkha deposits occur along the Red sea coast; alluvium or eolian sands dissect these. This is believed to be the result of tidal flats, where layers of saline mud are interlarded with saline sands, with an estimated thickness of approximately 5–6 m. Alluvial deposits permeate all the major streams, ranging in thickness from a few meters upstream to more than 100 m near the sea. They also permeate the flood plain and terrace deposits. These deposits consist of gravel, sand, silts, and clay. Locally, the silts and associated fine sediments are gypsiferous.
The deepest boring within the sabkha was at a depth of 25 m, which did not reach the underlying bedrock. The sabkha sediment profile consists of three main units where the depth to the groundwater table is at 1 m or less. The estimated thickness of the topmost layer ranges from 1 to 2 m and consists of silty sand and/or fine sand with silt and gravel, with SPT-N values from 4 to 30. The 2nd layer composed from non-plastic fine sands to silt and clay with very low SPT-N values (1–4) with 8 to 12 m thickness. The 3rd layer is consolidated to very consolidated sand (Al-Farraj, 2008).
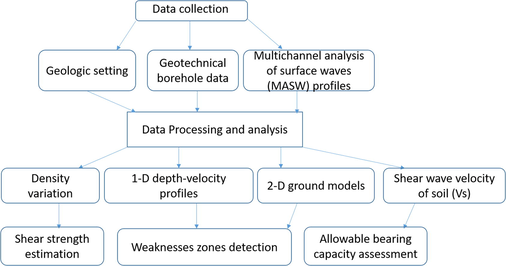
3 Methodology
Shear wave velocity for 30 m (Vs30) was calculated using the MASW procedure, by recording and analyzing using dispersion parameters approach (Nazarian and Stokoe, 1984; Stokoe et al., 1994; Park et al., 1999). Density is an essential parameter that is often assumed from soil properties for estimating the shear modulus. According to Keceli (2012), density can be appropriately determined from Vs as follows:
Where the density is measured in units of g/cm3 and VS in units of m/s.
Moreover, the shear modulus, Gmax, of a soil is vital for geotechnical applications and can be calculated from Vs (Ohsaki and Iwasaki, 1973; Kramer, 1996; Mavko et al., 2003; Aki and Richards, 2009) using the following equation:
Furthermore, calculation of the allowable bearing capacity, qa, to the safety factor FS, to avoid sand liquefaction or shear failure; this must be considered for optimum engineering constructions;
3.1 Data acquisition
Active MASW survey was applied through this study, as it is the most prevalent type produces 2D Vs profiles. Park et al. (1999) provided explanations for the field procedures and data processing steps. Additionally, Park et al. (2002) described a summary of optimum acquisition parameters that are presented as separate optimum parameters for active MASW. In this study, Vs for near surface materials in Jizan old city was estimated at 22 sites (Fig. 1) using active MASW procedure (Park et al. 1999; Xia et al. 1999). These data were acquired using Geode seismograph. The energy source used was the hydraulic weight drop of 80 kg. The acquired data were carried out using 24 geophones of low frequency (4.5 Hz), which in turn meant long wavelengths that could reach greater depths, of at least 30 m. The geophone interval was 1 m while the shot-point interval was 5 m with 68 m total length of array throughout 10 shot-points. The 1st shot-point was placed before geophone 1 with 10 m and then moved every 5 m along the spreading profile (Fig. 3). In addition, the national laboratory for soil and building materials testing carried out geotechnical investigations in 2017 at five boreholes in the sabkha zone (Fig. 1) at depths of 16 m, provided the geotechnical data.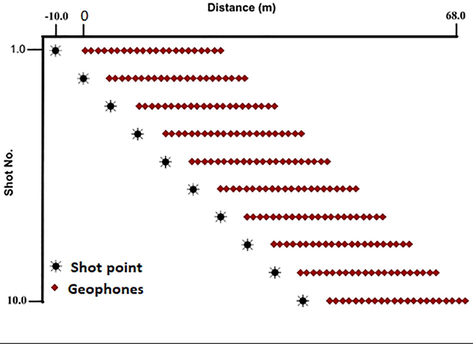
MASW field data acquisition setting.
3.2 Data processing
The MASW data processing was carried out using “SurfSeis 5.0″ software package (Kansas Geological Survey). The processing sequence (Fig. 4) comprises the following steps: a) Conversion of the recorded SEG2 data into KGS format combining all shot gathers into single file. b) Allocate the dispersion analysis comprising the frequency versus phase velocity. c) Inverting each dispersion curve into lD shear-wave velocity profile. d) The produced sets of 1D models were interpolated for producing 2D-Vs geoseismic cross-sections.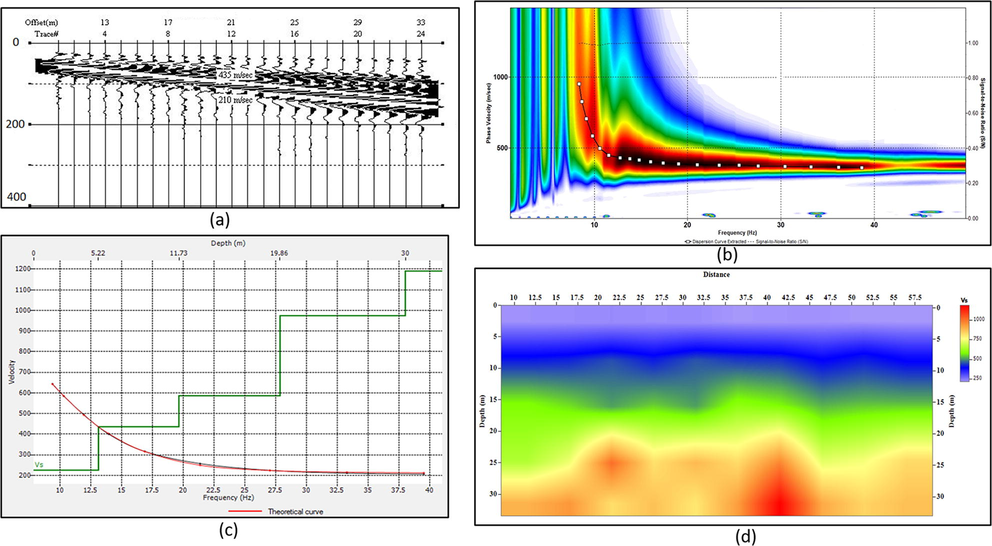
Processing sequence for MASW data.
4 Results and interpretations
The 1D –Vs models reflecting the depth in meters to the respective layer, Vs and layer thickness. The Vs for the depth (h) of soil denoted as VH is computed using the following equation (International Building Council, 2012):
For 30 m average depth, shear-wave velocity is calculated as:
where n is the total number of layers in the top 30 m.
Fig. 5 shows six 1-D velocity-depth profiles for six MASW sites that illustrated in Fig. 1. These profiles signify the urban zones in the Jizan city, where profiles 3 and 8 are located in the potential Jizan salt dome zone while profiles 16, 18, 20, and 22 are within the sabkha zone. Profile 3 indicates four layers, where the topmost three layers extending down to 8.6 m depth have low velocities (less than 300 m/s) suggesting stiff sediments. Below 8.6 m, there is the salt rock type having shear velocity greater than 1000 m/s. Profile 6 illustrates a five-layer model extends 6.4 m depth where velocity increased abruptly to greater than 1900 m/s underneath this depth. Profiles 16 and 20 have very low velocity at greater depths indicating not densely packed sabkha. Profile 18 presents lesser velocities than 360 m/s down to 16.6 m, then increased to 760 m/s till 32 m depth; hard bedrock lies below this depth. In profile 22, the velocity is less than 180 m/s up to a depth of 10 m and increases into 360 m/s up to a depth of 23 m, then further increases to 720 m/s below this depth.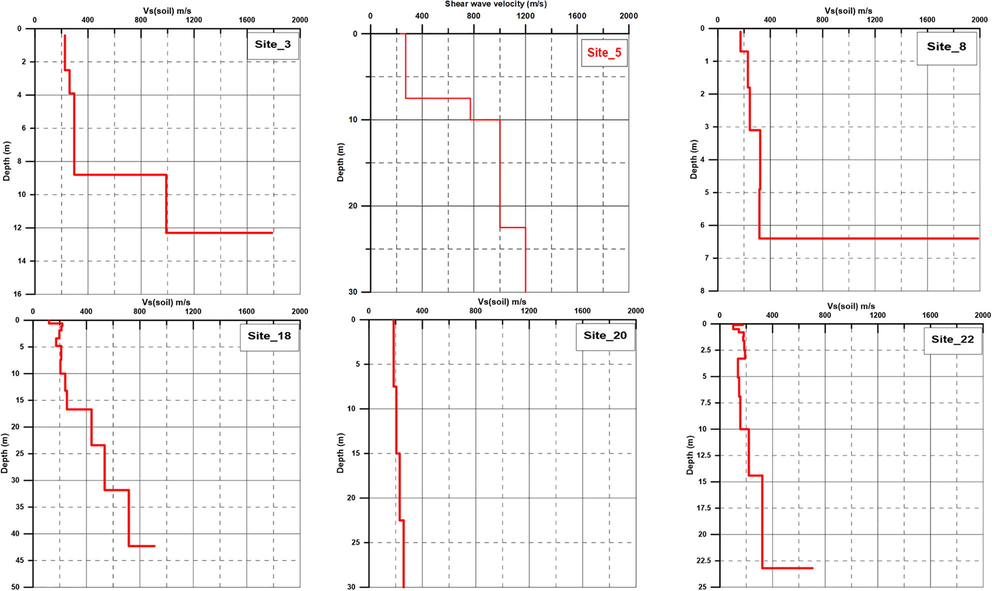
Examples of the resulted 1-D-shear wave velocity models in the study area.
Moreover, the detailed inspection of geotechnical borehole data carried out in the sabkha zone clarifies three distinct lithological units with different stiffness degrees, with stiffness increasing at higher depths (Table 1). These can be characterized as:
Silty sand, very loose to medium dense
Clayey silt, medium stiff to stiff
Medium dense to very dense silty sand
| Average Thickness (m) | lithology | SPT (Soil class) |
|---|---|---|
| 0.0–4.8 |
Silty sand Very loose to medium dense, gray, dry to wet |
9–16 (ML-SM) |
| 4.8–9.6 |
Clayey silt Medium stiff to stiff, dark gray, wet |
1–6 (SM, CL, SC, OH) |
| More than 9.6 |
Silty sand Medium dense to very dense, brown, wet |
Variable up to refusal |
5 Discussion and conclusions
Due to the location of the Jizan area very close to the Red Sea so it can be affected by strong and moderate earthquakes from the Red Sea seismogenic source (e.g., Baish earthquake that recorded on 24 January 2014 with magnitude of 5.1). Moreover, the surface soil of the study area composed mainly of very soft, soft to massive/stiff sediments and some of sediments have poor geotechnical properties (e.g., the sabkhah deposits). These sediments cause the damages of buildings and structures because they provoke the site effect phenomena and a considerable amplification.
The high-resolution 2D shear wave velocity profiles generated in the process clearly display subsurface details up to a depth of 30 m, including soft layers of different degrees of compactness as well as rock materials of varying elastic properties and stiffness. The resulting MASW data reveals the average ground stiffness along the length of the receiver spread. Therefore, the potential weakness zones can be easily identified (Fig. 6) when localized low velocity values (i.e., rocks or sediments of low stiffness) are embedded within higher velocity values (i.e., rock or sediments of higher stiffness).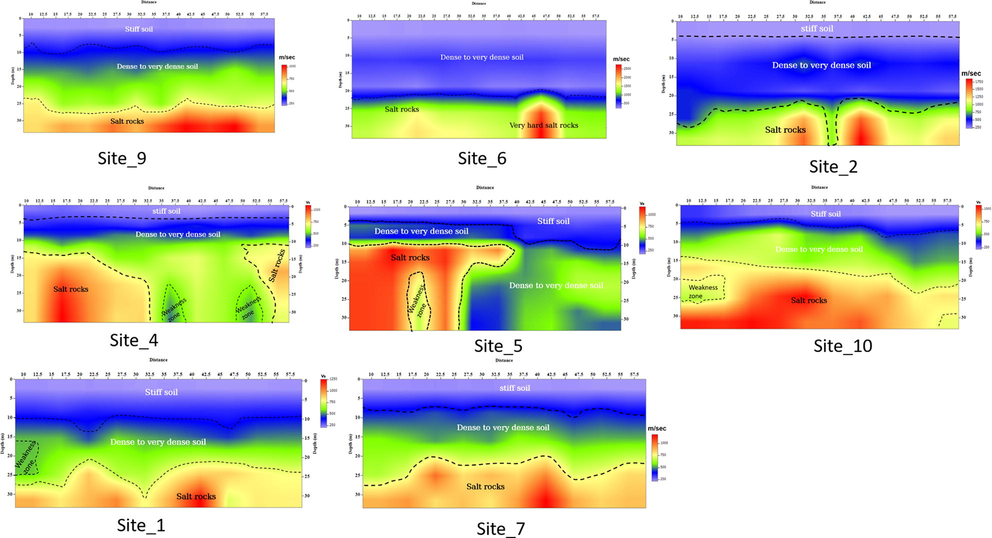
Detected weakness zones in Jizan salt dome region.
Fig. 7 demonstrates the disparity of shear modulus both vertically and laterally inside Jizan city. It is evident that even at equal depths; the values of shear strength of the near-surface sediments in overlying Jizan salt rocks are greater than those of sabkha zone. In the Jizan salt dome region, sites 1–10 have very low shear strength up to 5 m depth, which then gradually increase till the salt rock at depths of 6.4, 8.6, 10 m at sites 8, 4, and 5 respectively. While, the other sites in the same region have lower values of shear strength at greater depths. In contrast, all the study sites in the sabkha zone (sites 11 to 22) reveal lower values of strength down to 30 m depth, except site 15, where intermediate shear strength values have been recorded at the depth ranging between 13 and 22 m, which then decease up to 30 m depth.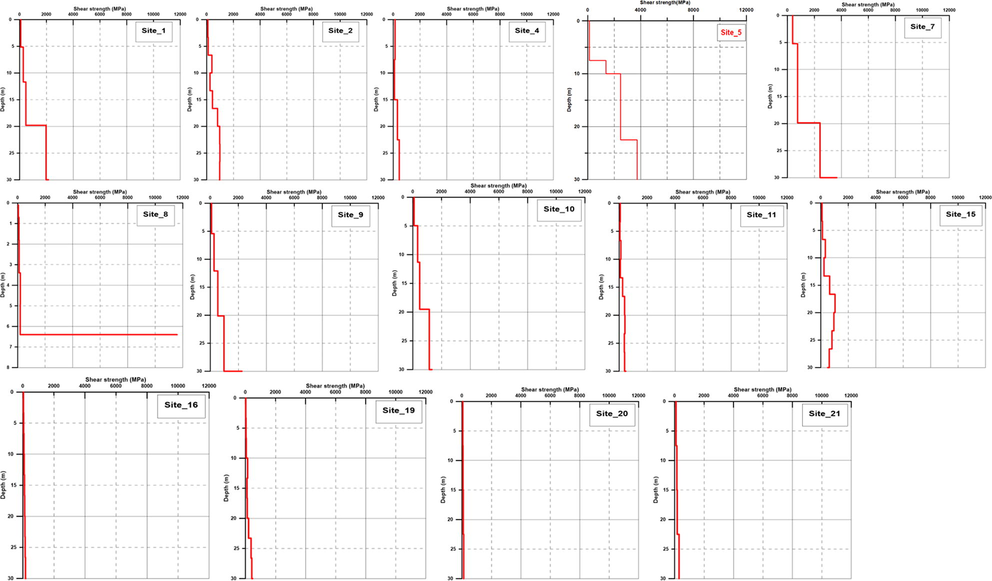
Shear strength variation in the study area.
Fig. 8 illustrates the distribution of qa, throughout the study area. Values of qa are less than 1 kg/cm2 at sites 4, 5, 16, 19, 20, and 21 at the depth of 30 m indicating very soft /loose materials; these are considered by building codes as special cases (Keceli, 2012). On the other hand, the increase to 2.5 kg/cm2 at depths of 13 m and 16 m at sites 2, 8, and 15 suggest stiff or medium dense materials at these depths. Moreover, qa reaches 6.5 kg/cm2 at site 1 at a depth of 20 m, indicating dense materials, while it reaches 8.5 kg/cm2 at site 7 at 20 m depth suggesting the presence of very dense materials. Additionally, qa reaches 3.5 kg/cm2 at 20 m depth at sites 9 and 10. Accordingly, the allowable bearing capacity at a depth of 13 m is less than the recommended values for foundation materials by building codes.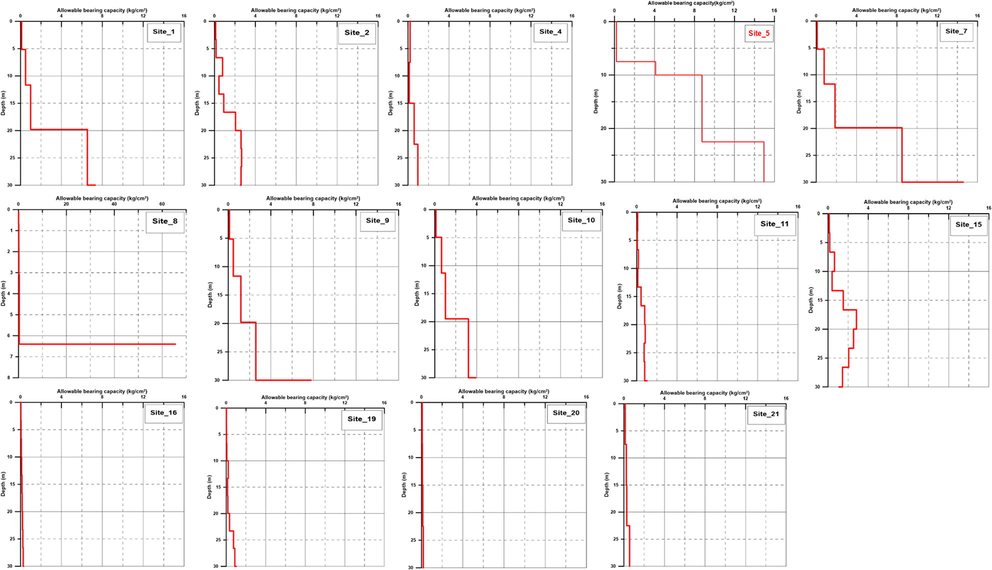
Distribution of the allowable bearing capacity in the study area.
Moreover, the, site classification has been conducted based on the average Vs30 values for Jizan city (Fig. 9), it is concluded that there are three site soil classes C, D, and E. C class represented by deep deposits of dense or medium-dense sand, gravel or stiff clay with thickness from several tens to many hundreds of meters; D class composed of deposits of loose-to-medium cohesionless soil (with or without some soft cohesive layers), or of predominantly soft-to-firm cohesive soil. While E soil profile consisting of a surface alluvium layer with V30s values of class C or D and thickness varying between about 5 m and 20 m, underlain by stiffer material with V s30 greater than 800 m/s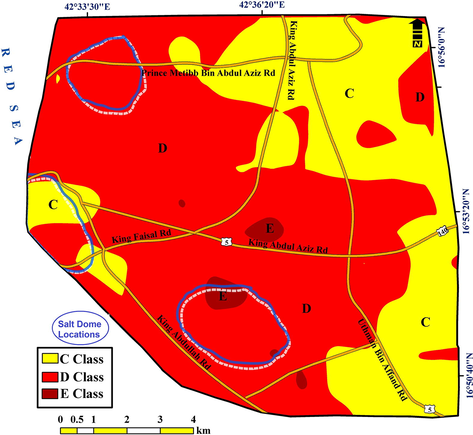
Site soil classes of Jizan area based on Vs30.
Depending on the integrated approach for the geophysical and geotechnical borehole data, it can be concluded that the near-surface sediments, composed of loose stiff medium dense to very dense materials, within the Jizan study area have a significant deleterious impact on the infrastructure and buildings in the area. Shear wave velocity illustrates great variance, heading deeper indicating the presence of sediments with different stiffness values. According to the estimated 2-D MASW profiles, many subsurface weakness zones were detected, especially overlying the salt rocks due to the dissolution of these salt rocks. The topography of the salt rocks is highly irregular indicating different diapiric movements and/or series of weakness zones. The density as well as allowable bearing capacity change drastically either horizontally and/or vertically, indicating a heterogeneous setting reflecting several tectonic activities in this area associated with the Red Sea floor expansion. Results of this study should be forwarded to civil engineers, land-used planners, and decision makers during the design of either new buildings or rehabilitation of pre-existing structures.
Acknowledgements
The authors would like to extend their sincere appreciation to the King Abdul-Aziz City for Science and Technology (KACST) for funding this research work (Project No. 20-0133).
Declaration of Competing Interest
The authors declare that they have no known competing financial interests or personal relationships that could have appeared to influence the work reported in this paper.
References
- Quantitative Seismology. California: University Science Book; 2009.
- The mineralogy of clay fractions in the soils of the southern region of Jizan, Saudi Arabia. J. Agron.. 2008;7(2):3-5.
- [Google Scholar]
- American society for testing and material, 1992. Standard method for penetration test and Split-Barrel sampling of soils. ASTM: D 1586-84, Vol. 4.08, Section 4, pp. 242-246, Philadelphia.
- Seismic site classification and correlation between standard penetration test N value and shear wave velocity for Lucknow City in Indo-Gangetic Basin. Pure Appl. Geophys.. 2013;170:299-318.
- [Google Scholar]
- Explanatory notes to the geological map of the Jizan Quadrangle, sheet 16F. Jeddah, Kingdom of Saudi Arabia: Ministry of Petroleum and Mineral Resources; 1986.
- R. Borcherdt G. Glassmoyer M. Andrews E. Cranswick, Armenia earthquake reconnaissance report: effect of site conditions on ground motions and damage. Earthquake Spectra Special Issue, 23-42.
- International Building Council (IBC), 2012. 2012 International Building Code. ISBN: 978-1-60983-039-7.
- A refined formula for the allowable soil pressure using shear wave velocities. Global J. Civil Struct. Eng.. 2014;2(2):18-26.
- [Google Scholar]
- Soil parameters, which can be determined with seismic velocities. Jeofizik. 2012;16:17-29.
- [Google Scholar]
- Geotechnical Earthquake Engineering. New Jersey: Prentice Hall; 1996.
- The Rock Physics Handbook. Cambridge: Cambridge University Press; 2003.
- S. Nazarian K.H. Stokoe, In situ shear wave velocity from spectral analysis of surface waves, 8th World Conference on Earthquake Engineering Proceedings, 31–38.
- Dynamic shear moduli and Poisson’s ratio of soil deposits. Soils Found.. 1973;13:61-73.
- [Google Scholar]
- Optimum Field Parameters of an MASW survey. Tokyo: SEG-J; 2002. May 22 23
- Parry, R.H.G., 1977. Estimating bearing capacity of sand from SPT values. Journal of Geotechnical and Geoenvironmental Engineering ASCE 103 (Gt. 9), 1014-1043.
- K.H. Stokoe II G.W. Wright A.B. James M.R. Jose, Characterization of geotechnical sites by SASW method, in geophysical characterization of sites. ISSMFE Technical Committee #lo, edited by R. D. Woods, Oxford Publishers, New Delhi. Geophys. Devel. Ser. Soc. Explor. Geophys. 1, 214-226.
- Estimation of near-surface velocity by inversion of Rayleigh waves. Geophysics. 1999;64:691-700.
- [Google Scholar]


