

Translate this page into:
Geospatial analysis of wetland dynamics: Wetland depletion and biodiversity conservation of Isimangaliso Wetland, South Africa
⁎Corresponding author. orimoloyeisrael@gmail.com (Israel R. Orimoloye)
-
Received: ,
Accepted: ,
This article was originally published by Elsevier and was migrated to Scientific Scholar after the change of Publisher.
Peer review under responsibility of King Saud University.
Abstract
The Isimangaliso Wetland (IW) in KwaZulu-Natal Province of South Africa has a variety of wetlands that contribute valuable ecosystem services to a notable number of people, the natural species habitat and tourism interests. Wetlands are epoch-making reproducing and nourishing zones for wildlife and give shelters and protection for sea creatures. As with any natural habitat, wetlands are important in supporting species diversity as well as providing the climate moderating element. This study aimed at appraising the spatial pattern of the Isimangaliso Wetland, the potential determinants and effects of the wetland depletion between 1987 and 2017 using remote sensing and GIS approach. Landsat Thematic Mapper (TM) images acquired for 1987, 1997, 2007 and Landsat 8 Thermal Infrared Sensor (TIRS) and Operational Land Imager (OLI) imagery for 2017 was acquired from the archives of United States Geological Survey (USGS) for the analysis using ArcGIS 10.2. The Normalized Difference Water Index (NDWI) analyses between 1987 and 2017 successfully revealed the significant depletion of the water surrounding IW area which might be as a result of natural or human activities which may include climate change, built-up areas and agricultural activities. In 1987 and 2017, the results showed that wetland extent was 655.416 Km2 and 429.489 Km2 respectively which connotes that IW has witnessed significant changes during the study period over the area. It was also revealed that the other land features (vegetation, built-up, open surface and rocky surface) over the area increased from 2149.911 Km2 to 2375.838 Km2 in 1987 and 2017 respectively. The overall classification accuracy of 97.55% and Kappa coefficient of 0.941. This wetland depletion might have a significant impact on biodiversity including human and animals as well as plants thus diminishing its world heritage status. Consequently, this natural gift needs to be conserved to create a livable environment for wetland animals in order to moderate local climate as well as preserve human wellness and protection by reducing flood disaster and maintaining efficient water quantity and quality in the area.
Keywords
Geospatial analysis
Wetland dynamics
Wetland depletion
Conservation
Biodiversity

1 Introduction
Remote sensing information including derived vegetation indices and biophysical outcomes have vital preferences, especially high temporal resolution of measurements, wide scope and simple accessibility, for observing and evaluating temporal patterns of natural landscapes and land environments. As a fundamental source of multi-temporal analyses of the land surface, satellite information (especially Landsat Imageries) has been used by several researchers to monitor crucial biological community and land surface properties, map land cover patterns and examine their differences (Nguyen et al., 2012; Adefisan et al., 2015; Nsubuga et al., 2017; Onamuti et al., 2017; Stephen et al., 2017; Orimoloye et al., 2018). The persistent decline in the natural landscape, accelerating natural resource extinction, climate change impact and difficulties to saving biodiversity appear to be progressively unassailable (Hirsch et al., 2011; Sayer et al., 2013). Assessment and monitoring of natural landscape, habitat transformation, extinction of species and the decline of animal, plant populations and wetland depletion necessitate compelling action (Naeem et al., 2016; Waldron et al., 2017).
Wetlands can be ascribed to the lands intermediate between terrene and marine eco-systems where the water table is usually near the surface or the land areas that are covered by shallow water. The essentiality of the wetlands globally is progressively getting apt attention as they add to a healthy and loveable environment in various ways (Cohen et al., 2016; Richardson et al., 2016). Wetlands retain water to a high extent during dry periods, hence keeping the water table high and moderately stable. More so, during the occurrence of flood, wetlands play a vital role in mitigating flood and to trap suspended solids and associated nutrients. Consequently, streams moving into lakes by means of wetland zones will transport less suspended solid nutrients to the lakes than if they stream directly into the lakes and many times lake creatures such as phytoplankton and fishes fed on these nutrients (Knight et al., 2001; Cronk and Fennessy, 2016). Furthermore, wetlands are crucial breeding and feeding regions for wildlife and create shelters and protection for sea creatures. Likewise, with every natural habitat, wetlands are essential in preserving species diversity. Wetlands also create an environment for recreation and tourist attraction thus contributes to the economy of a particular area. Consequently, the elimination of such wetland systems as a result of urbanization or other factors typically causes the extinction of the sea animals and water quality deteriorates (Bassi et al., 2014; Garg, 2015). Most of the wetland-subordinate animals live in various local populations supported by the infrequent change. Conservation of smallest wetland densities in human-governed landscapes is essential to preserving these animals and other environmental benefits from wetlands (Bassi et al., 2014).
Natural landscape extinction and biodiversity conservation have created a rich biota related to wetlands. Wetlands usually happen in discrete patches of an upland environment, such that most local populations of wetland varieties are small and separated and sometimes are exposed to extinction (Serran and Creed, 2016; Salaria, 2017). However, wetland depletion and extinction caused by anthropogenic activities and natural causes, all require constant spatial assessment and regulations to restrict it, are required. Therefore, this study is aimed at appraising the spatial pattern of wetlands, particularly the potential determinants and effects of wetland depletion in Isimangaliso Wetland (IW), South Africa between 1987 and 2017 using remote sensing and GIS techniques. Due to the need to protect IW’s both its global and ecological significance (Grundling et al., 2013; Hansen, 2014).
2 The study area and research methods
Isimangaliso Wetland (IW) is situated on the east shoreline of KwaZulu-Natal, South Africa, approximately 275 km northern part of Durban. IW positioned as South Africa's third-biggest secured zone, spanning 280 km of the coastline, from the Mozambican fringe in the north to Mapelane south of the Lake St. Lucia estuary, and made up of about 3280 km2 of natural biological communities superintended by the Authority of iSimangaliso. The IW Park was previously known as the Greater St. Lucia Wetland Park, however, it was renamed “Isimangaliso Wetland Park” in November 2007.
The IW Park was declared a world heritage site in light of the rich biodiversity, outstanding environments and natural magnificence appearing in a moderately little area. The reason behind the tremendous suitable variety in the region is the colossal of various ecosystems on the park, extending from coral reefs and sandy shorelines to subtropical rise woodlands, savannas and wetlands. Creatures available on the park include African panther, Africa lion, elephant, southern white and dark rhino, wild ox, and in the sea; dolphins, whales and marine turtles including the loggerhead and leatherback turtle (Nel et al., 2012). The park created shelters for more than 800 hippopotami and 1200 Nile crocodiles as a result of its values and ecological benefits. Fig. 1 shows the map of IW in KwaZulu-Natal province of South Africa.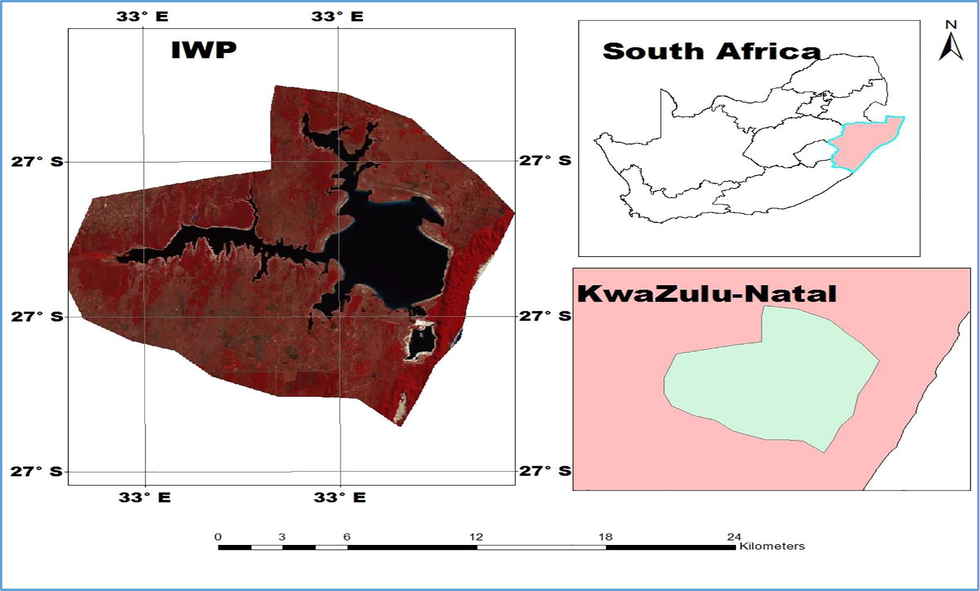
Location of Isimangaliso, KwaZulu Natal Province, South Africa.
To determine the changing trends in wetland depletion of IW, satellite images were employed. The images were freely acquired from United States Geological Survey (USGS) database between 1987 and 2017 over the study area as represented in Table 1.
Data
Year
Date Acquired
Path/Row
Landsat thematic mapper (Landsat5 TM)
1987
1986–10-18
167/079
Landsat5 TM
1997
1997–10-11
167/079
Landsat5 TM
2007
2007–09-21
167/079
Landsat8 OLI_TIRS
2017
2017–08-25
167/079
3 Image processing
In this study, the images of IW were acquired from USGS database using maximum likelihood classification. The imageries collected for the analysis are in four segments, image data in 1987, 1997, 2007 and 2017. All the images selected were good quality of less than 10% cloud cover. The information in Table 1 shows the specifications of the image of IW used for this study and the images were identified with their imaging period by month, year as well as the day of the year with path and row of different imageries, were analyzed using ArcGIS 10.2. The Operational Land Imager (OLI) image comprises of the near-infrared (NIR) band, shortwave infrared (SWIR) band, visible bands, and thermal infrared (TIR) band, which are present in TM images (1987, 1997, 2007 images). TIRS bands are also thermal infrared bands with a higher resolution compared with TIR bands (2017 image).
4 Results and discussion
4.1 Digital elevation model and normalized difference water index of IW
4.1.1 Digital elevation model
The current intensive spatial monitoring of IW conditions for three decades (1987 to 2017) had shown drastic changes that occurred over the years and this may also be worth considering other features which are sensitive to wetland extinction as a result of hydrologic phenomena (Fig. 2). These features include flow direction, aspect, hill shade and flow which might also contribute or play a vital role in the current state of IW wetland (Conly and Van Der Kamp, 2001). The information in Fig. 2 revealed that the hillshade had the highest value of about 180 m3/s over the wetland region. Studies have shown that hillshade and other hydrologic features can determine wetland storage which might connote either reduction or increment of wetland extent (Los Huertos and Smith, 2013; Golden et al., 2014). The outcomes of this study also reveal that the flow direction witnessed increase with about 180 m3/s in the wetland zone which might contribute to the depletion of the wetland which may also negatively affect the biodiversity. It has been asserted by previous studies that flow direction and the rate of water movement into and out of wetlands is controlled by the temporal and spatial variability of water volume availability in the wetland (Golden et al., 2014; Karim et al., 2016; Nsubuga et al., 2017). A change in volume with distance generates a force that causes water to move from zones of high to the zones of lower volume.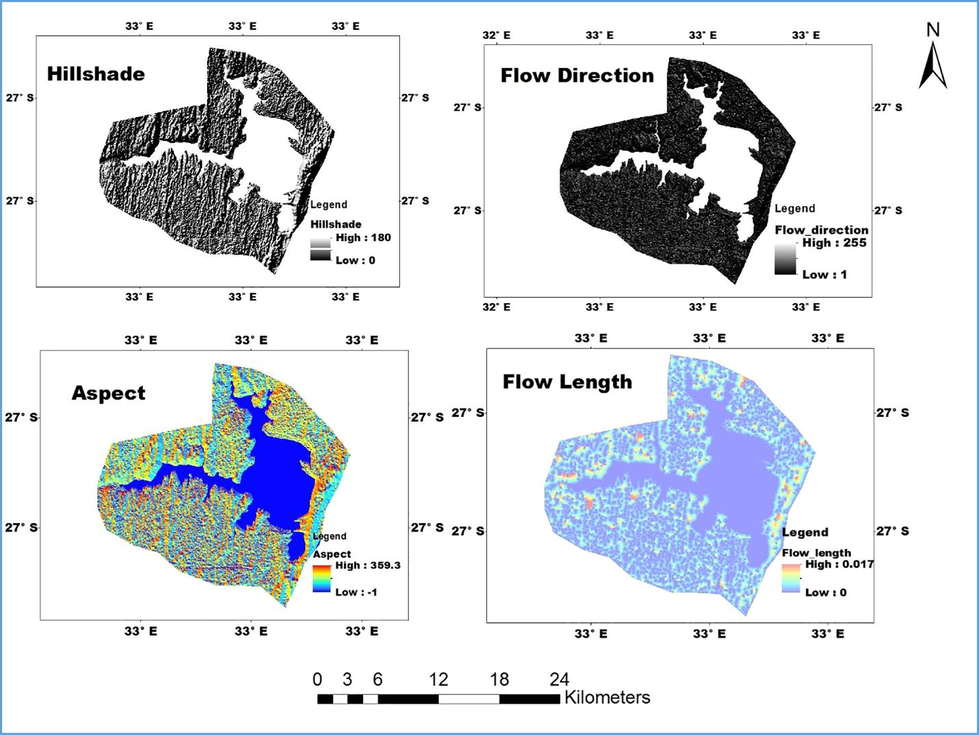
Digital Elevation Model of IW.
The hydrology tools such as flow length, flow direction and aspect were used to model the flow of water across a surface. The result of the flow aspect in Fig. 2 revealed that the IW had the highest value of 358 m3/s and this may influence the flow length and direction of the wetland (Wörman and Kronnäs, 2005). More so, this can also determine how water flows across an area and the changes in that region may affect the volume of water availability (Golden et al., 2014; Vepraskas and Craft, 2016). Aspect identifies the downslope direction of the maximum rate of change in water volume from wetland to its environs.
4.1.2 Normalized difference water index
An analysis of NDWI has been presented in this study based on the study by Campos et al. (2012) which utilized the Modified Normalized Difference Water Index. This index has been verified and utilized in the wetlands, river, lakes and ocean studies (Gilmore et al., 2015; Kavyashree and Ramesh, 2016; Nsubuga et al., 2017). This study showed that the NDWI can noticeably influence or enhance the wetland and information on water mostly in the area mainly with the natural wetland. The NDWI can depress the anthropogenic activities such as built-up, land use and landscape alteration efficiently while describing water information can also effectively extract the water body information from the other land surface features. The NDWI can reveal subtle features of water-related features of wetlands and can be more efficiently at evaluation than the Normalized Difference Vegetation Index (NDVI) as well as being better than other visible spectral bands due to its vast dynamic data range (Gu et al., 2007, 2008). The utilization of the NDWI in the Landsat imageries of IW has achieved a significant result. The NDWI analysis between 1987 and 2017 successfully revealed a significant depletion of the water surrounding IW area which might be as a result of natural or human activities including climate change, built-up and agricultural activities (Conly and Van Der Kamp, 2001). In addition, taking the advantage of the index (Fig. 3), the NDWI can connote a very good proxy for plant water stress and other wetland creatures inhabited in the wetland. In the years 1987 and 1997, the results show that the NDWI was high on the wetland area compared to other years which shows that recent human activities might play a vital role in the wetland extinction experienced in the study area (Quesnelle et al., 2014). It can also be denoted by the result that year 2017 had the lowest NDWI and this might have a significant impact on biodiversity including plants as well as animals. This natural gift needs to be conserved to create a livable environment for wetland animals in order to moderate local climate as well as securing human wellbeing by reducing flood-related hazards and saving water quality (Quesnelle et al., 2014; Watson et al., 2016).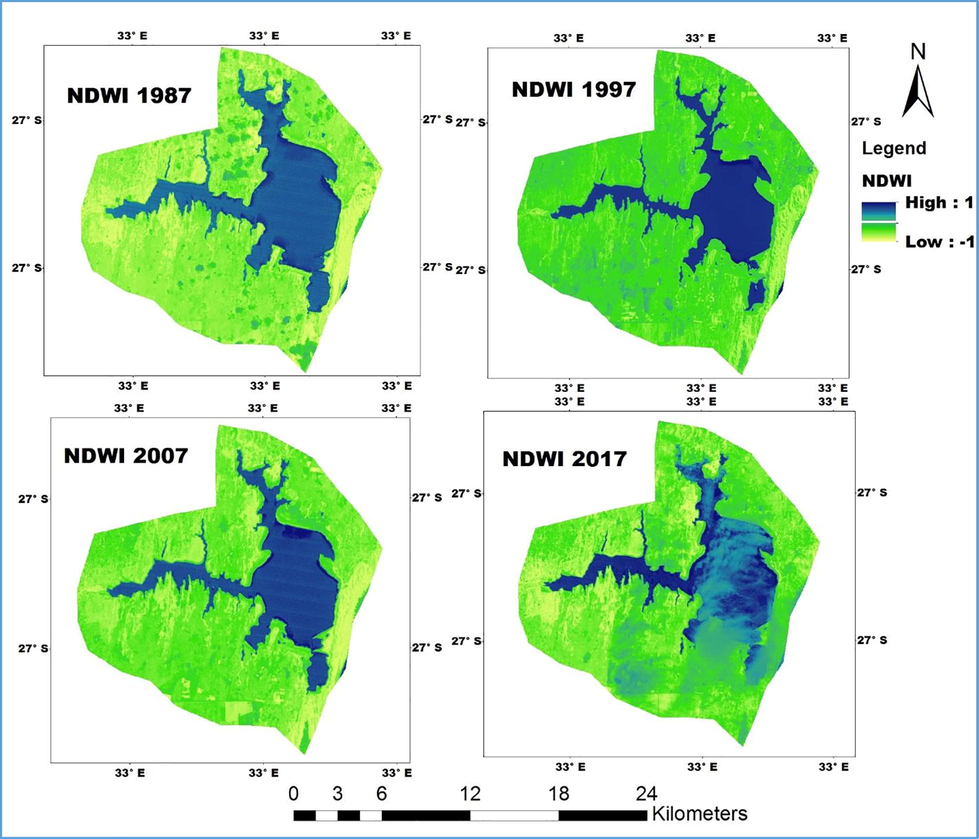
NDWI of IW between 1987 and 2017.
5 Wetland depletion of IW between 1987 and 2017
This wetland is characterized by one or more special habitat or biodiversity attributes that make the site important for local conservation efforts. These include supporting important populations of species of conservation concern; supporting large populations of wetland-dependent species; providing important migration, breeding or feeding sites; and characterized by unusually high natural habitat diversity (Lehikoinen et al., 2016). The information in Fig. 4 showed the changes and the pattern of wetland in the study area between 1987 and 2017. Monitoring the spatial differences in wetlands and appraising their influential factors is critical for developing sensible strategies for wetland restoration and conservation of its ecological value for ecosystems.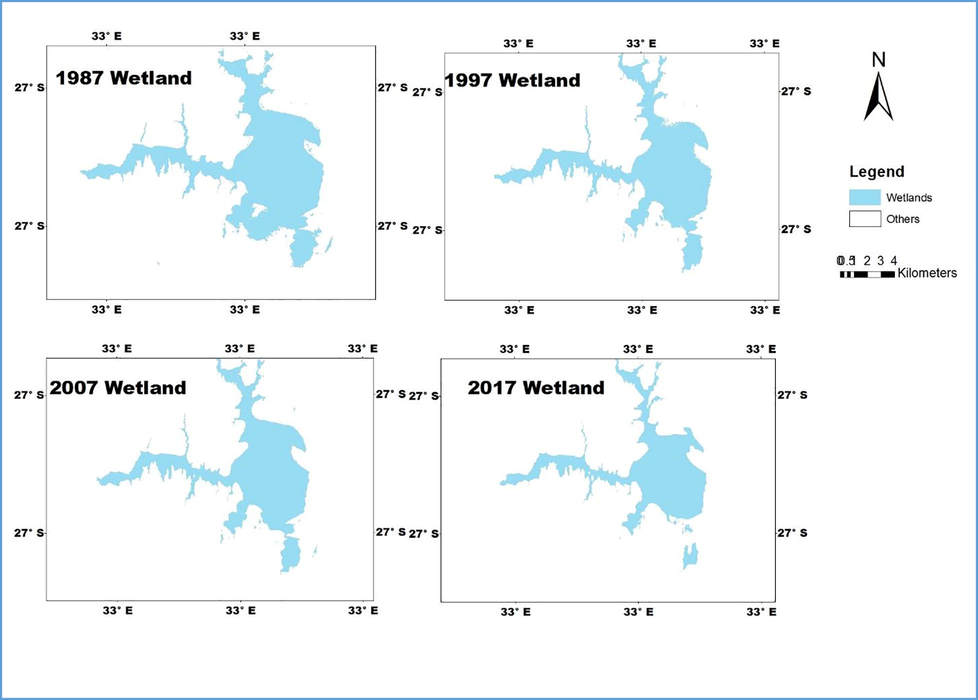
Wetland depletion of Isimangaliso between 1987 and 2017.
This study has revealed that the spatial differences or changes in wetland within Isimangaliso Wetland area and its environs can be assessed by utilizing the spatial analyses of satellite images. Notable changes in the extent and the land features of the IW wetland were assessed from the spatial analyses of the satellite imageries between 1987 and 2017. The wetland area has declined from 655.416 km2 in 1987 to 429.489 km2 in 2017 with a substantial reduction in the size of the IW. While the other land features had witnessed increase between 1987 and 2017 from 2149.911 km2 to 2375.838 km2 respectively (Table 2). The land features and water area cover changes within the wetland were associated with the spatiotemporal changes in the land cover at the catchment area. It can be connoted that the changes which occurred in the area might be as a result of natural or anthropogenic activities such as climatic conditions, deforestation, environmental injustice, urbanization and changes in the hydrologic (Grundling et al., 2013). Also, the land use changes (built-up, open surface and bare surface) witnessed in the catchment are the major factors influencing the depletion of wetland size and extent, water availability and biodiversity (Gauthier et al., 2005; Perreault et al., 2017). More so, these changes may negatively influence the hydrologic downturn and other land surface events in the watershed area. All these causes and effects are witnessed in the form of degradation and the loss of habitats, the biodiversity changes, reduced water quantity and quality and the declining migratory wetland animal’ population in IW (Berteaux et al., 2016; Perreault et al., 2017).
Years/Wetlands depletion
Area coverage (km2)
Percentage coverage (%)
1987
Wetland
655.416
23
Others
2149.911
77
1997
Wetland
558.315
20
Others
2247.012
80
2007
Wetland
544.707
19
Others
2260.62
81
2017
Wetland
429.489
15
Others
2375.838
85
The results from this study show good overall classification accuracy during the study period. The classification of 1987 images shows an overall accuracy value of 96.4% as well as Kappa coefficient value of 0.89 while the imagery of 1997 gave an accuracy of 98.63% and the kappa coefficient value of 0.975. The classifications of years 2007 and 2017 have revealed an accuracy value of 97.54 and 97.63%, and kappa coefficient values 0.9527 and 0.9497 respectively.
6 Causes of change or depletion in the IW and their potential impact on water resources and ecosystem conservation
The causes of changes in wetland pattern in recent years majorly include natural elements (such as climate change, sediment condition differences) and human activities (agricultural practices, built up, deforestation). Wetland processes in the study area have been slowed down in recent years (Grundling et al., 2013). Anthropogenic activities and environmental degradation can have enormous effects on natural wetland by modifying natural landscapes with various human activities which might have adverse impacts on ecological systems.
Although wetlands can moderate watershed water quantity and quality as well as their capacity to process or reduce pollutants, most wetlands have suffered functional degeneration. Thus, it is crucial to estimate the severity of the depletion with a conventional technique such as manual mapping and interviews. Consequently, this study appraised the wetland of the study area using remote sensing and GIS methods to detect the depletion of IW during the study period. Results showed that the IW has declined by 225.927 km2 (8%) between 1987 and 2017 supported by Grundling et al. (2013) where the wetland extent declined by 11% and grassland increased by 7%. These changes might have significant effects on biodiversity and ecosystem services in the area (Grundling et al., 2013; Mushtaq and Pandey, 2014). Moreover, studies have asserted that wetlands are jeopardized by several factors including water and air pollutants, climate change, environmental injustice as well as hydrologic alteration (Grundling et al., 2013; Song et al., 2014; Romshoo and Rashid, 2014; Romshoo et al., 2015). Studies have investigated and revealed that a notable percentage of the earth’s remaining wetlands hydrology have been significantly undermined (Dahl et al., 1991; Tangen and Finocchiaro, 2017). Although the frequency or magnitude of such depletions has not been properly assessed to some pronounced extent in Africa and in other developing nations (Marlor et al., 2014), proper management of wetland ecosystems is essential as it will provide a variety of environmental functions and services as well as contribute significantly to the human wellbeing and livelihoods in the wetland area.
7 Aquatic diversity and wetland values
Wetlands are usually illustrated as “kidney of the landscape (Amani et al., 2017; Talukdar, 2017). Aquatic biodiversity is dependent on some factors such as geological conditions and hydrologic regime. Different attempts are being made to preserve the biodiversity found in wetlands, swamp, marches, streams and waterways. The purpose of this crucial biodiversity is to limit its loss through feasible management and safeguard practices (Miller et al., 2016; Talukdar, 2017). One of the techniques in conserving biodiversity is to appraise the diversity of natural resources available and recognize those that are significant and most crucial (Knight, 1997; Miller et al., 2016). Awareness of the unique nature of biodiversity contributes to managing habitat species populations and quality available in the wetland zones.
In South Africa, wetlands, lakes, streams and other freshwaters embrace a wider diversity of biota describing almost all creatures inhabited in the water cover-related areas. It might be difficult to analyze the various diversities in South African wetlands with reference to various habitats as well as the changes that ensue due to climate variability and other anthropogenic disturbances (Gauthier et al., 2005; Hansen, 2013). From the environmental and ecological perspective, the diversity of species available in the wetlands connotes the relative importance of the marine biodiversity issue overall.
Wetlands give many commodities and services to humanity. Regional and local wetlands are constitutive parts of bigger natural landscapes, their values and functions to humans who rely on both their location and area covered. Every wetland thus is ecologically unique and plays various valuable tasks including urban climate moderation, recycling of nutrients, floods attenuation, water filtering, sustainability of streamflow, groundwater replenishment and also serves in providing drinking water and wildlife habitat (Richardson et al., 2016; Bassi et al., 2014). The interplay between man and wetlands during the last few decades has been of concern more evidently as a result of rapid population growth associated with intensified industrial, commercial and residential development further leading to pollution of wetlands by industrial and agricultural practices, domestic sewage as well as fertilizers, insecticides and feedlot wastes. Furthermore, the fact that wetland values are most times ignored has brought about the risk to the source of these advantages.
8 Conclusion
This study has revealed that the transformation of IW wetland and shifts in biodiversity induced by both natural and human processes can be accurately appraised by remotely sensed data. This study has presented a novel quantification of wetland depletion that had occurred in the study area using fine-scale NDWI and change detection analyses. These results open up new opportunities to examine the current size of IW and its potential impact on biodiversity and urgent intervention in conserving the wetland. The result from Landsat images data shows land use activities have reduced wetland extent and distribution by 5% between 1987 and 2017. Wetland loss could be a significant problem for the local communities that depend on them as a natural resource as well as for many wetland species. Such significant problems illustrate the need for improved management by both the communities and the environmental policy-makers. The wetland map and land-use change assessment on wetlands can help to underscore the wetland depletion and its attendant vulnerability as well as serves as a guide land-use practices that have a direct and indirect effect on wetlands. Subsequently, a more thorough evaluation of the wetland dynamics and depletions monitoring necessitate meteorological variables such as rainfall amount, relative humidity and temperature incorporated with remotely sensed data.
Acknowledgements
Authors would like to thank the United State Geological Survey (USGS) for providing satellite imageries and University of Fort Hare, Alice South Africa for creating an enabling environment for research.
Competing interests
The authors declare that they have no competing interests.
Ethics, consent and permissions
Not applicable.
Funding
Not applicable.
References
- Application of geo-spatial technology in identifying areas vulnerable to flooding in Ibadan metropolis. J. Environ. Earth Sci.. 2015;5(14):153-166.
- [Google Scholar]
- Wetland classification in Newfoundland and Labrador using multi-source SAR and optical data integration. GISci. Remote Sens. 2017:1-18.
- [Google Scholar]
- Status of wetlands in India: A review of extent, ecosystem benefits, threats and management strategies. J. Hydrol. Region. Stud.. 2014;2:1-19.
- [Google Scholar]
- Effects of changing permafrost and snow conditions on tundra wildlife: critical places and times. Arct. Sci.. 2016;1:1-26.
- [Google Scholar]
- Normalized difference water indexes have dissimilar performances in detecting seasonal and permanent water in the Sahara-Sahel transition zone. J. Hydrol.. 2012;464:438-446.
- [Google Scholar]
- Do geographically isolated wetlands influence landscape functions? Proc. Natl. Acad. Sci.. 2016;113(8):1978-1986.
- [Google Scholar]
- Monitoring the hydrology of Canadian prairie wetlands to detect the effects of climate change and land use changes. Environ. Monit. Assessm.. 2001;67(1–2):195-215.
- [Google Scholar]
- Wetland Plants: Biology and Ecology. CRC Press; 2016.
- Dahl, T. E., Johnson, C. E., Frayer, W. E. (1991). Wetlands, status and trends in the conterminous United States mid-1970's to mid-1980's. US Fish and Wildlife Service.
- Wetland assessment, monitoring and management in India using geospatial techniques. J. Environ. Manage.. 2015;148:112-123.
- [Google Scholar]
- Interactions between land use, habitat use, and population increase in greater snow geese: what are the consequences for natural wetlands? Glob. Change Biol.. 2005;11(6):856-868.
- [Google Scholar]
- Gilmore, S., Saleem, A., Dewan, A. (2015). Effectiveness of DOS (Dark-Object Subtraction) method and water index techniques to map wetlands in a rapidly urbanising megacity with Landsat 8 data. In Research@ Locate'15 (pp. 100–108). http://SunSITE. Informatik. RWTH-Aachen. DE/Publications/CEUR-WS/.
- Hydrologic connectivity between geographically isolated wetlands and surface water systems: a review of select modeling methods. Environ. Model. Softw.. 2014;53:190-206.
- [Google Scholar]
- Assessing the distribution of wetlands over wet and dry periods and land-use change on the Maputaland Coastal Plain, north-eastern KwaZulu-Natal, South Africa. South Afr. J. Geomat.. 2013;2(2):120-138.
- [Google Scholar]
- A five-year analysis of MODIS NDVI and NDWI for grassland drought assessment over the central Great Plains of the United States. Geophys. Res. Lett.. 2007;34(6)
- [Google Scholar]
- Evaluation of MODIS NDVI and NDWI for vegetation drought monitoring using Oklahoma Mesonet soil moisture data. Geophys. Res. Lett.. 2008;35(22)
- [Google Scholar]
- New geographies of conservation and globalisation: the spatiality of development for conservation in the iSimangaliso Wetland Park, South Africa. J. Contemp. African Stud.. 2013;31(3):481-502.
- [Google Scholar]
- Hansen, M. (2014). Struggles over conservation space: Social justice in the iSimangaliso Wetland Park, South Africa Lund University
- Acknowledging conservation trade-offs and embracing complexity. Conserv. Biol.. 2011;25(2):259-264.
- [Google Scholar]
- Impact of climate change on floodplain inundation and hydrological connectivity between wetlands and rivers in a tropical river catchment. Hydrol. Process.. 2016;30(10):1574-1593.
- [Google Scholar]
- Wetland mapping and change detection using remote sensing and GIS. Int. J. Eng. Sci.. 2016;6(8):2356.
- [Google Scholar]
- Wildlife habitat and public use benefits of treatment wetlands. Water Sci. Technol.. 1997;35(5):35-43.
- [Google Scholar]
- Surface flow (SF) treatment wetlands as a habitat for wildlife and humans. Water Sci. Technol.. 2001;44(11–12):27-37.
- [Google Scholar]
- Habitat-specific population trajectories in boreal waterbirds: alarming trends and bioindicators for wetlands. Anim. Conserv.. 2016;19(1):88-95.
- [Google Scholar]
- Wetland bathymetry and mapping. In: Wetland Techniques. Netherlands: Springer; 2013. pp. 49–86
- [Google Scholar]
- Disturbance and wetland type alter reed canarygrass cover in northern Michigan. Invas. Plant Sci. Manage.. 2014;7(1):121-131.
- [Google Scholar]
- Conserving biodiversity through ecological restoration: the potential contributions of botanical gardens and arboreta. Candollea. 2016;71(1):91-98.
- [Google Scholar]
- Assessment of land use/land cover dynamics vis-à-vis hydrometeorological variability in Wular Lake environs Kashmir Valley, India using multitemporal satellite data. Arab. J. Geosci.. 2014;7(11):4707-4715.
- [Google Scholar]
- Naeem, S., Chazdon, R., Duffy, J.E., Prager, C., Worm, B. (2016, December). Biodiversity and human well-being: an essential link for sustainable development. In: Proc. R. Soc. B (Vol. 283, No. 1844, p. 20162091). The Royal Society.
- Diversity of bivalve molluscs in the St Lucia Estuary, with an annotated and illustrated checklist. Afr. Invertebr.. 2012;53(2):503-525.
- [Google Scholar]
- Mapping the irrigated rice cropping patterns of the Mekong delta, Vietnam, through hyper-temporal SPOT NDVI image analysis. Int. J. Rem. Sens.. 2012;33(2):415-434.
- [Google Scholar]
- Detecting changes in surface water area of Lake Kyoga sub-basin using remotely sensed imagery in a changing climate. Theoret. Appl. Climatol.. 2017;127(1–2):327-337.
- [Google Scholar]
- Remote sensing appraisal of Lake Chad shrinkage connotes severe impacts on green economics and socio-economics of the catchment area. Open Sci.. 2017;4(11):171120.
- [Google Scholar]
- Spatiotemporal monitoring of land surface temperature and estimated radiation using remote sensing: human health implications for East London South Africa. Environ. Earth Sci.. 2018;77(3):77.
- [Google Scholar]
- Remote sensing evaluation of High Arctic wetland depletion following permafrost disturbance by thermo-erosion gullying processes. Arctic Sci.. 2017;1:1-17.
- [Google Scholar]
- Low reproductive rate predicts species sensitivity to habitat loss: a meta-analysis of wetland vertebrates. PloS one. 2014;9(3):e90926.
- [Google Scholar]
- C.J. Richardson G.L. Bruland M.F. Hanchey A.E. Sutton-Grier 2016 Soil Restoration: The Foundation of Successful Wetland Reestablishment Wetl. Soil. Gene. Hydrol. Landscap. Classificat. 469
- Assessing the impacts of changing land cover and climate on Hokersar wetland in Indian Himalayas. Arab. J. Geosci.. 2014;7(1):143-160.
- [Google Scholar]
- Implications of shrinking cryosphere under changing climate on the streamflows in the Lidder catchment in the Upper Indus Basin, India. Arct. Antarc. Alpine Res.. 2015;47(4):627-644.
- [Google Scholar]
- Salaria, S. (2017). Rate of Vegetation Recovery in Restored Prairie Wetlands.
- Ten principles for a landscape approach to reconciling agriculture, conservation, and other competing land uses. Proc. Natl. Acad. Sci.. 2013;110(21):8349-8356.
- [Google Scholar]
- New mapping techniques to estimate the preferential loss of small wetlands on prairie landscapes. Hydrol. Process.. 2016;30(3):396-409.
- [Google Scholar]
- Long-term denitrification rates in created riverine wetlands and their relationship with environmental factors. Ecol. Eng.. 2014;72:40-46.
- [Google Scholar]
- Analysis of the physical growth and expansion of Makurdi Town using remote sensing and GIS techniques. Imp. J. Interdiscip. Res.. 2017;3(7)
- [Google Scholar]
- Diversity indices of aquatic macrophytes in Jharokh Wetland, Assam, India. Int. J. Adv. Res. Idea. Innov. Technol.. 2017;3(5):32-35.
- [Google Scholar]
- A case study examining the efficacy of drainage setbacks for limiting effects to wetlands in the Prairie Pothole Region, USA. J. Fish Wildlife Manage. 2017
- [Google Scholar]
- Wetland soils: genesis, hydrology, landscapes, and classification. CRC Press; 2016.
- Reductions in global biodiversity loss predicted from conservation spending. Nature. 2017;551(7680):364.
- [Google Scholar]
- Quantifying flood mitigation services: The economic value of Otter Creek wetlands and floodplains to Middlebury, VT. Ecol. Econ.. 2016;130:16-24.
- [Google Scholar]
- Effect of pond shape and vegetation heterogeneity on flow and treatment performance of constructed wetlands. J. Hydrol.. 2005;301(1–4):123-138.
- [Google Scholar]


