

Translate this page into:
Geophysical investigations for the identification of subsurface features influencing mineralization zones
⁎Corresponding authors. A.R.A.Mahmoud@tudelft.nl (Ahmed Abdelrady), mohammed.musaab@uni-miskolc.hu (Musaab A.A. Mohammed), ahmedmohamed@aun.edu.eg (Ahmed Mohamed)
-
Received: ,
Accepted: ,
This article was originally published by Elsevier and was migrated to Scientific Scholar after the change of Publisher.
Peer review under responsibility of King Saud University.
Abstract
The numerous hydrothermal alteration zones and subsurface structures affecting the mineralized deposits of the Dungash region were identified using aeromagnetic data. The Center of Exploration Targeting (CET) approach and several filters, such as reduction-to-pole, Tilt derivative, First Vertical Derivative, Horizontal gradient map, Downward continuation, analytical signal methods, regional, and residual separation, were used to analyze the aeromagnetic data. The research region is impacted by several structural trends running in the N-S, E-W, NW-SE, and NE-SW directions, and these trends are strongly related to the gold mineralization and surrounding hydrothermal alteration zones. In the NW-SE direction, four alteration zones have been identified. The research region's northern and eastern regions have shallower basement relief, with depths of only approximately 100 m, and those depths show that the area is rootless. Conversely, the basement relief and surface depths are lower in the study region's western and southern regions. The routes taken by the ascending hydrothermal fluids can be seen as aeromagnetic lineaments at the hydrothermal alteration zones. Mineralization appears to be linked to structural lineaments, as evidenced by airborne magnetic data. For gold prospecting, the aeromagnetic technique seems to be the most effective and efficient geophysical method because gold is typically found in severely deformed shear zones and faults.
Keywords
Magnetic data
Structural trends
Alteration zones
Gold mineralization
Dungash
Central Eastern Desert

1 Introduction
Aeromagnetic data is used in mineral exploration for a variety of tasks, such as mapping porphyry gold/copper deposits, detecting intrusions and shear zones, and locating high-potential areas of giant sulfide deposits. Recent studies conducted by researchers from all over the world support the use of different geophysical techniques in mineral exploration and the significance of aeromagnetic techniques in locating metals and ore deposits. This is accomplished through the detection of subsurface mineralization zones and lineaments that play a significant role in the formation and deposition of precious metals. Structural mapping can be helpful in identifying zones of ore mineralization that are regulated by the underlying geological structures (Elkhateeb and Abdellatif, 2018). Mineral-bearing zones may be linked to lithological connections and/or structural characteristics (Saleh et al., 2018). To find geological subsurface structures such structural contacts, faults, shear zones, which can affect ore deposit mineralization and contribute to the exploration of minerals. The magnetic method is widely considered the most effective geophysical approach (Saleh et al., 2018; Abuelnaga et al., 2020; Mohamed and Al Deep, 2021; Mohamed et al., 2022a). Hinze et al. (2013), and Saleh et al. (2018) have all used aeromagnetic data to outline subsurface structural features and locate mineralization zones. Moreover, magnetic data can also be applied to regional studies, such as geothermal gradient and heat flow analyses (Mohamed and Al Deep, 2021; Mohamed et al., 2022b). Furthermore, magnetic data can be used to investigate the subsurface and structural elements that affect groundwater availability (Mohamed et al., 2022c). Magnetic field data, which can characterize geologic formations and porphyry intrusions, is the most reliable data for this purpose. Several research have been conducted to improve the ability to identify structural characteristics and porphyry intrusions from aeromagnetic data (Core et al., 2009). Existing fast and cheap technologies are supplemented by geophysical surveys to find subsurface objects and prioritize drill targets (Haldar, 2018). By combining ASTER data, geochemical data, and fieldwork, researchers were able to identify three different alteration zones in connection to the gabbro-diorite, ultramafites, and metavolcanics (areas 1, 2, and 3) as potential for gold mineralization in the studied area (Salem et al., 2016). The modeling shows that mixing boninitic melt produced by the melt/peridotite reaction with unreacted primary forearc basalt ascending in dunite conduits can precipitate approximately 1 g of monomineralic Cr-spinel/8.3 kg of melt flux. This Cr-spinel would have chemical properties similar to those seen in the Hagar Dungash chromitite pods (Moussa et al., 2022). In the Eastern Desert, various new locations have been discovered that may contain gold, specifically in alteration and shear zones like those in El-Barramiya, Abu Marawat, and El Beida. It is required to conduct a thorough investigation of these zones of alteration in order to locate gold mineralization. It is necessary to interpret high-resolution airborne data in order to identify prospective rocks, zones, and structures that might act as hosts for mineral resources. The probable relationship between alteration zones and commercially valuable mineral resources such as gold, silver, molybdenite, and nickel has increased the significance of alteration zone mapping. Based on the frequency analysis of the magnetic field, several methods have been developed to define variables such as the position of boundaries, the detection of alteration zones, and the detection of magnetic structures caused by magnetic minerals that generate anomalies in the magnetic field. The total horizontal gradient method is one of the techniques used to identify contacts and faults using magnetic anomaly data. Analytic signal, first vertical derivative, and tilt derivative are additional methods for determining the edges of magnetic sources, locations of source boundaries, and structural lineaments affected by the presence of mineral deposits. By detecting various magnetic properties of rocks, the analysis of aeromagnetic data utilizing derivatives approaches aims to provide a circumstantial method for observing the subsurface. The center for exploration targeting (CET) and Porphyry Analysis technique are used to detect structures and preferred mineralization zones. The airborne magnetic technique described in this paper has been utilized extensively in the mineral exploration industry, primarily for the identification of mineral and metal resources. The magnetic approach examines subterranean structures based on variations in the earth's magnetic field caused by the magnetic properties of the underlying rocks.
This is done to reveal hidden tectonic features that are essential for solid mineral deposits in the subsurface. Consequently, these techniques are frequently used to evaluate data from aeromagnetic anomalies in order to collect crucial details for mineral exploration.
The primary objective of this study is to locate probable shear zones, hydrothermal alteration zones, and structural lineaments for mineral exploration in the Dungash region using airborne magnetic data.
2 Geologic setting
Dungash El-Muweilha lies about 50 km southwest of Marsa Alam in Egypt's Eastern Desert. Longitudes 33° 40′ E, and 33° 57′ 30′′ E, and latitudes 24° 50′ N, and 25° 00′ N, define the area (Fig. 1). The Neoproterozoic shield rocks of the western portion of the Central Eastern Desert are dominated by dismembered ophiolites, a tectonic mélange of allochthonous serpentinite blocks incorporated and intermixed with an intensely deformed pelitic and calcareous schists, locally with intercalations of quartzite and black marble bands (El Gaby et al., 1990).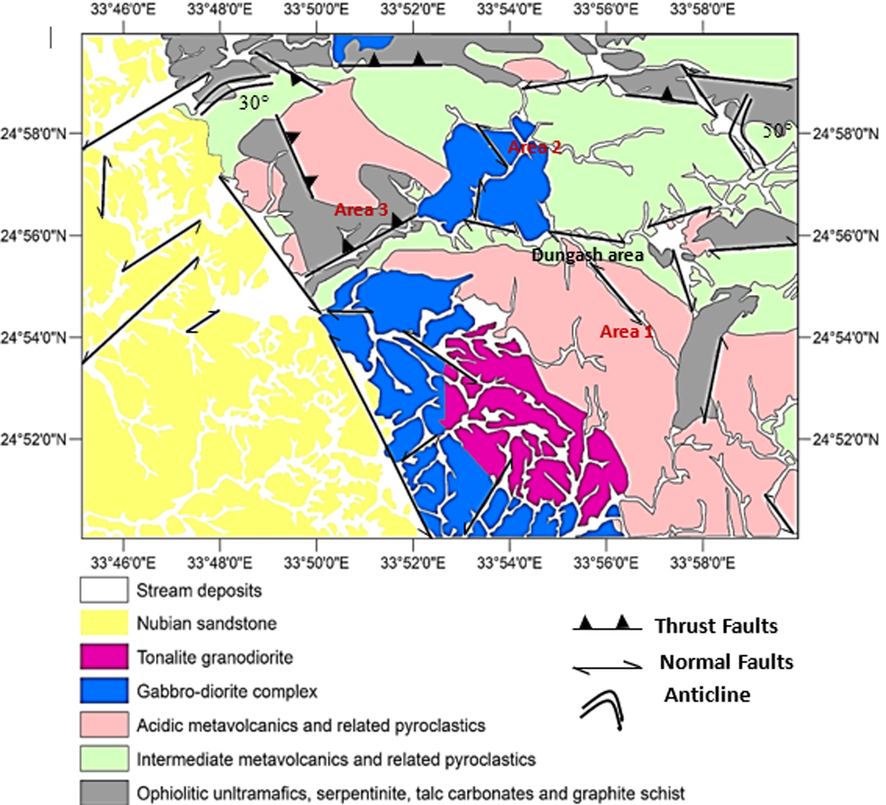
Geological map of Dungash district after Salem et al., (2016) and EGSMA (Wadi Ghadir map, 1996).
The Dungash area's basement rocks are part of a tectonostratigraphic succession of low-grade metamorphic ophiolitic-mélange rocks. According to Khalid et al. (1987), the Dungash region is made up of several various types of rocks, such as serpentinite, talc carbonate rocks, metagabbro, metavolcanic, and metasedimentary rock exposures, as well as older granitoid rock exposures. El Gaby et al. (1990) mentioned that the ophiolites are serpentinized ultramafic, metagabbro, and pillow basalt rocks are buried in calcareous and locally carbonaceous metasediments in the Dungash mélange rocks. According to Salem et al. (1996) and the Egyptian Geological Survey and Mining Authority (EGSMA; wadi Ghadir map, 1996) as shown in Fig. 1, the area comprises variety of rock units including ophiolitic ultramafic rocks, serpentinite, talc carbonate, talc graphite schist, acidic and intermediate metavolcanics, gabbro-diorite complex, tonalite-granodiorite, and Nubian sandstone rocks with serpentinites connected to highly sheared metasomatized talc-carbonate rocks, tremolite-actinolite schist, and listvenite rocks mixed with and thrusted over back-arc volcanic and volcaniclastic rocks characterized the area. The intermediate-acidic metavolcanics are intruded by gabbro-diorite plutons and tonalite-granodiorite rocks. Different rock types are sliced through by acidic dykes, granitic sheets, and quartz veins. In the northeastern part of the area (Fig. 1), gabbroic rocks cut metasediments, intermediate to acid metavolcanic, and metapyroclastic rocks, whilst gabbrodiorite rocks cut ophiolitic ultramafic rocks, serpentinite, talc carbonate, and graphite schist. The region is distinguished by landmarks such as Dungash gold mine and wadi Dungash.
Subduction-related tonalite granodiorite rocks intruded the area. At the westernmost point of Dungash El-Muweilha area, the Campanian-aged Taref and Quseir formations overlay unconformably the ophiolitic mélange rocks. Regional metamorphism and deformation under semiductile conditions produced the EW shear zone, which is connected with the primary contacts between rock units in the Dungash region (Kassem and Abd El Rahim, 2014). The deposit is thought to be an auriferous quartz vein system cutting through andesitic metavolcaniclastic rocks with calc-alkaline affinity. There were many different deformational phases that took place in this region, which led to the formation of several structures. Some of these structures include uplifts and folds in ultramafic rocks that run in the NW-SE and NE-SW directions, the generation of parallel sheets that trend NW-SE and dip SW, and thrusting over metavolcanics (Zoheir and Weihed, 2014). There are also several vein-type gold resources in the Dungash region, which are restricted to the island arcs heterogeneously deformed metavolcanic rocks (Botros, 2004).
3 Methodology
The total intensity magnetic data (raw data; Fig. 3a) was taken from the Egyptian Geological Survey sheets 70 and 71, which covered the Dungash area in Egypt's central Eastern Desert at a scale of 1:500,000. The American Western Geophysical Company's Aero Service Division (1984) conducted the aeromagnetic survey with the EGSMA and EGPC with a 91 m interval. The RTP was obtained by applying the IGRF correction to the TMI map (inclination = 32.8 North, declination = 1.9 East, and magnetic field strength = 42425) in order to eliminate anomaly asymmetry and resolve the complexity of the magnetic anomalies to delineate structural trends and reposition the magnetic anomalies above the causal magnetic. The RTP grid has been subjected to the CET grid analysis, CET porphyry analysis techniques, and a number of techniques and filters, including power spectrum (PS), Tilt derivative (TDR), analytical signal (AS), First Vertical Derivative (FVD), Downward continuation (DC), Total horizontal gradient (THG) method, High Pass, and Low Pass (Fig. 2), to identify shallow and regional structural controlling the mineralization zones.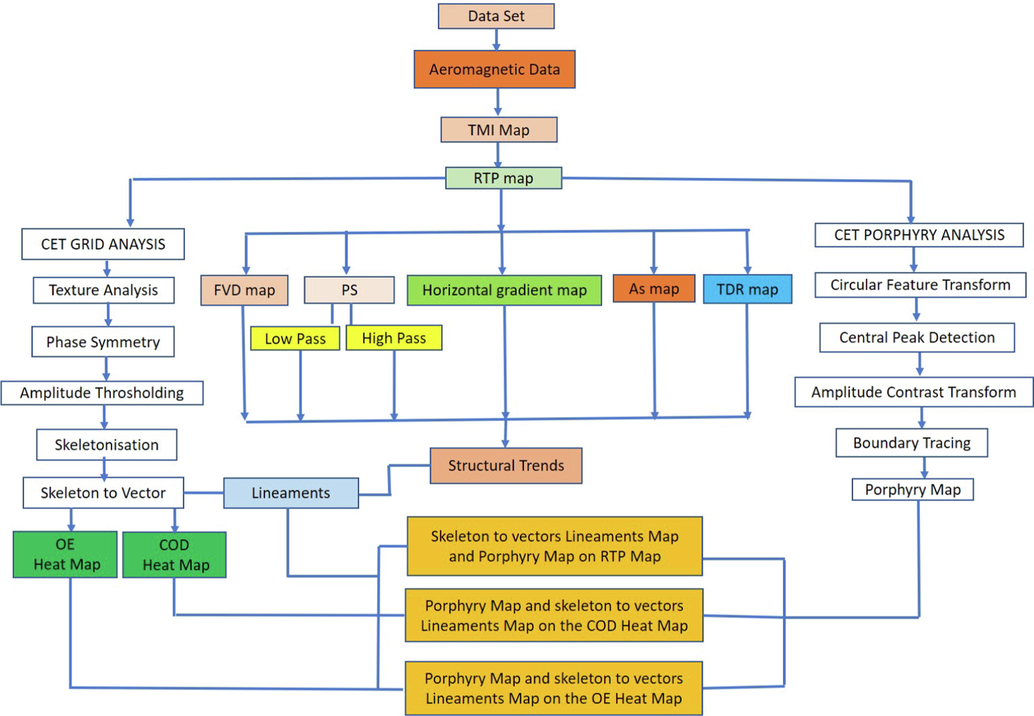
Study's methodology flowchart.
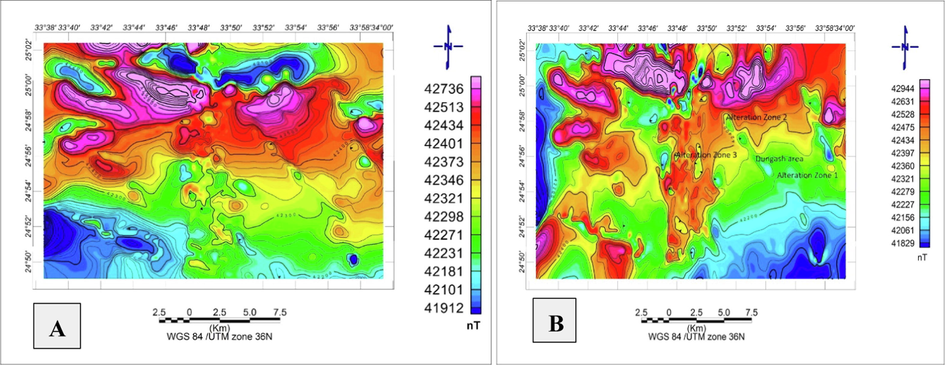
(A) The research area's TMI aeromagnetic anomaly map, (B) RTP aeromagnetic anomaly map.
3.1 PS method
Bhattacharyya (1966) established the theory of the spectrum analysis technique. Many scientists employ this technique to measure the depth of magnetic sources (Spector and Grant, 1970). Using the Spector and Grant equation, an application of power spectrum analysis is used to figure out the depth of the magnetic source bodies (Eq. (1).
This method is completely dependent on the wavelength analysis of anomalies and is immune to the directional properties of the sources' magnetization and the geomagnetic field, allowing it to be utilized for analyses at a wide range of depths simply by changing the data analysis window. We can see that our strategy is less vulnerable to big wavenumber noise and overlapping anomalies than earlier approaches.
3.2 TDR method
Because derivatives can enhance short wavelengths (increasing local anomalies) and designate the edge of the causal body, they are often employed methods in the processing of magnetic data (Hinze et al., 2013).
Geophysical technology known as TDR filter is frequently used to map subsurface features for mineral exploration (Saada, 2015). This technique is distinguished by its ability to highlight characteristics and track the edges of causal magnetic entities that are defined as lineaments (Marwan and Yahia, 2017). The TDR is represented by Eq. (2):
The vertical derivative is denoted by VDR, and the total horizontal gradient is denoted by THG. The TDR method (Miller and Singh, 1994) has been modified to place more focus on lineaments positioned at the source's boundaries than on the zero-value region found there. On this map, positive values are pushed away from magnetic sources and placed on top of them. Because the edges that were discovered have disappeared, the TDR map cannot be used in deep sources. The top contact depth is equal to the horizontal distance between the 45 and 0 tilt angle points. The main advantage of the TDR technique is that, unlike other systems, it does not rely on higher-order derivatives, making it less noise-sensitive.
3.3 Analytical signal (AS) method
The AS method enables a semi-automatic estimation of the depth as well as the position of bodies that are creating magnetic anomalies. This method is particularly beneficial for identifying underlying structural characteristics using gravity and magnetic data (Macleod et al., 1993). Numerous investigations have also employed this technique to estimate the depth of magnetic source bodies.
3.4 FVD method
The lengthy waveforms of the magnetic field created by the buried causative body can be removed using FVD (Keating, 1995). The FVD improved the image by revealing important structural and lithological elements that were not visible in the TMI and RTP maps.
3.5 HGM method
The HGM is an important tool for determining the locations of the magnetic structures that affect mineralization and the depth of the basement relief. Instead of first vertical derivatives, this method relies on the two first-order horizontal derivatives of the domain (Nassreddine and Haydar, 2001). HGM can be calculated using the following Eq. (3):
3.6 DC method
The downward continuation of the magnetic field allows geophysical specialists to imagine what the magnetic field could look like if it were measured at the causative source. Whenever the magnetic field is reduced, anomalies become more noticeable. With more waves, the impacts are stronger. Wavenumber anomalies with the highest wavenumbers are frequently connected to nearby bodies or noise. It is only natural to want to eliminate minor anomalies so that you can notice the consequences of the declining trend on the larger ones.
3.7 Magnetic field separation
It is customary to begin by removing or attenuating unwanted field components to locate the desired anomaly utilizing enhanced maps of magnetic data (e.g., residual-regional separations). The best residual/regional separation approach will pass just the anomalies that are vitally important to the research without distorting them, while rejecting all other major and minor components of the found anomalies. High-pass and low-pass filtering techniques are used to discriminate between the regional (Low Pass) and residual (High Pass) components. The regional component is connected to deep-seated sources, while the residual component is connected to local sources. The high and low pass filters are applied here as edge detection filters according to Eqs. (4) and (5):
3.8 The CET grid and porphyry analysis technique
Several researchers have employed the CET technique, which combines multiple statistical techniques to produce a contact occurrence density map, including texture analysis, lineation delineation, vectorization, and complexity analysis (Core et al., 2009). According to Holden et al. (2011), the CET Porphyry Analysis Extension includes the Circular Feature Transform, Central Peak Detection, Amplitude Contrast Transform, and Boundary Tracing plugins. Here, the optimal deposit-occurrence zones are determined using structural complexity (Holden et al 2010). In this work, the linear features included inside the magnetic grids are first discovered using the CET technique. Subsequently, the complexity of the local structures is investigated by looking at the spatial interactions between the linear features that are next to one another. To generate density heat maps, the spatial correlations between the newly discovered lineaments are analyzed.
4 Results and discussion
The RTP map's results show a strong positive correlation with the study area's existing geologic map, it depicts a range of magnetic properties that correspond to variations in the lithology, mineral, and ferromagnetic material concentrations of the research area. The magnetic field values range from 41,829 nT in the southeastern and western parts to 42,944 nT in the northern, northeastern, and central parts. The positive anomalies are oriented NE-SW and NW-SE, while the negative anomalies are oriented NE-SW and N-S. (Fig. 3b). Some hydrothermal solutions prefer to flow through the faults and fractures zone due to the structural contact between sedimentary rocks and ophiolitic serpentinite and other rocks in the Dungash area. Mineralization, such as gold, likes to form at contacts with low and quiet magnetism (Griffis et al., 2022). The RTP map can show where low and high magnetic anomalies intersect. Because magnetite, pyroxene, and amphibole are more abundant in serpentinite, gabbro-diorite, gabbroic, and intermediate metavolcanic rocks, they have higher magnetic susceptibilities. As a result of their low iron concentration, tonalite-granodiorite rocks, acidic metavolcanic rocks, and Nubian sandstone rocks had low magnetic susceptibilities. Several alteration zones are found here, and these alteration zones correspond to the three alteration zones discovered by Salem et al. (2016) using ASTER data. Where they explored three alteration zones and referred to them as area 1, area 2, and area 3 (Fig. 1).
To determine the 2D power spectrum (Fig. 4), the RTP map was subjected to the fast Fourier transformation (FFT) (Green and Stanley, 1975). The findings revealed a power spectrum curve with three distinct sections: regional, residual, and Nyquist. The slope of the tangent of each line, which was 55.73 m for shallow and 238.8 m for deep, can be used to calculate the average depth for each section. The amplitudes of deep-seated magnetic components fall anywhere between 0 and 0.6 cycles/grid unit, while the frequencies of shallow-seated magnetic components fall anywhere between 0.8 and 2.2 cycles/grid unit.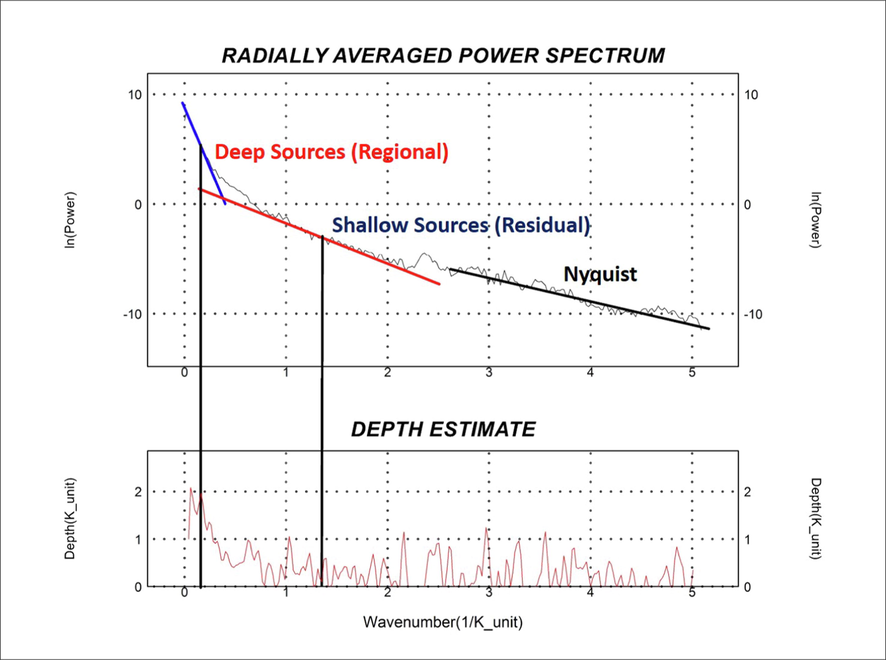
Magnetic data's 2-D radially averaged power spectrum.
A high-pass and low-pass filter with a cut-off wavelength of 0.0001 cycle/unit is used with the RTP map. More details regarding the interactions between the different magnetic rock types, including faults and folds, are revealed by this map, particularly at the surface level. High magnetic feature locations in the residual map and their effects on the RTP map are fairly constant. The results suggest that three superficial structural features represented by linear anomalies extend in three directions: NE-SW, NW-SE, and E-W, according to a high-pass analysis (Fig. 5a). Multiple local abnormalities of diverse shapes are surrounded by linear anomalies in the research area (elongated and circular). Based on the geological map, strike-slip faults and transgressed thrust faults are often associated with major irregularities in the study area. Negative anomalies in the western and southern parts of the research area could be caused by the extension of sedimentary layers in those places. Low-pass data show that regional structures extend in three directions: NW-SE, NE-SW, and E-W, indicating the depth of the underlying structures induced by these anomalies (Fig. 5b). The low-pass filter detects the persistence of the positive large-scale circular anomalies and their sharpening with depth. The locations of the high magnetic features are well matched to the locations of the corresponding features on the residual and RTP maps, indicating that the causative magnetic bodies of these features have deep roots but shallow depths. Additionally, the locations of the large positive magnetic anomalies are concentrated in the northern part of both maps and may be related to the serpentinite rocks and metavolcanic rocks. The negative magnetic anomalies in the western part and the southwest part in two maps may be also connected with the low magnetic mineral content. These maps' resulting anomalies match those of TDR and FVD maps.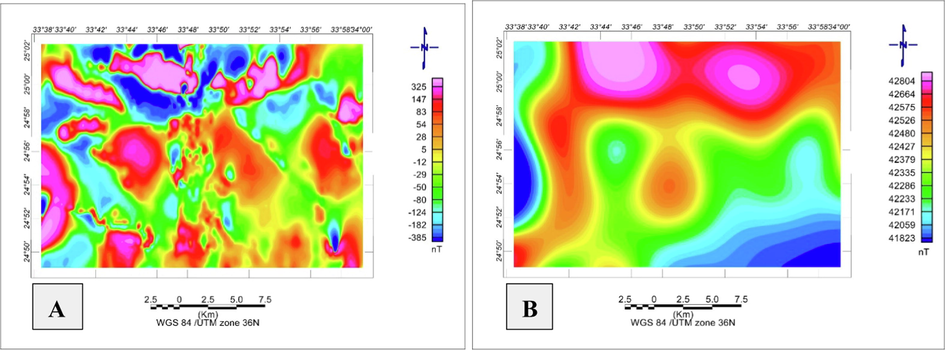
(A) A high-pass magnetic filter map; (B) Low-pass magnetic filter map of the research area.
The contacts between the ophiolitic serpentinite rocks, acidic metavolcanics, intermediate metavolcanics, and other rock groups in the area result in many shear zones in the research area, which practically stretch in the NW-SE direction as shown in the derivative maps (Fig. 6a,b & Fig. 7a,b). These shear zones roughly stretch in the NW-SE trend, which is linked to the Najd fault system, and this sort of structure is in charge of most of the mineralization in the Eastern Desert, as seen on the maps.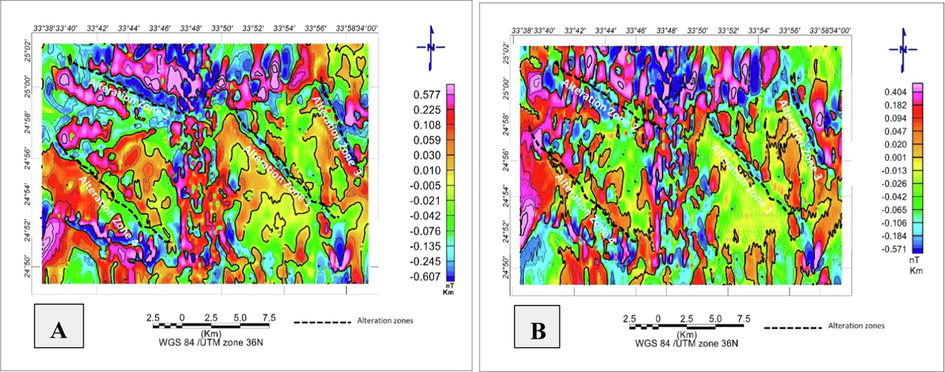
(A) First vertical derivative map; (B) Total horizontal gradient aeromagnetic anomaly map of the study region.
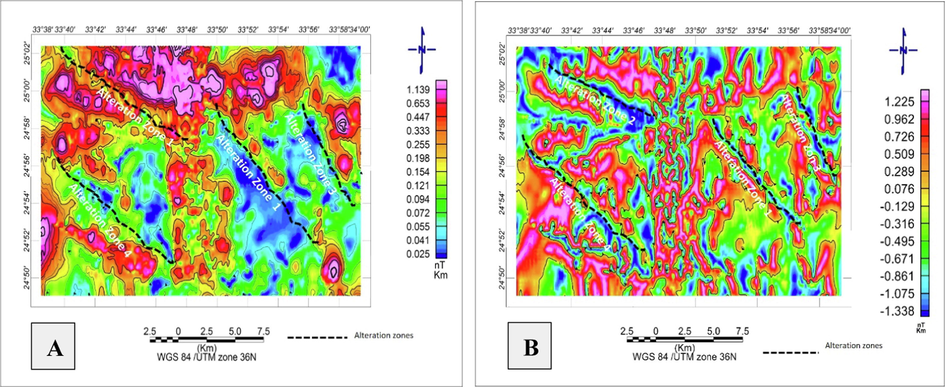
(A) Analytical signal map deduced from RTP map. (B) TDR aeromagnetic anomaly map of the investigated area.
The zero lines of TDR and FVD maps often sharpen the positions of magnetic source contacts and edges as well as keep track of shallow geological structures, enabling the identification of potential mineralized areas (Salem et al., 2007). The FVD map highlights near-surface lineament characteristics including shear zones, contacts, dykes, and faults. Magnetic anomalies can be seen in both the NE-SW and NW-SE orientations, with magnitudes varying between –0.607 and +0.577 nT/Km (Fig. 6a). Strong magnitudes are observed in the northern part of the region, which may be caused by ophiolitic ultramafic rocks, which include metavolcanic rocks. These characteristics appeared to be structurally controlled as well. The calc-alkaline dioritic rocks are related to the intermediate rocks. The low magnetic anomalies relate to Nubian sandstone rocks and tonalite-granodiorite rocks. The high magnetic anomalies are anticipated to be associated with near-surface mineralized bodies and/or high magnetic susceptibility rock units (such as serpentinite and metavolcanics). The FVD map can be used to determine structural characteristics such as contacts, faults, and shear zones (Fig. 6a). As a result, this method is helpful for obtaining structural lineament characteristics. Here, the NW-SE four alteration zones are all easily discernible.
The TDR filter separates the geologic characteristics, which may be related to mineral exploration or shallow structural lineaments (Fig. 7b). The zero-contour line is used to delineate the rock units, faults, and contacts on the TDR map (Fig. 7b), and it can show the contacts between the low magnetic anomalies, which are represented by sedimentary rocks (Nubian sandstone), tonalite-granodiorite, and acidic metavolcanic rocks demonstrates that the magnitude of high and positive anomalies ranges from 1.225 to −1.338 nT/Km, that practically all of the anomalies are positive, and that magnetic anomalies are only presented on rare occasions. As shown in the figure, the area features numerous shear zones that virtually extend in a NW-SE direction and are consistent with shear zones on other maps. The four shear zones can be seen on the maps and are compatible with previous approaches. It is obvious that the mineralized areas are near the zero contour lines on the TDR and FVD maps as well as in areas with significant magnetic anomalies.
The magnitude of magnetic anomalies on the AS map ranges from 0.025 to 1.139 nT/km (Fig. 7a). The AS values for ophiolitic serpentinite, gabbro-diorite, and intermediate metavolcanic rocks were greater; on the other hand, the AS values for tonalite-granodiorite, acidic metavolcanic, and sedimentary rocks were lower.
According to Grauch and Cordell (1987) the HGM map (Fig. 6b) is also useful for locating faults with vertical extension. The HGM approach is used on the RTP grid (Fig. 6b) to identify the magnetic body contacts. Anomalies range in magnitude from 0.404 to −0.571 nT/Km and extend in both the N-S and NW-SE directions. The horizontal gradient magnitude map (Fig. 6b) displays high gradient values (pink) with an amplitude peak of 0.404 nT/Km, which could be a sign of magnetic properties. The high values have variable amplitudes and shapes. On the HGM map, anomalies of the linear high amplitude gradient may be detected. These anomalies are linked to a number of structural and lithological phenomena that can be discovered in the study area, such as shear zones, faults, and dykes that can be both surface- and subsurface-located. The main tectonic trends affecting the research region are N-S and NNE-SSW, according to a statistical analysis of the structures observed. The main pathways for hydrothermal fluids are believed to be these structural tendencies.
Three distinct downward continuation maps, with a depth range of 100 to 200 m, were created using the DC filter (Fig. 8a, b). This kind of filtering makes it possible to see the boundaries between regions with different densities. The highest wavenumber abnormalities, nevertheless, are often linked to noise or extremely shallow substances. The generated maps were diverse, with different shapes, sizes, and gradient anomalies on each one. The amplitude of the anomaly is determined by the causative body, whereas the depth of the anomaly is determined by the susceptibility contrast. At a depth of 100 m, the anomalies deform, indicating that the basement rocks are located close to the surface, and as you go deeper to 200 m, the distortion increases.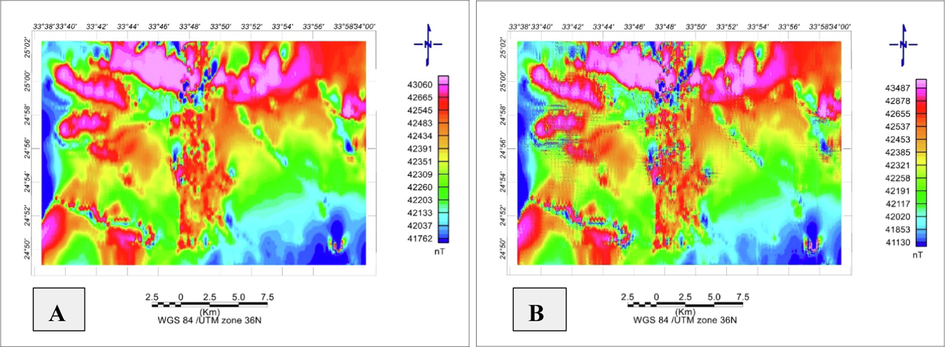
(A) The downward continued magnetic map of the study region (d = 150 m). (B) The downward continued magnetic map of the studied area (d = 200 m).
The magnetic intensity variations and the contacts within the potential field data are shown by the CET grid analysis approach. The phase symmetry map was created by transforming the RTP magnetic data to a standard deviation grid. It is critical in locating magnetic discontinuities, such as faults and dykes structures, in the investigated area (positive polarity features only considered here). Phase symmetry is important in increasing the appearance of the linear feature, making it easier to map and trace the main trends and lineation. The straight-line features are represented as Vectorization lineaments map, which is then superimposed on the phase symmetry map (Fig. 9). The Vectorization lineaments map indicates that the principal shear zones extend in the NW-SE direction.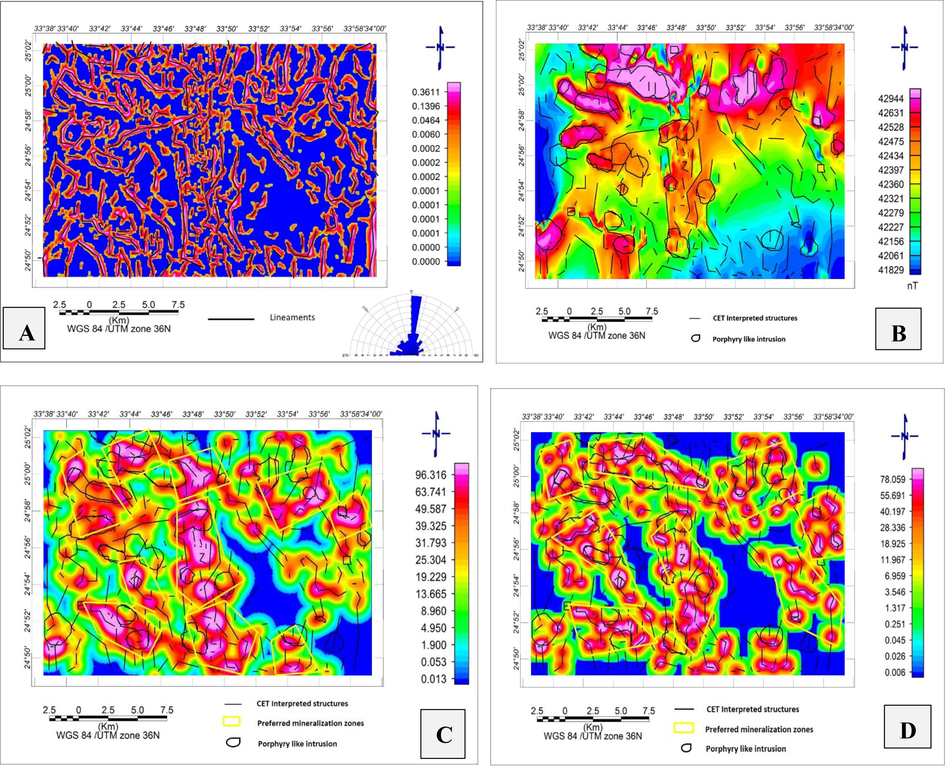
(A) Vectorised lineament map Superimposed on phase symmetry map. Insert showing rose diagram. (B) Circular Boundary Porphyry tracing and skeleton to vectors lineaments are superimposed on the research area's map. (C) The Circular Boundary Porphyry tracing and skeleton to vectors lineaments are overlaid on the heat density map. (D) Circular Boundary Porphyry tracing and skeleton to vectors lineaments are superimposed on the orientation entropy map of the study area.
The Symmetry detection method could be used to investigate the preferred mineralized zones. The prospect of new areas exploration is recognized by structural tendencies in the CET grid technique rose diagram which are generally N-S, NNE – SSW, NNW-SSE, E-W, NW-SE, and NE – SW (Fig. 9a). Also, because gold and other deposits like to precipitate in quiet magnetization areas, the separated borders of the changed rock blocks could be suitable zones for mineralization. Finally, we constructed an occurrence density map and an orientation entropy map. The contact occurrence heat density map indicates areas with a high density of structural connections. These contacts consist of the intersections and junctions of a number of different structures, as well as areas where there are significant changes in the orientation of structures. The map also shows the potential areas for hosting deposits, which are indicated by the red colour (Fig. 9c). The Orientation Entropy heat map reveals places where structures can be found in a variety of orientations, indicating potential structural complexity (Fig. 9c).
The porphyry deposits were discovered using a number of methods in this investigation, the first of which was the finding of circular characteristics for the detection of ore deposits. Following that, amplitude contrast transforms are used, followed by boundary tracing, which is superimposed on the COD and OE heat maps of the research region, and advantageous deposition zones are identified (Fig. 9c, d). Both the CET grid and the porphyry research produced heat maps of structural complexity that matched these features. NW-SE and NE-SW are the major orientations of the deposits. The possibility of increased ore deposition in the research zone is concentrated in the northwest, northeast, and central portions of the research area, as illustrated on the map (Fig. 9c, d). The ones traced with FVD, TDR, HGM, and AS reveal the link between the expected structural complexity zones. These places correspond to a northwest-southeast oriented sequence of deposits.
With most of the defined zones having strong RTP signatures being intercepted or surrounded by the extracted linear structures, there is a positive correlation between the lineaments extracted from the CET technique and RTP results. There is also a positive correlation between the delineated porphyry mineral deposits occurring and the extracted linear structures (Fig. 9b). These results demonstrate that throughout the examined area, the fault system controls the distribution and occurrence of porphyry mineral deposits.
As a general starting point, we can see that shear zones and faults control mineralization in the study area, particularly in the Mubarek-Hamash block (NEE) imparted by foliation and shear zones, which is considered one of the most important gold occurrences in the structural blocks of the Eastern Desert. The datasets, which comprise ophiolitic serpentinite, gabbroic rocks, metagabbro, talc carbonate metadiorite, and metasediments yielded crucial information (lithology and geological characteristics). Aeromagnetic data is useful for identifying subsurface structural trends and shear zones that are most likely to be linked to mineralization zones in the investigated district. Aeromagnetic measurements help identify geological limitations and structures that could be commercially important. The first vertical derivative in grey colour, analytic signal, and tilt derivative were used to boost the magnetic data. These advancements aided in the detection of faults and cracks that hydrothermal fluid will flow through (deposits). The CET approach was useful in identifying mineralization hotspots and identifying potential exploration sites.
The key tectonic changes influencing the Dungash area are visualized using trend analysis of magnetic fields and their derivatives in our work. These tectonic trends depict the compressional and tensional stress forces that occurred during the appraisal of the area at various geologic ages. The studied area is part of Stern and Hedge's (1985) central-eastern desert tectonic domain, as well as Greiling et al east–west's trending domain (1994). Major folding affects the majority of the basement rock units encountered in the Dungash area, with the exception of granitic intrusions. Major and minor faults exist in the area; the major faults are represented by thrust faults and strike-slip faults, which regulate the wades in the area. In the field of magnetic research, lineaments play an important role in giving an idea about fractures, faults, and shear zones so that it is possible that we have additional information regarding the factors that have affected this region in the past. The Dungash mine area is most likely affected by a lateral strike-slip fault and thrust fault. The resulted rose diagrams figure almost give the same results, along with the CET lineaments, subsurface structural lineaments were traced using Gay's (1972) concepts from the AS map, FVD map, TDR map, HGM map, HP map, and LP map (Fig. 10). The N-S, NW-SE, NE-SW, and E-W orientations are the most important for mineralization in the research region. According to Dourgham et al. (2008), the Dungash area subjected to tectonic event, as a result different structures including folds and uplifts with NW-SE and NE-SW trending axes were generated, and followed by NE-SW, NW-SE, NNW-SSE, and E-W faults and shear zones in metavolcanics. According to Marten (1986), the deposit is a system of auriferous quartz veins cutting through andesitic metavolcaniclastic rocks with calc-alkaline affinity. Actually, the alteration and shear zones of the Eastern Desert offer significant prospects for new gold deposits (For instance, El Beida, Abu Marawat, and El-Barramiya). To search for gold mineralization, these alteration zones need to be carefully examined (Dourgham et al., 2017).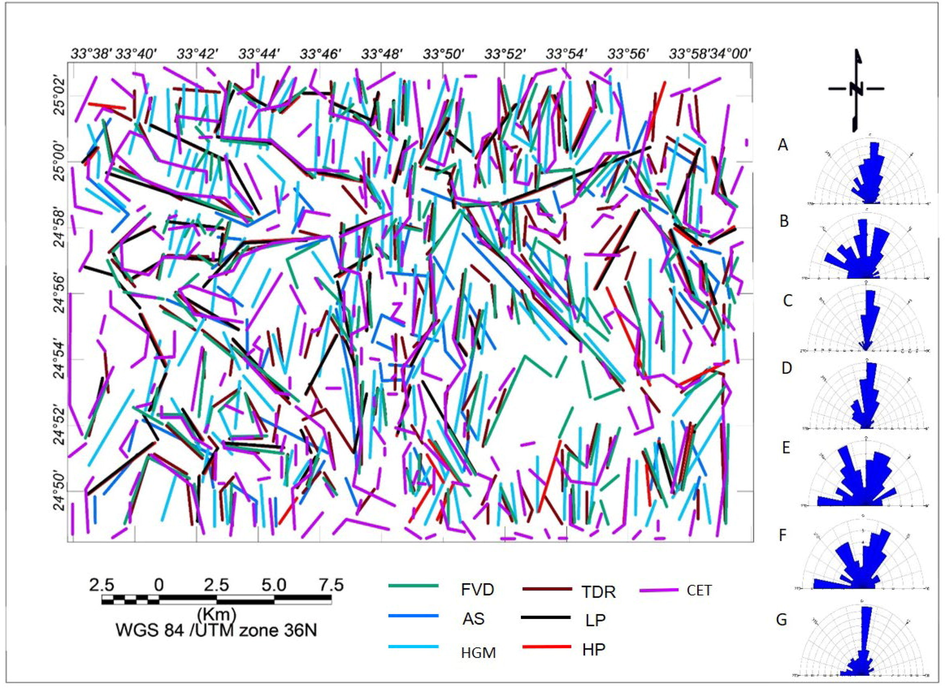
A map displays the subsurface lineaments that correspond to the research area's faults, dykes, and shears. The major and minor trends of the subsurface lineaments derived from the A) FVD, B) AS, C) HGM, D) TDR, E) LP, and F) HP and HGM Map are displayed in the insert exhibiting rose diagrams A-E.
Salem et al., 2016 used ASTER data to identify three shear zones and labelled them as area 1, area 2, and area 3. Area 1 is about 4 km SE of the Dungash mine and stretches E-W in altred metaandesite dacites, Area 2 is almost 6 km NE of the Dungash mine in quartz hornblende gabbro-diorite, and Area 3 is NNW of the Dungash mine. Our findings from geophysical and remote sensing data are consistent with past geological research. Magnetic data extending in the NW-SE detects more than an alteration zone as shown on magnetic maps above which are concordant with previous geological work.
5 Conclusion
The depth and location of the buried source, as well as underlying geological features and structural trends affecting the study region, are investigated using quantitative and qualitative analysis approaches. Among the techniques utilized are CET grid analysis, PS, DC, FVD, TDR, THG, TDR, HP, LP, and AS. These approaches' results are integrated to enable mapping the area's interpreted basement tectonic map easier. CET grid analysis yielded a large number of lineaments. Major faults, shears, and intrusives (dykes of various ages and extensions) are all found. The lineaments and alteration zones determined from other maps and the geology of the area generally trend N-S, NNE – SSW, NNW-SSE, E-W, NW-SE, and NE – SW directions, and these results accord with the lineaments and alteration zones deduced from other maps and the geology of the area. These widespread structural elements are probably the best places to look for potential gold resources. The porphyry mineral deposits are mostly found in the NW-SE, NE-SW, and E-W directions, with the NW, NE, and central parts of the research region being the most abundant. The positive correlation between CET deduced lineaments, porphyry mineral deposits, RTP results, and other lineaments produced from FVD, AS, THG, LP, and HP maps confirms the value of geophysical techniques in mineral exploration by detecting structure and alteration zones that control mineralization. The most frequent hosts for hydrothermal alteration zones in the study area are serpentinites in contact with acidic and intermediate metavolcanics and with other rock units which include tonalite-granodiorite and gabbro-diorite complex. The alteration zones found here using aeromagnetic data are consistent with earlier research. The current analysis revealed that a number of alteration zones and associated mineral resources are linked to the discovered structural elements and geological affinities, as well as the precision and significance of the aeromagnetic technique in mineral exploration.
Acknowledgments
This research was supported by Researchers Supporting Project number (RSP2023R496), King Saud University, Riyadh, Saudi Arabia.
Declaration of Competing Interest
The authors declare that they have no known competing financial interests or personal relationships that could have appeared to influence the work reported in this paper.
References
- Delineating flood hazards using the interpreted structural setting and GIS in Attaif, western Saudi. Arabia.. 2020;13(5):1-18.
- [Google Scholar]
- Aero-Service, 1984. Final operational report of airborne magnetic/radiation survey in the Eastern Desert, Egypt. For the Egyptian General Petroleum Corporation (EGPC) and the Egyptian Geological Survey and Mining Authority (EGSMA), Aero-Service Division Houston, Texas.
- Continuous spectrum of the total-magnetic-field anomaly due to a rectangular prismatic body. Geophysics. 1966;31(1):97-121.
- [Google Scholar]
- A new classification of the gold deposits of Egypt. Ore Geol. Rev.. 2004;25(1–2):1-37.
- [Google Scholar]
- Core, D., et al., 2009. Detailed structural analysis of magnetic data—done quickly and objectively.
- Petrology, mineralogy, geochemistry and fluid inclusions of the Dungash gold deposit, South Eastern Desert, Egypt. Egypt Mineral 2008
- [Google Scholar]
- Ore minerals and geochemical characterization of the Dungash gold deposit, South Eastern Desert, Egypt. Arab. J. Geosci.. 2017;10(6):145.
- [Google Scholar]
- EGSMA, 1996. Geologic Map of Wadi Ghadir Quadrangle, Egypt, Scale 1:100 000. Egyptian Geological Survey and Mining Authority Cairo Egypt.
- The basement complex of the Eastern Desert and Sinai. In: The Geology of Egypt. Routledge; 1990. p. :175-184.
- [Google Scholar]
- Delineation potential gold mineralization zones in a part of Central Eastern Desert, Egypt using Airborne Magnetic and Radiometric data. NRIAG J. Astron. Geophys.. 2018;7(2):361-376.
- [Google Scholar]
- Fundamental Characteristics of Aeromagnetic Lineaments: Their Geological Significance, and Their Significance to Geology. American Stereo Map Company; 1972.
- Limitations of determining density or magnetic boundaries from the horizontal gradient of gravity or pseudogravity data. Geophysics. 1987;52(1):118-121.
- [Google Scholar]
- Application of a Hilbert transform method to the interpretation of surface-vehicle magnetic data. Geophys. Prospect.. 1975;23(1):18-27.
- [Google Scholar]
- Griffis, J., et al., 2002. Gold deposits of Ghana prepared on behalf of Ghana mineral commission. 432.
- Mineral Exploration: Principles and Applications (2nd Edition). Amsterdam: Elsevier; 2018. p. :378.
- Gravity and Magnetic Exploration: Principles, Practices, and Applications. Cambridge University Press; 2013.
- Automatic identification of responses from porphyry intrusive systems within magnetic data using image analysis. J. Appl. Geophys.. 2011;74(4):255-262.
- [Google Scholar]
- Holden, E., et al., 2010. Detection of Regions of Structural Complexity within Aeromagnetic Data Using Image Analysis. Twenty Fifth International Conference of Image and Vision Computing, New Zealand.
- Finite strain analysis of metavolcanics and metapyroclastics in gold-bearing shear zone of the Dungash area, Central Eastern Desert, Egypt. Geotectonics. 2014;48(6):483-495.
- [Google Scholar]
- A simple technique to identify magnetic anomalies due to kimberlite pipes. Explor. Min. Geol.. 1995;4(2):121-125.
- [Google Scholar]
- Khalid, A., El Naggar, A., Bakhit, H., 1987. Results of Detailed Gold Exploration Work on Dungash Area (Internal report Geological Survey of Egypt, Cairo, Egypt).
- 3-D analytic signal in the interpretation of total magnetic field data at low magnetic latitudes. Explorat. Geophys.. 1993;24(4):679-688.
- [Google Scholar]
- Marten, B., 1986. Reconnaissance of the gold deposits of the Eastern Desert of Egypt. Parts I and II. Minerals International Ltd., Exploration Department, New Bury, 1–44.
- Using the aeromagnetic data for mapping the basement depth and contact locations, at southern part of Tihamah region, western Yemen. Egypt J. Pet. 2017
- [CrossRef] [Google Scholar]
- Potential field tilt—a new concept for location of potential field sources. J. Appl. Geophys.. 1994;32(2–3):213-217.
- [Google Scholar]
- Detection of Mineralization Zones Using Aeromagnetic Data. Appl. Sci.. 2022;12:9078.
- [CrossRef] [Google Scholar]
- Depth to the bottom of the magnetic layer, crustal thickness, and heat flow in Africa: Inferences from gravity and magnetic data. J. Afr. Earth Sci.. 2021;179:104204
- [CrossRef] [Google Scholar]
- Geometry of the magma chamber and curie point depth beneath Hawaii island: Inferences from magnetic and gravity data. Front. Earth Sci.. 2022;10:847984
- [CrossRef] [Google Scholar]
- Integrated geophysical assessment of ground-water potential in southwestern Saudi Arabia. Front. Earth Sci.. 2022;10:937402
- [CrossRef] [Google Scholar]
- Multistage petrogenetic evolution of Neoproterozoic serpentinized ultramafic rocks and podiform chromitites at Hagar Dungash. Eastern Desert of Egypt.. 2022;369:106507
- [Google Scholar]
- Nassreddine, B., Haydar, A.J.A.D.G., 2001. Interpretation of magnetic anomalies using the horizontal gradient analytical signal. 44: 505–526.
- Edge detection and depth estimation from magnetic data of wadi Araba, eastern desert-Egypt. IOSR J. Appl. Geol. Geophys. (IOSR-JAGG). 2015;3(6):33-45.
- [Google Scholar]
- Subsurface structural features of the basement complex and mineralization zone investigation in the Barramiya area. Eastern Desert of Egypt, using magnetic and gravity data analysis. Arabian J. Geosci.. 2018;11(21):1-14.
- [Google Scholar]
- Tilt-depth method: A simple depth estimation method using first-order magnetic derivatives. Lead. Edge. 2007;26(12):1502-1505.
- [Google Scholar]
- Exploration of gold occurrences in alteration zones at Dungash district, Southeastern Desert of Egypt using ASTER data and geochemical analyses. J. Afr. Earth Sci.. 2016;117:389-400.
- [Google Scholar]
- Statistical models for interpreting aeromagnetic data. Geophysics. 1970;35(2):293-302.
- [Google Scholar]
- Geochronologic and isotopic constraints on late Precambrian crustal evolution in the Eastern Desert of Egypt. Am. J. Sci.. 1985;285(2):97-127.
- [Google Scholar]
- Greenstone-hosted lode-gold mineralization at Dungash mine, Eastern Desert, Egypt. J. African Earth Sci.. 2014;99:165-187.
- [Google Scholar]


