

Translate this page into:
Geomagnetic micro-pulsation automatic detection via deep leaning approach guided with discrete wavelet transform
⁎Corresponding author at: National Research Institute of Astronomy and Gessophysics, Department of Seismology, Helwan, Cairo, Egypt. aligamal@ltlab.com (Ali G. Hafez),
-
Received: ,
Accepted: ,
This article was originally published by Elsevier and was migrated to Scientific Scholar after the change of Publisher.
Peer review under responsibility of King Saud University.
Abstract
Ultra-low frequency (ULF) signals in the geomagnetic records are important indicators for many phenomena; therefore identification of such signals is an important issue. Automatic identification of these ULF signals is not an easy target because of their small magnitudes. Through this study in hand, two algorithms are proposed to automatically detect these micro-pulsations. The first algorithm uses the multi-level components (details) of the discrete wavelet transform (DWT) instead of the original geomagnetic record. The vector of the maximum values of the cross-correlation between the record and an arbitrary chosen ULF pattern in the same frequency range is a good indicator for the existence of these micro-pulsations. The second algorithm is based on convolutional neural network (CNN) framework guided with the multi-resolution-analysis (MRA) of the DWT. Preprocessing the geomagnetic records using the MRA of DWT to produce the fifth and the sixth details to be the input to the deep CNN topology, highly improved the accuracy to approach 91.11%. In addition, deep learning based algorithm showed better results than the DWT based algorithm in light of all the performance metrics.
Keywords
Ultra-low frequency signals
MAGDAS
DWT
MRA
CNN
Deep learning
Geomagnetic records

1 Introduction
Geomagnetic micro-pulsation or the so called ultra-low frequency signals are waves in the magnetic field of the Earth with different frequencies and may last for several minutes (Jacobs et al., 1970). They are generated by various mechanisms (Takahashi and Anderson, 1992; Borovsky and Valdivia, 2018), their existence affects the electrons and ions in the radiation belt and they intervene between the ion plasma sheet, solar wind and the electro-ion radiation belts, their generation and propagation are associated with many physical phenomena in the magnetosphere. Borovsky and Denton (2014) showed that the indices of the ULF signals are cross-correlated with the solar wind, its driver function and the geomagnetic indices. Mean values of the fluctuations in the relativistic electron flux and all these geomagnetic indices are measures of latitude current intensity (AE, AL, AU and Polar Cap Index (PCI)) (Kozyreva et al., 2007) and (Romanova et al., 2007). The inner magnetosphere plasma pressure (Dst, Dst*) and the magnetosphere convection strength (kp, index of midnight boundary) are affecting the indices of the ULF signals as well, (Singh et al., 2013; Romanova and Pilipenko, 2009). Kozyreva et al. (2007)) demonstrated that the micro-pulsation (ULF) index is related to the outer electron radiation belt. Additionally, the ULF pulsations have effective role in the inner magnetosphere within the geomagnetic storms, 2Murphy et al. (2018) estimated mode, periods and the number of azimuthal wave of the micro-pulsations within the evolution high speed solar wind (HSS) and the moderate storms as well.
Shi et al. (2018) used data of 6 s resolution extracted from super Dual Auroral Rader Network (SuperDARN), radars in the high-mid latitudes to make a survey on ionospheric ULF (PC3-5) signature such as the time of maximum and minimum values (day, night) effects on continuous pulsation.
Therefore identification of these ULF waves is an important issue for a good understanding, monitoring and modeling of the space physics. Manually achieving this identification is not an easy task and consumes time because these waves have small magnitudes and occur in limited durations. In addition, this monitoring is done for multiple of stations to confirm the existence of the ULF waves. In light of that, this article introduces two models for automatic identification of ULF waves. First algorithm is based on multi-level resolution (MRA), specifically the details, of the discrete wavelet transform (DWT). The second algorithm uses deep convolutional neural network (CNN) framework where data input had been preprocessed using DWT.
MRA of DWT had been used in the analysis of geomagnetic data for many purposes such as; determination of geomagnetic sudden commencements (Hafez et al., 2013a,b). Nose et al. (1998) and Nose (1999) had used wavelets in detection of Pi2 micro-pulsation. Deep learning technique is recently one of the powerful techniques in machine learning (Jürgen, 2015). Deep learning is a nonlinear technique that encodes the input into multiple processing layers representing data with multiple stages of abstraction. CNN is one of the most used layers in deep learning due to its ability to extract significant features from the input time series, allowing the classifier to improve the performance (LeCun et al., 2015). Deep learning is widely used in different aspects, e.g., natural language processing (Jian et al., 2020), speech recognition (Zhang et al., 2018), automatic navigation systems (Robail et al., 2019), parallel computations (Ben-Nun and Hoefler, 2019), image processing (Razzak et al., 2018), and geophysics (Saad and Chen, 2020a, 2020b; Saad et al., 2020, 2018). However, for the best of our knowledge, deep learning is the first time to be proposed for geomagnetic micro-pulsation classification.
2 DWT and its MRA
Daubechies, (Daubechies, 1992); introduced wavelet transform using different width-filters, called wavelet filter. These filters enabled making very precise time scaled frequency sub-bands which led to highlight anomalies within the recorded time trace. This technique clarifies these anomalies even those with small magnitudes by detecting them in their specific frequency ranges, i.e. it could detect very small signals which cannot be recognized in the initial time series because of other dominant large frequencies. This technique is implemented by using the coefficients of the DWT in calculation of the MRA bands versus time. Every MRA band represents the selected frequency band in the specified time duration. Fig. 1, shows the pyramid algorithm introduced by (Percival and Walden, 2000), where the wavelet and scaling filters are used in calculating the wavelet and scaling coefficients, respectively, for each scale, which represents the frequency range.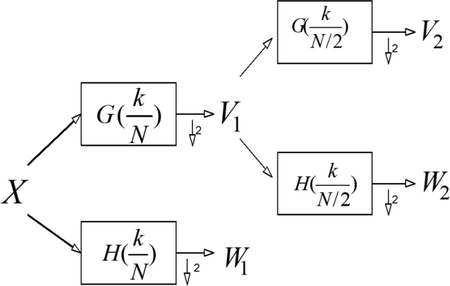
Wavelet and scaling coefficients using pyramid algorithm.
X, is the input time series, the wavelet and scaling filters for the first and second stages are and , and respectively. The outputs from these filters are V1, W1, V2, W2, which represent scaling and wavelet coefficients for the first and second stages, respectively. These coefficients are then used to calculate the time domain component for the selected frequency band. High frequency component at each stage is calculated from the corresponding wavelet coefficients and the low frequency component is calculated from the scaling coefficients. The calculations for this pyramid algorithm and MRA technique can be found in (Hafez et al., 2010). The frequency ranges, f, for each stage can be calculated from the following equation, , j is the stage number, F is the nyquist rate.
3 Data set
The used geomagnetic records are extracted from ground based magnetometers belong to MAGDAS network (the Magnetic Data Acquisition System), (Yumoto et al., 2006). The selected records are daily H-comp from January 2007 to December 2007, sampled at one sample per second. The timing of the micro-pulsations occurred in the selected dataset had been gathered from (http://www.icswse.kyushu-u.ac.jp/gaikyo/index.html) and listed in an excel sheet in the supplementary data. Micro-pulsations (including Pi2, Pc3 and Pc4) had been found in the period of the selected records. This excel sheet is used for developing, validation and testing of the developed models. This dataset had been used by (Elgiddawy et al., 2020), where, the geomagnetic and geographic locations of the six magnetometers can be found as well; Davao (DAV) in Philippine, in South Africa, Hermanus (HER), in Brazil Santa Maria (SMA), in Italy, L’Aquila (LAQ), Magadan (MGD) in Russia, and in Canada, Wadena (WAD).
4 Decomposition of geomagnetic record with MRA
Applying the MRA sub-banding on the one sample per second resolution geomagnetic records, it can be found that the MRA of these records will represent the different types of the ULF waves. Fig. 2, represents one example for the effectiveness of this sub-banding, where one day ground magnetometer recording at DAV station. Six detail components and the approximation of this record have been calculated as shown in the left column of Fig. 2. In this day eight Pi2 pulsations had been declared (http://www.icswse.kyushu-u.ac.jp/gaikyo/index.html), the first one is at 6:30 am. The windows around this timing are enlarged for the initial time series and the MRA components in the right side column of Fig. 2. The sixth detail (7.8 to 15.6 mHz) is the best component which distinguishes this pulsation from the background noise. This observation is confirmed by (Jacobs et al., 1970), where he identified the frequency ranges for each of the micro-pulsations as shown in Table 1. From this table we can expect the detail which corresponds to the specific micro-pulsation. This means that the amplitudes of the details will point to the existence of the corresponding micro-pulsation. Other pulsations such as Pc3 or Pc4 can be well identified in their corresponding frequency ranges as shown in the third and fourth columns of Fig. 2.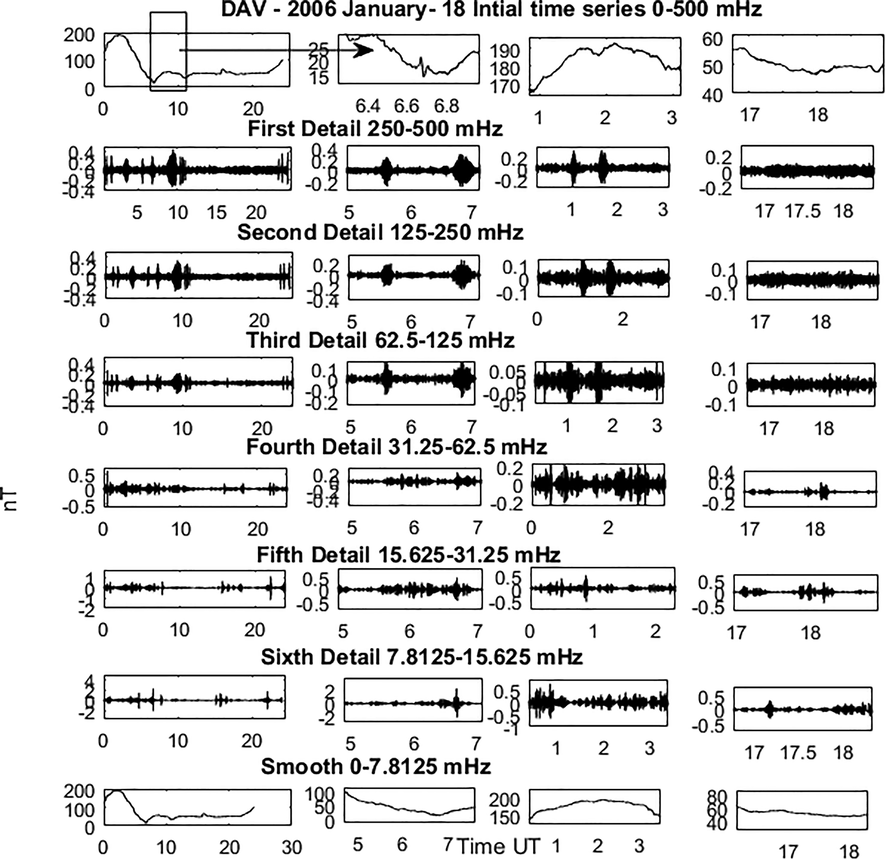
One day record at DAV station, January 18th 2006. The original time series, six DWT details and the smooth components are plotted in the left side column. The enlarged windows around 6:30 am for these MRA components are in the right side column.
Micro-pulsation
Frequency Range (mHz)
Continuous
Pc1
200–500
Pc2
100–200
Pc3
22–100
Pc4
7–22
Pc5
2–7
Irregular
Pi1
25–1000
Pi2
2–25
4.1 DWT based algorithm
The proposed algorithm uses the previous MRA decomposition in extracting the sixth detail (D6) which has proven the best tracking in monitoring the existence of the micro-pulsation signals. This sixth detail is calculated for an arbitrary chosen ULF segment which will be assigned as the micro-pulsation pattern (Pm). This pattern is then cross-correlated with the sixth detail of the geomagnetic records of the data set. The cross-correlation (RPm,D6) (Stoica, 2005) is calculated by using a moving window over each record then the maximum value of the cross-correlation (Cmax = max(RPm,D6)) is determined. Cmax defines the similarity between the chosen pattern and the examined record, which can be considered as a powerful tool to indicate whether this interval contains a micro-pulsation or not. A threshold had been set to the Cmax, above which a micro-pulsation is declared. Fig. 3, is a block diagram for the DWT-based algorithm.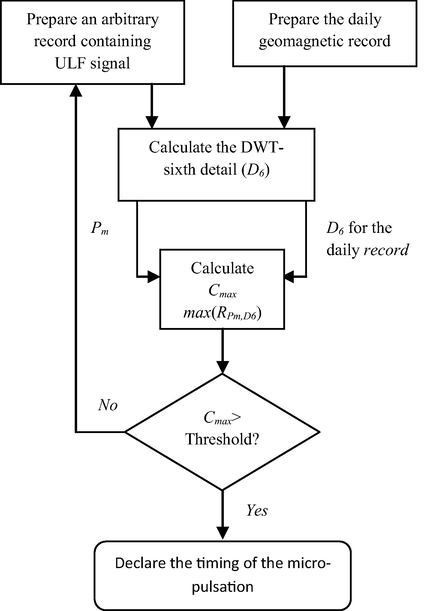
Block diagram for the proposed DWT-based algorithm.
Fig. 4, highlights two cases where there will be high cross-correlation, in the left side column of the figure, between the sixth detail (D6) and the used pattern (Pm). The right side column of Fig. 4, shows a window of the geomagnetic record where there will be low cross-correlation. Different segments containing micro-pulsations and noise segments had been used to determine the threshold above which a micro-pulsation will be declared as shown in the plotted Cmax in Fig. 4.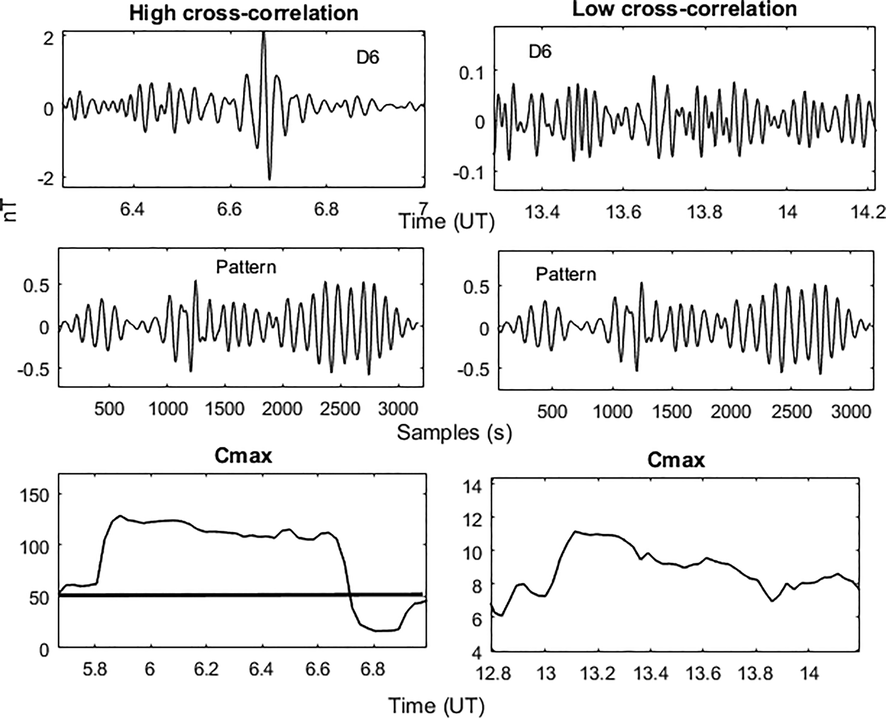
High and low cross-correlation cases between D6 and Pm.
4.2 DWT based algorithm results
The DWT-based algorithm had been applied on the dataset where the outcomes of this model can be either positive or negative decisions. The positive possibilities are either successfully declaring that the micro-pulsation segment exist or not, Tp or Tn, respectively. The negative decisions, where the algorithm gives a wrong decision for either the micro-pulsation segment exist or not, Fp or Fn, respectively. The false decisions are due to other anomalies in the geomagnetic record. Counting these four possibilities then, precision (Pr), recall (rc), F-value and accuracy (Acc) can be determined as follows:
Out of 1194 geomagnetic records, (597 pulsations and 597 noise segments); the values for the Tp, Tn, Fp and Fn are 685, 227, 90 and 192, respectively. Using these values in equations (1:4), the values of Pr, rc, F-value and Acc are 88.38%, 78.1%, 76.38%and, 82.92% respectively.
5 Deep learning based algorithm
We propose to use deep learning network to classify between the noise and the pulsation signals. Firstly, we divide the raw data into several windows, where each window contains 2,400 samples, i.e., 40 min where the sampling rate is one sample per second. Accordingly, during 2007, we use 597 pulsation segments and 597 noise segments for training and testing the proposed algorithm. The dataset is randomly split into 85% for training, and 15% for testing. Secondly, for each segment, the fifth and sixth detail components of the DWT are obtained to be the input of the proposed deep learning network, i.e., the input of the deep learning network has a shape of
. Thirdly, we use six identical blocks to extract significant features from the input data. Each block consists of several types of layers; convolutional, batch normalization, activation, maxpooling, and dropout. The convolutional layer extracts several significant feature maps using the following formula:
Then, a dropout layer (Jürgen, 2015) is utilized to avoid the over fitting problem with a rate of 0.1. Finally, maxpooling layer reduces the data dimension and allow the framework to extract more feature maps in the following blocks, which has an output as follows:
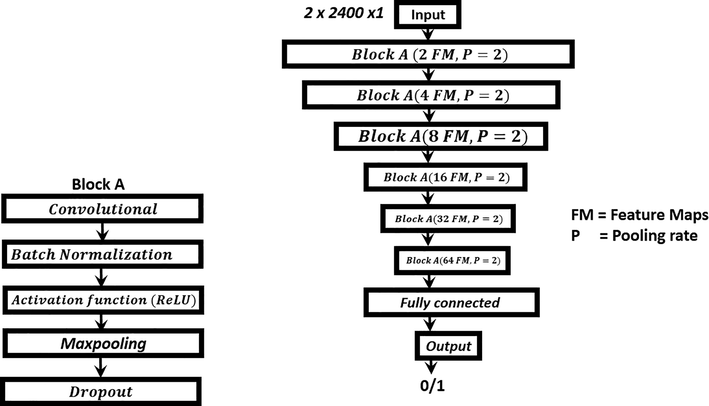
The proposed architecture framework of the deep learning network.
It is worth to highlight that the preprocessing of the initial data using MRA of the DWT to calculate the fifth and sixth details is a basic block in the proposed study. This preprocessing removed all unnecessary components from the original time series. The fifth and sixth components represent the ULF waves effectively as had been shown in Section 4. To test this step, the precision has been determined in both cases; in case the original records have been used to drive the framework input of the prescribed deep CNN architecture in the second case the fifth and sixth details where the input to the framework. The second case had showed much higher accuracy than the first case. This preprocessing proves the effect of using the MRA of the DWT as the perfect guide for the deep CNN topology.
5.1 Deep learning result
We use Adam optimizer (Kingma and Ba, 2014) with learning rate of 0.001 to determine the best parameters of the network. As a result, the proposed deep learning network reaches a training accuracy of 98.62% after 100 epochs, while the testing accuracy is 91.11%. To test the proposed algorithm performance, we obtain the confusion matrix as follows:
The positive class represents the pulsation and the negative class is the noise. Accordingly, the proposed algorithm precision, recall, and F- value are 97.95%, 87.27%, and 92.30%, respectively. For further check of the proposed algorithm, we use a k-fold cross-validation test. We split the dataset into K partitions, K-1 is used for training, then this training process is repeated K times, however, each time a different K-1 partition is used for training. The accuracy from all K tests are averaged, we set K to be 15. As a result, the average test accuracy is 89.84%. From these results, we can conclude that deep learning performs well in classifying the noise and pulsation signals, however, it needs more datasets to be used for training to have better performance.
Table 2, lists the performance measures for two proposed algorithms, DWT and deep learning based models. From this able it is clear that using DWT-guided deep learning model improves the identification performance for the micro-pulsations.
Performance measure
DWT based algorithm
Deep learning based algorithm
Precision (Pr)
88.38%
97.95%
Recall (rc)
78.1%
87.27%
F-value
82.92%
92.30%
Accuracy (Acc)
76.38%
91.11%
6 Conclusion
Through this article two algorithms have been proposed to automatically detect the ULF signals and distinguish them from background noise. The first algorithm is based on cross-correlating the sixth detail of both the geomagnetic record and an arbitrary chosen pulsation pattern. Performance metrics showed that this first algorithm can be used in the automatic identification of the ULF pulsations recorded at multi-station-network. The second algorithm is based on deep CNN framework driven by the MRA of the DWT as a preprocessing step. The fifth and sixth details of the DWT are chosen to drive the input to the deep CNN model which could successfully classify micro-pulsations from background noise from one magnetometer with 91.11% average accuracy.
Acknowledgements
The authors extend their appreciation to the Deanship of Scientific Research at King Saud University for funding this work through research group No. RGP-1436-011.
Declaration of Competing Interest
The authors declare that they have no known competing financial interests or personal relationships that could have appeared to influence the work reported in this paper.
References
- Demystifying parallel and distributed deep learning: an in-depth concurrency analysis. ACM Comput. Surveys (CSUR). 2019;52(4):1-43.
- [Google Scholar]
- Exploring the cross correlations and autocorrelations of the ULF indices and incorporating the ULF indices into the systems science of the solar wind-driven magnetosphere. J. Geophys. Res. Space Phys.. 2014;119:4307-4334.
- [CrossRef] [Google Scholar]
- Daubechies, I. 1992. Ten lectures on wavelets, SIAM pages 115, 132, 194, 242.
- The multi-optimized parameter technique for near online automatic determination of geomagnetic sudden commencement arrival time. Arab. J. Sci. Eng. 2020
- [CrossRef] [Google Scholar]
- GluonCV and GluonNLP: deep learning in computer vision and natural language processing. J. Machine Learn. Res.. 2020;21(23):1-7.
- [Google Scholar]
- Clear P-wave arrival of weak events and automatic onset determination using wavelet filter banks. Digital Signal Process. 2010;20(3):715-723.
- [Google Scholar]
- Systematic examination of the geomagnetic storm sudden commencement using multi resolution analysis. Adv. Space Res.. 2013;51(1):39-49.
- [Google Scholar]
- Un-decimated discrete wavelet transform based algorithm for extraction of geomagnetic storm sudden commencement onset of high resolution records. Comput. Geosci.. 2013;51:143-152.
- [Google Scholar]
- Sergey, Ioffe, Szegedy, Christian. Batch normalization: Accelerating deep network training by reducing internal covariate shift. arXiv preprint arXiv:1502.03167 (2015).
- Geomagnetic Micropulsations. New York, Heidelberg, Berlin: Springer-Verlag; 1970. p. :1-3.
- The Earth’s magnetosphere: a systems science overview and assessment. Surveys Geophys.. 2018;39:817-859.
- [Google Scholar]
- Kingma, Diederik P., Ba, Jimmy. Adam: A method for stochastic optimization. arXiv preprint arXiv:1412.6980 (2014).
- In search of a new ULF wave index: Comparison of Pc5 power with dynamics of geostationary relativistic electrons. Planet. Space Sci.. 2007;55:755.
- [Google Scholar]
- Determining the mode, frequency, and azimuthal wave number of ULF waves during a HSS and moderate geomagnetic storm. J. Geophys. Res. Space Phys.. 2018;123:6457-6477.
- [Google Scholar]
- Automated detection of Pi2 pulsations using wavelet analysis: 2. An application for dayside Pi 2 pulsation study. Earth Planets Space. 1999;51:23-32.
- [Google Scholar]
- Automated detection of Pi 2 pulsations using wavelet analysis: 1. Method and an application for substorm monitoring. Earth Planets Space. 1998;50:773-783.
- [Google Scholar]
- Wavelet Methods for Time Series Analysis. Cambridge: Cambridge University Press; 2000. p. :159-168. chapter 5
- Deep learning for medical image processing: Overview, challenges and the future. In: Classification in BioApps. Cham: Springer; 2018. p. :323-350.
- [Google Scholar]
- ULF wave indices to characterize the solar wind-magnetosphere interaction and relativistic electron dynamics. Acta Geophys.. 2009;57:158.
- [Google Scholar]
- ULF wave index and its possible applications in space physics. Bulg. J. Phys.. 2007;34:136.
- [Google Scholar]
- Deep learning approach for earthquake parameters classification in earthquake early warning system. IEEE Geosci. Rem. Sens. Lett. 2020
- [Google Scholar]
- Automatic waveform-based source-location imaging using deep learning extracted microseismic signals. Geophysics. 2020;85(6):1-104.
- [Google Scholar]
- Deep denoising autoencoder for seismic random noise attenuation. Geophysics. 2020;85(4):V367-V376.
- [Google Scholar]
- Automatic arrival time detection for earthquakes based on stacked denoising autoencoder. IEEE Geosci. Rem. Sens. Lett.. 2018;15(11):1687-1691.
- [Google Scholar]
- Survey of ionospheric Pc3–5 ULF wave signatures in SuperDARN high time resolution data. J. Geophys. Res. Space Phys.. 2018;123(5):4215-4231.
- [CrossRef] [Google Scholar]
- ULF wave index as magnetospheric and space-weather parameters. Adv. Space Res.. 2013;52:1427.
- [Google Scholar]
- Spectral, Analysis of Signals. Upper Saddle River, NJ: Prentice Hall; 2005.
- Distribution of ULF energy (f < 80 mHz) in the inner magnetosphere: a statistical analysis of AMPTE CCE magnetic field data. J. Geophys. Res.. 1992;97:10751-10773.
- [Google Scholar]
- RootNav 2.0: deep learning for automatic navigation of complex plant root architectures. GigaScience. 2019;8(11):giz123.
- [Google Scholar]
- Yumoto, K. and the MAGDAS group. 2006. MAGDAS project and its application for space weather, ILWS WORKSHOP 2006, GOA, Feb. 19–24.
- Deep learning for environmentally robust speech recognition: an overview of recent developments. ACM Trans. Intell. Syst. Technol. (TIST). 2018;9(5):1-28.
- [Google Scholar]
Appendix A
Supplementary data
Supplementary data to this article can be found online at https://doi.org/10.1016/j.jksus.2020.101263.
Appendix A
Supplementary data
The following are the Supplementary data to this article:


