

Translate this page into:
Genetic diversity and population structure of Kawakawa Euthynnus affinis (Cantor, 1849) in Malaysia and its surrounding waters inferred by mitochondrial DNA cytochrome oxidase I and cytochrome b genes
⁎Corresponding author. darlinamdn@usm.my (Darlina Md. Naim)
-
Received: ,
Accepted: ,
This article was originally published by Elsevier and was migrated to Scientific Scholar after the change of Publisher.
Abstract
Kawakawa (Euthynnus affinis) is a widely distributed epipelagic tuna, considered among the most economically significant species in the subtropical and tropical waters of the Indo-Pacific region. However, the lack of comprehensive information on the stock structure, management, and conservation of E. affinis populations in Malaysia raises concerns of potential overfishing and depletion of this marine fish. To ensure effective and successful species management, it is imperative to conduct a molecular- based assessment of the stock structure. In the present study, the genetic diversity and population structure of E. affinis in Malaysia and its surrounding waters were investigated using mitochondrial DNA cytochrome oxidase I (COI) and cytochrome b (Cyt b) genes. A total of 390 (COI) and 414 (Cyt b) individuals of E. affinis were sampled from 20 distinct locations situated within five geographic regions: the Straits of Malacca, South China Sea, Sulu Sea, Celebes Sea, and the Arabian Sea. The results revealed that the genetic divergence among 20 populations of E. affinis varied from low to high. The average haplotype diversity (Hd) and nucleotide diversity (π) for COI were calculated to be 0.5131 and 0.0043, respectively. On the other hand, the average haplotype diversity (Hd) and nucleotide diversity (π) for Cyt b were found to be 0.7450 and 0.0162, respectively. The analysis of haplotype distribution revealed that a total of 20 distinct haplotypes were identified for both the COI and Cyt b genes across 20 populations of E. affinis. The analysis of the Neighbor-Joining (NJ) tree and the Minimum Spanning Network (MSN) revealed the formation of three distinct clades among the samples. AMOVA analysis showed a significant genetic structure among the 20 populations of E. affinis, as indicated by the COI: FST = 0.5364 (P < 0.05) and Cyt b: FST = 0.9521 (P < 0.05). The neutrality test and mismatch distribution analysis indicated that the E. affinis specimens underwent a period of population expansion. This study marks a significant milestone as the first comprehensive documentation of genetic diversity and population structure of E. affinis across various locations in Malaysia, with an additional pioneering investigation conducted in the waters of Yemen.
Keywords
Euthynnus affinis
Genetic diversity
Mitochondrial DNA
COI
Cytb
Population structure

1 Introduction
The assessment of animal population distribution and genetic structure is of utmost importance in the formulation of effective conservation strategies, especially for species that have been subjected to excessive exploitation. This is crucial for maintaining the biodiversity of species and populations and safeguarding them from commercial exploitation (Turan et al., 2005; Ha et al., 2020). The concept of a “fish stock” refers to a group of individuals within a species that are randomly mated and exhibit temporal or geographic integrity. This concept is of particular interest in the context of species conservation, as highlighted by Ihssen et al. (1981). The stock structure of a species is defined by its geographic distribution and genetic composition. The recognition of species stock structure holds significant importance for a multitude of reasons. For example, this technology facilitates the discernment of multiple populations or subpopulations that may possess diverse ecological, genetic, or management needs, and holds significant value in the development of customised conservation and management strategies for distinct populations (Khan et al., 2012). Moreover, comprehending the stock structure of a species can indicate areas characterised by substantial genetic diversity, a crucial factor in the conservation of a species' long-term well-being and adaptability. The determination of the degree of relatedness and gene flow among different populations can be facilitated through the utilisation of stock structure data, in which this information provides a comprehensive assessment of the genetic health of a species (Cronin-Fine et al., 2013; El Mghazli et al., 2021).
Researchers have proposed various techniques to ascertain the presence of marine and freshwater fish stocks. The earlier mentioned techniques encompass morphometric techniques (Griffiths et al., 2017), geometric morphometrics (Mohammadi-sarpiri et al., 2021; Binashikhbubkr et al., 2022), meristic analysis (Gain et al., 2017), otolith shape analysis (Wujdi et al., 2022), and DNA analysis techniques, specifically focusing on mitochondrial genes (Johnson et al., 2016; Kasim et al., 2020; Jamaludin et al., 2022). The utilization of DNA coding has been widely employed in various fields such as forensics, population ecology, phylogenetics, and biodiversity research since the early 2000s (Hürkan, 2020). Specifically, the adoption of DNA coding techniques that are dependent on the COI and Cyt b genes present in mitochondrial DNA is crucial in the process of species identification, with a particular emphasis on fish species (Hebert et al., 2003). Furthermore, the conservation of the COI and Cyt b genes within the mitochondrial genome renders them indispensable for the classification and identification of diverse animal species (Hebert et al., 2010). Recent studies conducted on marine fish have provided evidence that the utilization of the COI and Cyt b genes can serve as an effective tools for species identification, population genetics analysis, and fisheries management (Kunal and Kumar, 2013; Halim et al., 2022).
Kawakawa, scientifically referred to as Euthynnus affinis, is a member of the Scombridae family and is widely recognized as a species of tuna. The species was initially documented by Cantor (1849), and it exhibits a wide distribution throughout the Indo-Pacific region, specifically in subtropical and tropical seas. Kawakawa holds considerable commercial importance within Malaysia and the adjacent seas. This species inhabits continental shelf seas and is renowned for its superior flesh, which is frequently employed in various dishes such as fresh cuisine, sashimi, and canned products (Masazurah et al., 2012). The Kawakawa populations in Malaysian waters, Indian Ocean, and Java Sea are subjected to pressure from overfishing and illegal, unreported, and unregulated fishing activities (Effarina et al., 2020; Mardlijah et al., 2022). Therefore, it is of utmost importance to implement effective surveillance and management strategies for these species to promote sustainable utilization of resources. Despite these challenges, Kawakawa continues to hold significant importance for the fishing industry and the local economy in Malaysia.
Mitochondrial DNA (mtDNA) has been employed in various prior studies conducted in Malaysia and adjacent seas to underscore the stock structure and genetic diversity of E. affinis. In a study conducted by Santos et al. (2010), DNA control region markers, specifically the D-loop, were employed to examine the genetic diversity of 35 E. affinis samples collected from the Philippines, as well as 13 samples from Peninsular Malaysia, specifically Pangkor Island and Penang Island. Similarly, the population structure of E. affinis in two states in Peninsular Malaysia (Perlis and Penang) was examined by Masazurah et al. (2012) using cytochrome b (cyt b) markers. The findings derived from the investigation indicate a dearth of comprehension regarding the stock structure of E. affinis, genetic diversity, and phylogenetic connections of the species in Malaysia and the adjacent waters. Thus, the results of this research hold significant implications for fisheries managers in devising suitable policies at both regional and international levels to effectively address the irreversible decline of the resource. Moreover, the results obtained from this study have the potential to contribute to the effective management and conservation strategies for the E. affinis population within Malaysian waters.
The objective of this study is to employ mitochondrial cytochrome oxidase I (COI) and Cyt b markers to examine the genetic diversity and population structure among 20 populations of E. affinis originating from Malaysia and the adjacent waters. This study represents the inaugural investigation employing the COI and Cyt b genes, thereby offering valuable insights into the genetic diversity and population structure of E. affinis within Malaysia and its adjacent waters.
2 Materials and methods
2.1 Ethical statement
Because only dead specimens were collected, there was no need for a permit, and ethical considerations were not necessary for this study. Furthermore, it's important to note that E. affinis is not included in the International Union for Conservation of Nature (IUCN) list of endangered or protected species.
2.2 Sampling and study area
The collection of specimens belonging to the species Euthynnus affinis was undertaken between November 2019 to September 2021. The collection encompassed a total of 20 distinct commercial fish landing sites. The samples were gathered from the landing sites pinpointed in the annual report by the (DoFM, 2021), which furnished details on the availability of fish at these areas. The aforementioned sites comprised a total of 11 landing sites located in Peninsular Malaysia, eight landing sites situated in Malaysian Borneo (specifically Sabah and Sarawak), and one landing site located in the Arabian Sea (Mukalla, Yemen). Samples were collected from five main geographical regions, specifically the Straits of Malacca, the South China Sea, the Sulu Sea, the Celebes Sea, and the Arabian Sea. In this study, samples of E. affinis were obtained from five distinct landing sites situated in the Straits of Malacca: Batu Maung (Penang), Lumut (Perak), Sungai Besar and Kuala Selangor (Selangor), and Kukup (Johor). In addition, a total of 10 landing sites have been designated in the South China Sea, namely Pasir Puteh and Tok Bali (Kelantan), Pulau Tenggol and Pantai Kijal (Terengganu), Kuantan (Pahang), Endau (Johor), Bintawa, Pulau Bruit, and Mukah (Sarawak), as well as Kota Kinabalu (Sabah), two landing sites from the Sulu Sea: Kudat and Sandakan (Sabah), two landing sites from the Celebes Sea: Lahad Datu and Tawau (Sabah). Inclusion of a landing site from the Arabian Sea (Mukalla - Yemen) in the sample collection was ultimately accomplished (Table 1, Fig. 1). All samples were morphologically identified and validated based on Collette and Nauen (1983). Distinguishing this particular species from other Thunnus species can be achieved through various identifying characteristics, including size, gill rakers, gill teeth, fins, vertebrae, and colouration (Collette and Nauen, 1983). The specimens collected in Malaysia were subsequently relocated to the Molecular Ecology Laboratory at Universiti Sains Malaysia's School of Biological Sciences. In order to enhance visibility, the fish samples underwent a process of rinsing with running water, gentle tapping, and subsequent placement on the left side of a flat surface featuring a black background. The examination and identification of samples collected from Mukalla was conducted in the Biological Laboratory at the Faculty of Science, Hadhramout University, Yemen. For each specimen obtained, a segment measuring approximately 1–2 cm from the right pectoral fin was excised and stored in 95 % ethanol for the purpose of DNA extraction. Note: Straits of Malacca (M), South China Sea (SCS), Sulu Sea (SS), Celebes Sea (CS), and Arabian Sea (AS).
Sampling locations
Coordinates
Marine region
N
COI
Cytb
Batu Maung, Penang (BM)
5° 16′ 60.00″ N; 100° 16′ 60.00″ E
M
24
23
Lumut, Perak (LUM)
4° 13′ 56.28″ N; 100° 37′ 47.28″ E
M
24
24
Sungai Besar, Selangor (SB)
3°39′50.4″N; 100059′16.6″E
M
14
14
Kuala Selangor, Selangor (KS)
3° 21′ 0.00″ N; 101° 15′ 0.00″ E
M
24
24
Kukup, Johor (KUK)
1° 18′ 60.00″ N; 103° 26′ 59.99″ E
M
12
15
Pasir Puteh, Kelantan (PP)
5° 49′ 58.28″N; 102° 24′ 19.02″E
SCS
18
18
Tok Bali, Kelantan (TB)
5°52′35.5″N; 102027′29.9″E
SCS
14
14
Pulau Tenggol,Terengganu (PT)
4° 47′ 59.99″ N; 103° 40′ 59.99″ E
SCS
21
21
Pantai Kijal, Terengganu (PK)
4°18′20.2″N; 103°28′57.2″E
SCS
6
8
Kuantan, Pahang (KUA)
3° 48′ 27.72″ N; 103° 19′ 33.60″ E
SCS
24
24
Endau, Johor (END)
2° 38′ 59.99″ N; 103° 36′ 59.99″ E
SCS
24
24
Bintawa, Sarawak (BIN)
1°33′50.96″N; 110°23′15.6″E
SCS
13
24
Pulau Bruit, Sarawak (PB)
2° 30′ 59.99″ N; 111° 25′ 59.99″ E
SCS
14
23
Mukah, Sarawak (MUK)
2° 53′ 45.5784′' N; 112° 6′ 13.4820′' E
SCS
24
24
Kota Kinabalu, Sabah (KK)
5° 58′ 29.64″ N; 116° 04′ 20.64″ E
SCS
24
24
Kudat, Sabah (KU)
6° 53′ 14.35″ N; 116° 49′ 25.10″ E
SS
24
24
Sandakan, Sabah (SAN)
5° 50′ 24.72″ N; 118° 07′ 4.44″ E
SS
20
20
Lahad Datu, Sabah (LD)
5° 01′ 36.48″ N; 118° 19′ 37.20″ E
CS
24
24
Tawau, Sabah (TA)
4° 14′ 41.35″ N; 117° 53′ 28.14″ E
CS
24
24
Mukalla, Yemen (M)
14.20–14.45ْ N; 48.50–49.40ْ E
AS
18
18
Total
390
414

Sampling locations of E. affinis specimens collected from the Straits of Malacca (M), South China Sea (SCS), Sulu Sea (SS), Celebes Sea (CS), and Arabian Sea (AS).
2.3 DNA extraction and polymerase chain reaction amplification
Total genomic DNA was extracted from the clipped fins following the Cetyl Trimethyl Ammonium Bromide (CTAB) extraction method (Bakar et al., 2018), with some modification on the amount of proteinase K to improve the standard of the isolated DNA. The DNA pellet was then cleaned and eluted with deionized water and visualized by electrophoresis in agarose gel (1.7 %) stained with ethidium bromide (EtBr). Utilizing a spectrophotometer Q3000 (Quawell, Korea), the DNA purity was evaluated and fixed at −20 °C until further utilization. Polymerase Chain Reaction (PCR) amplifications were carried out to amplify two mitochondrial genes: cytochrome oxidase I (COI) and Cyt b. The expected length of COI gene was 632 bp, and the primer sequences used for DNA amplification were FishF1 (5′TCAACCAACCACAAAGACATTGGCAC3′) and FishR1 (5′TAGACTTCTGGGTGGCCAAAGAATCA3′) (Ward et al., 2005). The expected length of Cyt b gene was 522 bp, and the primer sequences used were F (5′GCTCACTACTTGGCCTTTGC 3′) and R (5′TGGAGGCTAGGAGGGCTAGT 3′) (Terio et al., 2010). PCR amplification for both genes was conducted in 25 μL volume including 16.25 μL molecular grade water, 2.5 μL 10X PCR buffer, 2.0 μL MgCl2, 1.0 μL dNTPs, 0.5 μL of each primer (10 mM), 0.25 μL i- Taq (Intron, South Korea), and 2.0 μL DNA template. Gradients PCR were initially utilized to obtain the best annealing temperature using T100TM Thermal-cycler (BIORAD, USA). The PCR reaction was performed in a Major Cycler, CyCLER-25 (Major Science, USA). The temperature profile for the COI gene was: initial denaturation at 94 0C for 5 min followed by 35 cycles of 94 °C for 30 sec, annealing temperature 47.9 °C–48.5 °C for 50 sec, extension step 72 °C for 1 min, followed by a final extension at 72 °C for 7 min, and final hold at 4 °C. For the Cyt b gene, the temperature profile was as follows: initial denaturation at 94 °C for 5 min, followed by 35 cycles of 94 °C for 30 sec, annealing temperature ranging from 47.9 °C to 48.5 °C for 50 sec, extension step at 72 °C for 1 min, followed by a final extension at 72 °C for 7 min. The final step was a hold at 40 °C. PCR products were visualized in a 1.7 % agarose gel (Vivantis Sdn. Bhd.) and stained with EtBr to check for the presence of DNA. Using Intron Purification Kit (Intron, South Korea), PCR products were purified to confirm the results were unencumbered by adulterants or additional suppressors. The cleaned PCR products were then sent out to NHK Bioscience (Korea) for the sequencing process.
2.4 Data analysis
The sequences were processed using MEGA ver. 11 software (Tamura et al., 2021) for trimming and alignment, utilizing the ClustalW algorithm. The nucleotide composition was determined using MEGA ver. 11 (Tamura et al., 2021). The DNA sequences acquired were effectively identified through the utilization of the Basic Local Alignment Search Tool (BLAST) within the National Centre for Biotechnology Information (NCBI) database, which can be accessed at https://blast.ncbi.nlm.nih.gov/Blast.cgi. To assign specimens of E. affinis, similarity thresholds of more than 99 % were used. Intra and interpopulation pairwise genetic distances were computed using the Kimura 2-parameter (K2P) nucleotide substitution model, determined as the best model with the lowest Bayesian information criterion (BIC) score for both COI and Cyt b sequences. The estimates were computed using MEGA ver. 11 software. To analyse the genetic diversity, haplotype (Hd) and nucleotide diversity (π) were measured in DnaSP ver. 6.12 (Rozas et al., 2017). The phylogenetic tree reconstruction was conducted using the Neighbour Joining (NJ) tree method. The evolutionary relationships and variance between sequences were examined using the Kimura 2-parameter method. The analysis was performed using MEGA ver. 11 (Tamura et al., 2021). With 1000 replicates, the value of all phylogenetic nodes was estimated, and only bootstrap values >50 % are shown. In the phylogenetic analysis, the sequence of Lutjanus erythropterus (Accession no: GU673202.1) obtained from GenBank (https://blast.ncbi.nlm.nih.gov) was added as an outgroup. Furthermore, a sequence of E. affinis from GenBank (Accession no: KY371510.1) was also added to the analysis for species confirmation.
A minimum spanning network (MSN) was created using the median-joining method performed in PopART ver.1.7 (Leigh and Bryant, 2015) to infer the relationships among haplotypes. To estimate the population genetic structure of 20 E. affinis populations, an analysis of molecular variance (AMOVA) was conducted in Arlequin ver.3.5 (Excoffier and Lischer, 2010). The isolation by distance (IBD) or Mantel test was performed in Arlequin ver.3.5 (Excoffier and Lischer, 2010) to verify the correlation between genetic and geographical distances. Genetic distances were represented by population pairwise genetic distance values, meanwhile the geographical distances between populations were measured using the ruler tool in Google Earth. The neutrality test was conducted utilizing DnaSP version 6.12 (Rozas et al., 2017), which incorporates Tajima's D (Tajima, 1989) and Fu's Fs (Fu, 1997) analyses. Additionally, the mismatch distribution was computed using DnaSP ver. 6.12 (Rozas et al., 2017). Analysing the mismatch distribution pattern can provide insights into the population's past demographic changes (Chen et al., 2015). A unimodal distribution pattern indicates a population that has recently undergone expansion, whereas a multimodal distribution pattern suggests a population in equilibrium (Rogers and Harpending, 1992). The accession numbers OP595397 - OP595523 were utilized to deposit all sequences into the GenBank database.
3 Results
3.1 Sampling data
A total of 390 specimens of E. affinis were sequenced for the COI gene, while 414 specimens were sequenced for the Cyt b gene. The specimens were obtained from a total of 20 distinct locations situated within five primary geographic regions: the Straits of Malacca, South China Sea, Sulu Sea, Celebes Sea, and the Arabian Sea (as indicated in Table 1 and Fig. 1).
3.2 Genetic distance and genetic diversity
The amplification of DNA samples led to the successful production of fragments measuring 632 base pairs (bp) and 522 bp for the COI and Cyt b genes, respectively. The findings of this study demonstrate a 100 % success rate in amplification for both the COI and Cyt b genes. The genetic distance pertaining to both genes, both within and between 20 populations of E. affinis, is displayed in Tables 2 and 3. The intrapopulation genetic distance exhibited a range of values from 0.000 to 0.029, as determined through the examination of the COI gene. The population of TA demonstrated the highest level of intrapopulation genetic distance (0.029), whereas TB, PK, PT, SB, KS, KUK, SAN, and M exhibited the lowest intrapopulation genetic distance (0.000). Conversely, the interpopulation genetic distance exhibited a range spanning from 0.000 to 0.082. The interpopulation genetic distance between KUA and MUK was found to be the highest at 0.082. On the other hand, the interpopulation genetic distance between PK and TB; PT and TB; PK and SB; PK and KUK; TB and SAN; PT and KUK exhibited the lowest interpopulation genetic distance at 0.000 (Table 2). Upon conducting an analysis of the Cyt b gene, it was determined that the intrapopulation genetic distance exhibited a range spanning from 0.004 to 0.090 (Table 3). The PK population exhibited the greatest intrapopulation genetic distance, measuring 0.090, whereas MUK displayed the lowest intrapopulation genetic distance, measuring 0.004 %. On the other hand, the interpopulation genetic distance exhibited a range of values spanning from 0.012 to 0.383. The interpopulation genetic distance between M and BIN was determined to be the highest, with a value of 0.383. Conversely, KUA and MUK displayed the lowest interpopulation genetic distance, measuring 0.012 (Table 3). Overall, the genetic divergence among 20 populations of E. affinis from Malaysia and its adjacent waters varied from low to high. Note: Bold indicate intrapopulation values. Note: Bold indicate intrapopulation values.
PP
TB
PK
PT
SB
KS
KUK
SAN
LD
TA
KU
KK
BIN
PB
MUK
KUA
LUM
END
BM
M
PP
0.001
TB
0.001
0.000
PK
0.001
0.000
0.000
PT
0.001
0.000
0.000
0.000
SB
0.001
0.000
0.000
0.000
0.000
KS
0.002
0.003
0.003
0.003
0.003
0.000
KUK
0.001
0.000
0.000
0.000
0.000
0.003
0.000
SAN
0.001
0.000
0.000
0.000
0.000
0.003
0.000
0.000
LD
0.005
0.004
0.004
0.004
0.004
0.007
0.004
0.004
0.008
TA
0.022
0.021
0.021
0.021
0.021
0.025
0.021
0.021
0.024
0.029
KU
0.008
0.007
0.007
0.007
0.008
0.011
0.007
0.007
0.011
0.018
0.005
KK
0.021
0.020
0.020
0.020
0.020
0.024
0.020
0.020
0.023
0.030
0.017
0.009
BIN
0.028
0.027
0.027
0.027
0.027
0.031
0.027
0.027
0.033
0.044
0.032
0.051
0.014
PB
0.040
0.039
0.039
0.039
0.039
0.044
0.039
0.039
0.044
0.051
0.040
0.057
0.064
0.016
MUK
0.060
0.058
0.058
0.058
0.058
0.064
0.058
0.058
0.064
0.071
0.060
0.079
0.081
0.015
0.004
KUA
0.023
0.022
0.022
0.022
0.022
0.026
0.022
0.022
0.026
0.040
0.030
0.038
0.052
0.063
0.082
0.020
LUM
0.019
0.018
0.018
0.018
0.018
0.022
0.018
0.018
0.023
0.036
0.026
0.036
0.049
0.060
0.079
0.022
0.015
END
0.018
0.017
0.017
0.017
0.017
0.021
0.017
0.017
0.021
0.036
0.025
0.038
0.053
0.061
0.080
0.028
0.019
0.008
BM
0.014
0.016
0.016
0.016
0.016
0.013
0.016
0.016
0.020
0.048
0.025
0.038
0.048
0.059
0.079
0.046
0.039
0.041
0.013
M
0.002
0.002
0.002
0.002
0.002
0.003
0.002
0.002
0.005
0.024
0.009
0.023
0.029
0.043
0.064
0.025
0.021
0.020
0.017
0.000
PP
TB
PK
PT
SB
KS
KUK
SAN
LD
TA
KU
KK
BIN
PB
MUK
KUA
LUM
END
BM
M
PP
0.014
TB
0.024
0.035
PK
0.050
0.061
0.090
PT
0.065
0.073
0.087
0.089
SB
0.064
0.068
0.082
0.097
0.021
KS
0.080
0.085
0.103
0.120
0.041
0.029
KUK
0.082
0.110
0.105
0.134
0.131
0.147
0.023
SAN
0.057
0.087
0.094
0.137
0.096
0.112
0.022
0.011
LD
0.079
0.113
0.121
0.171
0.107
0.127
0.024
0.027
0.022
TA
0.101
0.136
0.144
0.198
0.134
0.160
0.043
0.044
0.037
0.010
KU
0.112
0.151
0.160
0.220
0.153
0.178
0.053
0.051
0.046
0.018
0.014
KK
0.125
0.166
0.176
0.244
0.165
0.195
0.066
0.062
0.058
0.032
0.023
0.017
BIN
0.196
0.241
0.258
0.335
0.257
0.284
0.107
0.099
0.094
0.049
0.056
0.045
0.025
PB
0.156
0.200
0.209
0.271
0.211
0.238
0.088
0.082
0.077
0.036
0.029
0.016
0.041
0.017
MUK
0.158
0.203
0.211
0.271
0.216
0.239
0.090
0.084
0.078
0.037
0.029
0.017
0.053
0.018
0.004
KUA
0.181
0.225
0.235
0.301
0.246
0.268
0.110
0.103
0.096
0.053
0.048
0.029
0.066
0.030
0.012
0.016
LUM
0.104
0.110
0.114
0.123
0.046
0.069
0.159
0.133
0.142
0.168
0.188
0.198
0.290
0.249
0.255
0.286
0.017
END
0.126
0.133
0.141
0.155
0.060
0.090
0.194
0.165
0.179
0.210
0.236
0.247
0.349
0.301
0.309
0.343
0.036
0.019
BM
0.091
0.093
0.103
0.108
0.046
0.066
0.123
0.094
0.102
0.127
0.146
0.157
0.248
0.203
0.208
0.237
0.049
0.065
0.016
M
0.131
0.153
0.183
0.209
0.082
0.103
0.191
0.177
0.198
0.232
0.257
0.278
0.383
0.322
0.332
0.366
0.115
0.137
0.107
0.018
The nucleotide sequences of COI and Cyt b genes in E. affinis exhibited a high A + T content, with percentages of 51.7 % and 50.7 %, respectively. The observed values exceeded the G + C content, which was consistent with the range observed in vertebrates (Nei and Kumar, 2000). The haplotype diversity (Hd) values for COI gene varied between 0.0000 and 0.8961, with an average value of 0.5131 (Table 4). Similarly, the nucleotide diversity (π) ranged from 0.0000 to 0.0137, with an average value of 0.0043. The findings suggest that each of the 20 populations of E. affinis exhibited a significant level of haplotype diversity (Hd > 0.5) and a relatively low level of nucleotide diversity (π < 0.5). In contrast, the haplotype diversity for Cyt b gene exhibited a range of values from 0.2355 to 0.9560, with an overall value of 0.7450. Similarly, the nucleotide diversity displayed a range of values from 0.0016 to 0.0676, with an overall value of 0.0162 (Table 4). The results indicate that each of the 20 populations of E. affinis exhibited a significant level of haplotype diversity and nucleotide diversity. Notes: N: Number of samples, h: number of haplotypes, Hd: Haplotype diversity, π: Nucleotide diversity. *Significant at P > 0.05.
Population
COI
Cyt b
N
h
Hd
π
Tajima’s D
Fu’s Fs
N
h
Hd
π
Tajima’s D
Fu’s Fs
PP
18
2
0.7994
0.0009
1.5476
1.4280
18
3
0.5425
0.0061
2.2835*
4.5350
TB
14
1
0.0000
0.0000
–
–
14
11
0.9560
0.0201
−0.6238
−1.8790
PK
6
1
0.0000
0.0000
–
–
8
6
0.9286
0.0676
−0.7805
3.1780
PT
21
1
0.0000
0.0000
–
–
21
6
0.6619
0.0593
0.6889
13.3930*
SB
14
1
0.0000
0.0000
–
–
14
4
0.6593
0.0123
−0.2360
4.9920*
KS
24
1
0.0000
0.0000
–
–
24
14
0.9058
0.0170
−1.7200
−1.3960
KUK
12
1
0.0000
0.0000
–
–
15
8
0.7905
0.0178
−1.7802
1.5720
SAN
20
1
0.0000
0.0000
–
–
20
5
0.6158
0.0051
−0.4150
1.3180
LD
24
12
0.8961
0.0047
−2.3034*
−4.3770
24
14
0.9420
0.0157
−1.6067
−1.5870
TA
24
6
0.8833
0.0110
0.0275
4.6530*
24
12
0.7572
0.0067
−2.3398*
−3.5500
KU
24
6
0.8419
0.0036
−1.7842
0.2360
24
6
0.6413
0.0114
−1.1313
3.8860
KK
24
10
0.8806
0.0070
−1.2180
−0.7560
24
7
0.7899
0.0083
−1.2057
1.5020
BIN
13
7
0.8508
0.0105
−2.2971*
0.7870
24
7
0.7681
0.0170
0.1832
4.8320*
PB
14
9
0.8891
0.0132
−0.9982
0.0140
23
5
0.7628
0.0118
0.5499
5.4430*
MUK
24
9
0.8452
0.0033
−2.1814*
−3.2320
24
3
0.2355
0.0016
−1.9929*
0.9120
KUA
24
6
0.8788
0.0137
1.5295
6.2490*
24
10
0.8949
0.0133
−1.3607
0.8090
LUM
24
6
0.7849
0.0089
−0.9948
3.5950
24
4
0.7138
0.0054
0.7745
3.1170
END
24
11
0.8503
0.0054
−2.3601*
−2.5950
24
6
0.6449
0.0078
−0.5578
2.1820
BM
24
4
0.8614
0.0033
−1.1581
1.9840
23
7
0.7747
0.0094
−1.3723
1.8120
M
18
1
0.0000
0.0000
–
–
18
11
0.9150
0.0112
−1.1860
−1.8520
Total
390
20
0.5131
0.0043
−2.2553*
11.7200
414
20
0.7450
0.0162
−1.3609
−0.3670
3.3 Phylogenetic analysis and minimum spanning network (MSN)
The analysis of the neighbor-joining (NJ) tree and the minimum spanning network (MSN), using both COI and Cyt b genes revealed the formation of three distinct clades among the E. affinis specimens collected from Malaysia and its surrounding waters (Figs. 2, 3 and 4). The first clade for the COI gene consisted of individuals from the following locations: END, LUM, KUA, SB, KUK, PT, PK, TB, PP, SAN, LD, KS, and BM (Hap 1, Hap 2, Hap 19, and Hap 20). The second clade comprised samples from PK, PT, KUK, SAN, LD, M, LUM, and KUA (Hap 3, Hap 8 to Hap 14, Hap 16 to Hap 18), whereas the third clade encompassed individuals from LD, TA, KU, BIN, KK, PULAU, and MUK (Hap 4 to Hap 6, and Hap 15) (Figs. 2 and 4A). Conversely, the first clade for the Cyt b gene comprised specimens originating from KUA, MU, PULAU, BIN, KK, KU, and TA (Hap 8 to Hap 16). The second clade consisted of samples obtained from KK, LD, SAN, and KUK (Hap 3 to Hap 5), whereas the third clade encompassed individuals from PP, PK, PT, TB, M, SB, BM, LUM, and END (Hap 1, Hap 2, Hap 6, Hap 7, Hap 17 to Hap 20) (Figs. 3 and 4B). The NJ tree analysis also demonstrated that the sequence of E. affinis retrieved from GenBank exhibited a closer relationship with the E. affinis specimens in this current study, as opposed to the outgroup species (Lutjanus erythropterus). This finding provides further confirmation that the collected individuals indeed belong to the E. affinis species. The MSN analysis for both genes (Fig. 4) indicated that Hap 2 and Hap 1 exhibited the highest frequency among the haplotypes. The remaining haplotypes exhibited either limited distribution across a few populations or were exclusive to a specific population. The presence of three distinct clades (clades 1, 2, and 3) was further supported by the MSN analysis, revealing a nucleotide divergence of over five differences between them (Fig. 4).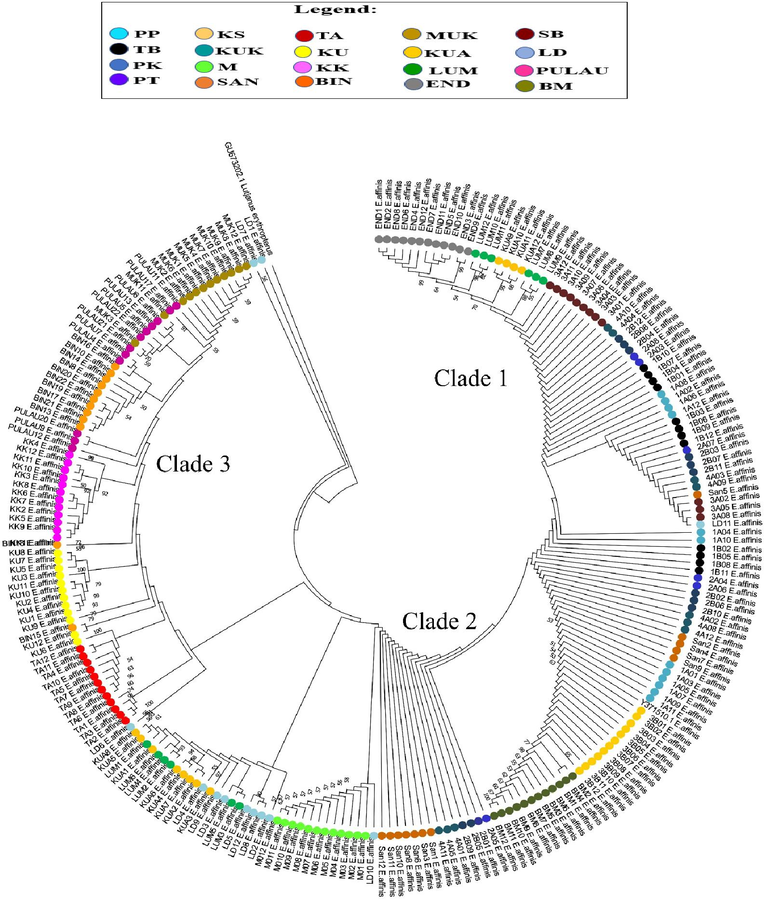
Neighbor-Joining (NJ) tree showing relationships between COI haplotypes of E. affinis collected from Malaysia and its surrounding waters. Only bootstrap values >50 % are shown.
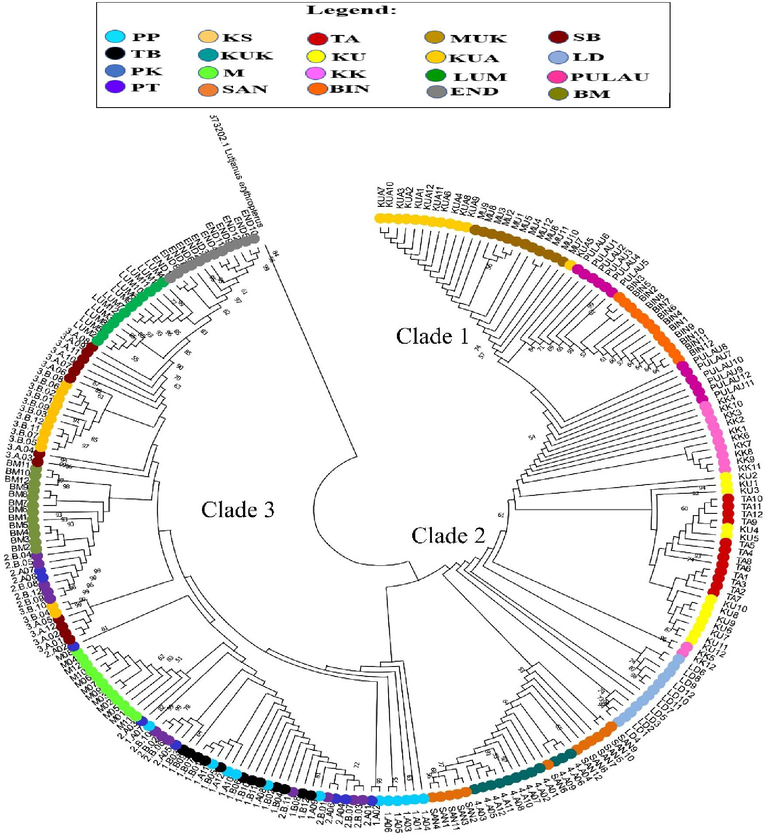
Neighbor-Joining (NJ) tree showing relationships between Cyt b haplotypes of E. affinis collected from Malaysia and its surrounding waters. Only bootstrap values >50 % are shown.
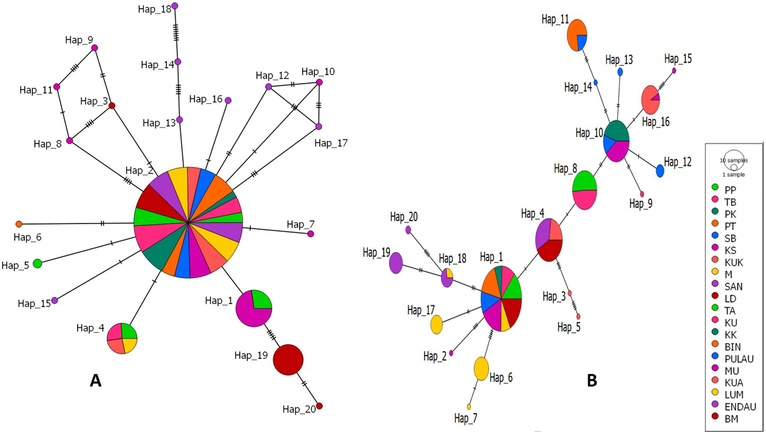
Minimum spanning network among 20 haplotypes (A) COI (B) Cyt b of E. affinis collected from 20 populations in Malaysia and its surrounding waters.
3.4 Haplotype distribution
The analysis of haplotype distribution reveals that a total of 20 distinct haplotypes were identified for both the COI and Cyt b genes across 20 populations. Haplotype 2 (N = 300) emerged as the dominant haplotype for the COI gene, exhibiting authority across all populations with the exception of KS and BM. Haplotype 1 was observed to be present in two distinct populations, namely PP and KS. Conversely, Haplotype 4 was identified in three separate populations, namely TA, KUA, and LUM. The rest remaining haplotypes were either private or specific to a particular population (Fig. 4A). In contrast, the Cyt b gene exhibited haplotype 1 as the most prevalent type (N = 131). This haplotype was found to be shared across eight populations, namely PP, TB, PK, PT, SB, KS, LUM, and BM. Haplotype 4 exhibited an overlap in presence among three distinct populations, namely KUK, SAN, and LD. Similarly, haplotype 8 was identified in two populations, TA and KU. Haplotype 10 was observed in three populations, namely KK, PB, and MUK. Haplotype 11 demonstrated a shared occurrence between two populations, BIN and PB. Furthermore, haplotype 16 was found in two populations, MUK and KUA, while haplotype 18 was represented in two populations, LUM and END. The remaining haplotypes were found to be distinct and exclusive to a specific population (Fig. 4B).
3.5 Population genetic structure
The genetic compositions of 20 populations of E. affinis were examined through the analysis of two mitochondrial DNA genes, namely COI and Cyt b. The results of AMOVA analysis indicate that there is a significant level of genetic variation observed among populations, with COI accounting for 53.64 % and Cyt b accounting for 95.21 % of this variation. Conversely, the level of genetic variation within populations is relatively low, with COI accounting for 46.36 % and Cyt b accounting for 4.79 % of this variation. The results obtained for both genes revealed significant genetic structure among the 20 populations of E. affinis. This was indicated by the values of FST and P, with COI showing an FST value of 0.5364 (P < 0.05), and Cyt b showing an FST value of 0.9521 (P < 0.05) (Table 5). The Mantel test results reveal a significant correlation between genetic differentiation (measured by the FST value) and geographical distance (COI: r = 0.6730, P = 0.0000; Cyt b: r = 0.9700, P = 0.0000) among the examined populations.
Gene
Source of variation
Degrees ofFreedom
Sum of squares
Variance components
Percentage of variation
FST
P
COI
Among Populations
19
2653.136
6.88355 Va
53.64
0.5364
0.0000
Within populations
370
2201.244
5.94931 Vb
46.36
Total
389
4854.379
12.83285
100
Cytb
Among Populations
19
44043.133
111.99896 Va
95.21
0.9521
0.0000
Within populations
394
2220.437
5.63563 Vb
4.79
Total
413
46263.570
117.63459
100
3.6 Neutrality test and mismatch distribution
The neutrality assessment of the COI gene revealed a statistically significant negative Tajima's D statistic (−2.2553, P < 0.05) across all populations. Similarly, the Fs statistic calculated by Fu yielded a negative value, although it did not reach statistical significance (−11.7200, P > 0.05). In relation to the Cyt b gene, the neutrality test revealed that both Tajima's D and Fu's Fs statistics for all populations were negative, albeit not statistically significant (−1.3609 and −0.3670, respectively) (Table 4). Mismatch distribution analysis for both genes exhibited a unimodal pattern (Fig. 5).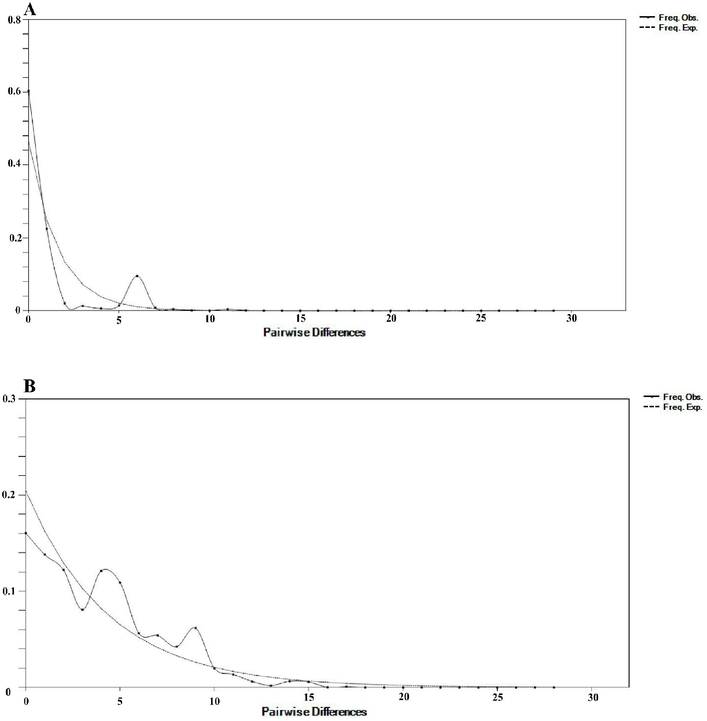
Mismatch distributions (pairwise number of differences) for the mtDNA genes (A) COI (B) Cyt b of E. affinis showing the expected and observed pairwise differences between sequences with the respective frequencies.
4 Discussion
The presence of skilled taxonomists is crucial in ensuring the accurate identification of species using morphological identification techniques or traditional methods, as there is a significant risk of misidentification resulting from phenotypic plasticity. Therefore, DNA barcoding has proven to be a very useful method for identifying species, particularly for specimens that are imperfect, damaged, or at distinct morphological stages. Nevertheless, it is important to acknowledge that DNA barcoding does possess certain limitations. One such limitation is that closely related species may exhibit comparable sequences, thereby rendering DNA barcodes less effective in their ability to differentiate between species. Hence, it is highly recommended to employ diverse genes or multiple genes in order to ensure precise and accurate outcomes in DNA barcoding (Wang et al., 2018). The current study successfully identified over 99 % of E. affinis specimens obtained using the Basic Local Alignment Search Tool (BLAST) from NCBI database utilising the COI and Cyt b genes. This study demonstrates the efficacy of both COI and Cyt b gene markers in distinguishing E. affinis specimens and assessing the genetic diversity and population structure of E. affinis collected from five important marine regions in Malaysia and its adjacent waters.
The genetic distance within and between 20 populations of E. affinis, as determined by analysing the COI gene, exhibited a range from low to high values (0.000–0.082) (Table 2). The findings of this study indicate that there exists a genetic differentiation among a total of 20 populations of E. affinis. The assessment of genetic distance is frequently employed to determine the taxonomic classification in closely related species, as well as for the purposes of evolutionary investigation. According to Hebert et al. (2003), a higher genetic distance indicates a substantial decrease in relatedness between the samples, accompanied by an extensive number of variations in their nucleotide bases. Marine species commonly exhibit characteristics such as a substantial population size, the capacity to disperse extensively during their pelagic larval stages, and a wide geographical distribution (Palumbi, 1992). For example, the limited genetic diversity observed among tuna populations across different oceans can be attributed to the presence of a consistent and extensive pelagic habitat and abundant spawning areas (Durand et al., 2005). The geographical conditions in Malaysia have a substantial impact on the proliferation and breeding of aquatic life. The warm and shallow waters found in this area provide an optimal setting for the thriving of fish, coral, seaweed, and various other marine resources (Azahar et al., 2022). The vast pelagic environment and plentiful spawning grounds in Malaysia designate it as a critical region for highly migratory species, such as tuna (Prince et al., 2023). On the other hand, the physical obstacles in the marine environment, such as ocean currents, reefs, and other land formations, are thought to be the reason why marine fish display genetic diversity and population structure. The presence of these barriers has the potential to impede the movement of genes between populations, resulting in genetic differentiation (Ward et al., 1994).
This present findings are consistent with prior studies that have examined the genetic structure of E. affinis in various marine regions, including the North Indian Ocean (Kumar et al., 2012), the Straits of Malacca (Masazurah et al., 2012), and the coastal waters of Tanzania (Johnson et al., 2016). These studies have identified discrete clades of E. affinis. Similarly, the results of the current study align with the findings presented by Kasim et al. (2020), wherein a minimal genetic differentiation was observed among 11 distinct populations of Thunnus tonggol (longtail tuna) in Malaysia. In their study, Akbar et al. (2018) provided findings on the genetic distance observed in Thunnus obesus. Their research focused on two distinct populations inhabiting the North and South Moluccas Seas in Indonesia. The reported genetic distance values ranged from 0.023 to 0.027, indicating the level of genetic differentiation within and between these populations.
Both haplotype diversity (Hd) and nucleotide diversity (π) are highly responsive indicators of a population's genetic diversity and can be employed to infer population’s historical demographic patterns. The low nucleotide diversity and high haplotype diversity, as observed through analysis of the COI gene in this study provide evidence for a large population size, recent population expansion, and the presence of unique genetic variations within the population. Nevertheless, this also implies that there has been an insufficient duration for the accumulation of supplementary nucleotide substitutions across the various haplotypes (Kasim et al., 2020). In contrast, the Cyt b gene exhibited significant levels of nucleotide and haplotype diversities. Based on the demographic history classifications proposed by Grant and Bowen (1998), the results obtained from the analysis of the Cyt b gene are consistent with category 4. This classification suggests a substantial level of diversity in haplotypes (h > 0.5) and nucleotides (π > 0.5 %). The findings of this study indicate the possibility of either a lengthy evolutionary timeline within a large and stable population, or significant divergence among haplotypes resulting from a secondary encounter between distinct lineages. As stated by Kumar et al. (2012), it is widely accepted that the substantial genetic diversity observed in marine fishes can be attributed to their large population sizes. Thus, the extensive haplotype diversity observed in this study can be attributed to the wide geographic range and substantial population sizes of E. affinis. The present findings are consistent with previous studies conducted on various species of tuna, including E. affinis (Hd = 0.67, π = 0.0124) (Santos et al., 2010), longtail tuna (Thunnus tonggol) (Hd = 0.990, π = 0.0195) (Kasim et al., 2020).
The findings of the phylogenetic tree and MSN analyses for both mitochondrial genes are depicted in Figs. 2, 3, and 4. The results of these analyses demonstrate that the 20 populations of E. affinis can be classified into three distinct clades. The existence of distinct genetic clades within a species can be attributed to the occurrence of secondary contact and subsequent interbreeding between populations that have experienced prolonged geographic isolation (Durand et al., 2005). The results of the MSN analysis conducted on both genes indicate that a significant proportion of the populations exhibited shared genetic characteristics with Hap 2 and Hap 1, respectively. This finding suggests that there has been a recent exchange of genetic material between these populations. Furthermore, Horne et al. (2008) demonstrated that over a long period of time, significant genetic exchange and movement of individuals between geographically distant populations resulted in the sharing of haplotypes. Additionally, the populations of LD, TA, BIN, MUK, END, and BM exhibited unique COI haplotypes. In contrast, the populations of KS, KUK, KU, PB, MUK, LUM, and END exhibited distinct Cyt b haplotypes. The findings of this study indicate a potential decrease in the exchange of genetic material between the studied locations, most probably caused by oceanic currents (Halim et al., 2022).
In addition, the AMOVA analysis corroborated the findings derived from the analyses of the phylogenetic tree and MSN, thus emphasising the presence of a genetic structure among the populations of E. affinis. The utilization of FST values is a common practise in the estimation of gene flow, whereby a greater FST value signifies a substantial level of genetic differentiation, while a lesser FST value indicates a minimal level of genetic differentiation (Jose et al., 2023). AMOVA analysis based on the COI gene indicated a substantial level of FST values (0.5364) with a statistically significant difference (P < 0.05, 0.0000). Furthermore, the analysis of the Cyt b gene revealed an important proportion of FST values (0.9521) accompanied by a statistically significant difference at a significance level of P < 0.05 (0.0000) (Table 5). Moreover, the isolation by distance (IBD) or Mantel test reveals a significant correlation between genetic differentiation and geographical distance. Again, the results of this analysis provide evidence supporting the presence of a genetic framework within the populations studied. Moreover, earlier studies have reported the existence of a genetic framework within tuna species (see e.g. Kunal et al., 2013; Li et al., 2015). The genetic structure of E. affinis populations plays a vital role in their response to environmental changes and human activities. High genetic diversity within a population enhances adaptability, furnishing a reservoir of traits that can help in coping with alterations in their environment. This diversity promotes resilience to stressors and fosters evolutionary flexibility (Conover et al., 2006).
The analysis of demographic history examines fluctuations in the size of a population over time, using nucleotide sequences as a tool to infer historical variations in mutation patterns (Tajima, 1989). The present study employed an independent demographic history test to ascertain that populations of E. affinis experienced a period of population expansion (Table 4). Concerning the COI and Cyt b genes, the results of this study indicate that the effectiveness of Fu's Fs in detecting significant changes in population surpasses that of Tajima's D, thereby addressing the discrepancy observed between the two measures (Fu, 1997). Generally, the results indicate the occurrence of a population change in the past, suggesting a population expansion, based on Tajima's D (Tajima, 1989). Tajima's D is a widely employed method for assessing whether the nucleotide sequence is in a state of mutation-drift equilibrium. According to Korneliussen et al. (2013), a negative value of Tajima's D suggests the possibility of population growth, expansion, or the occurrence of purifying selection. As stated by Fu)1997), the Fs test is highly sensitive in detecting evolutionary forces resulting from an abundance of new mutations within a population. Moreover, it is considered a potent tool for identifying instances of population expansion. Furthermore, the presence of a unimodal pattern of mismatch distribution as depicted in Fig. 5 offers additional support for the hypothesis of a sudden demographic expansion in the recent history of the taxa. This findings align with prior studies conducted on pelagic species including Thunnus albacares (Kunal et al., 2013), Thunnus tonggol (Kasim et al., 2020). In general, the results of this investigation suggest that E. affinis specimens gathered from various geographical regions experienced a phase of population growth.
5 Conclusion
This study represents the inaugural documentation encompassing multiple locations in Malaysia, as well as the initial investigation conducted in Yemeni waters, pertaining to the examination of genetic diversity and population structure of E. affinis through the utilization of COI and Cyt b genes. The COI and Cyt b have been effectively utilized to assess 20 distinct populations of E. affinis in the waters of Malaysia and Yemen. This analysis has unveiled the presence of three distinct lineages within these populations, which are distributed across five marine regions: the Straits of Malacca, South China Sea, Sulu Sea, Celebes Sea, and the Arabian Sea. Obviously, the findings of this study will establish a valuable foundation of knowledge for the effective management and conservation of neritic tuna populations in the waters of Malaysia and Yemen. It is anticipated that future research on the current study will require the use of different genetic markers and a larger number of sampling sites and specimen.
CRediT authorship contribution statement
Khaled Binashikhbubkr: Formal analysis, Investigation, Methodology, Software. F. Al-Misned: Validation, Writing – review & editing. Darlina Md. Naim: Conceptualization, Project administration, Resources, Supervision, Visualization.
Acknowledgement
The authors wish to convey their profound gratitude to Universiti Sains Malaysia (USM) and the School of Biological Sciences (SBS) for providing opportunity and research resources for this project. The research was funded by the Fundamental Research Grant Scheme (FRGS Fasa 1/2020), which is administered by the Ministry of Education Malaysia. The authors (FAM) express his sincere appreciation to the Researchers Supporting Project number (RSP-2023R24), King Saud University, Riyadh, Saudi Arabia. In addition, the first author wishes to Thank Hadhramout University and the Hadhramout Foundation in Yemen for their funding assistance with the author's studies.
Declaration of competing interest
The authors declare that they have no known competing financial interests or personal relationships that could have appeared to influence the work reported in this paper.
References
- Population genetics and phylogeography of Bigeye Tuna in Moluccas Seas, Indonesia. ILMU KELAUTAN: Indon. J. Mar. Sci.. 2018;23(4):145-155.
- [CrossRef] [Google Scholar]
- Species Checklist and DNA Barcoding of Marine Fishes From Pulau Tinggi, Johor, Malaysia. J. Sust. Sci. Manage.. 2022;17(11):45-55.
- [CrossRef] [Google Scholar]
- DNA barcoding of Malaysian commercial snapper reveals an unrecognized species of the yellow-lined Lutjanus (Pisces:Lutjanidae) PLoS One. 2018;13(9)
- [CrossRef] [Google Scholar]
- Geometric morphometric discrimination between seven populations of Kawakawa Euthynnus affinis (Cantor, 1849) from Peninsular Malaysia. J. King Saud Univ. – Sci.. 2022;34(3):101863
- [CrossRef] [Google Scholar]
- Population genetic structure and demographic history of the mudskipper Boleophthalmus pectinirostris on the northwestern pacific coast. Environ. Biol. Fishes. 2015;98(3):845-856.
- [CrossRef] [Google Scholar]
- Collette, B. B., Nauen, C. E., 1983. FAO Species Catalogue Vol . 2 Scombrids of the world an annotated and illustrated catalogue of Tunas, Mackerels, Bonitos and related species know to date. In FAO Fisheries Synopsis (Vol. 2, Issue 125). DOI: FAO Fish. Synop. 125(2).
- Spatial and temporal scales of adaptive divergence in marine fishes and the implications for conservation. J. Fish Biol.. 2006;69:21-47.
- [CrossRef] [Google Scholar]
- Application of morphometric analysis to identify alewife stock structure in the gulf of maine. Marine Coast. Fish.. 2013;5(1):11-20.
- [CrossRef] [Google Scholar]
- DoFMـــDepartment of Fisheries Malaysia, 2021. Annual Fisheries Statistics 2021, vol. 1. Kuala Lumpur: Ministry of Agriculture and Agro-industry.
- Nuclear and mitochondrial DNA markers indicate unidirectional gene flow of Indo-Pacific to Atlantic bigeye tuna (Thunnus obesus) populations, and their admixture off southern Africa. Mar. Biol.. 2005;147(2):313-322.
- [CrossRef] [Google Scholar]
- Effarina, M. F. A., Sallehudin, J., Arthur Besther, S., Nor Azlin, M., 2020. Malaysia National Report to the Scientific Committee of the Indian Ocean Tuna Commission, 2019. IOTC–2020–SC23–NR15_Rev1. IOTC–2020–SC23–NR15_Rev1, 1–30.
- Does the Atlantic horse mackerel Trachurus trachurus (Teleostei: Carangidae) differentiate morphologically within the putative Moroccan-Saharan stock? Mar. Biol. Res.. 2021;17(4):341-349.
- [CrossRef] [Google Scholar]
- Arlequin suite ver 3.5: A new series of programs to perform population genetics analyses under Linux and Windows. Mol. Ecol. Resour.. 2010;10(3):564-567.
- [CrossRef] [Google Scholar]
- Statistical testsof neutrality of mutations against population growth, hitchhiking and background selection. Gene. Soc. Am.. 1997;14:915-925.
- [Google Scholar]
- Landmark-based morphometric and meristic variations of endangered mrigal carp, Cirrhinus cirrhosus (Bloch 1795), from wild and hatchery stocks. Sains Malays.. 2017;46(5):695-702.
- [CrossRef] [Google Scholar]
- Shallow population histories in deep evolutionary lineages of marine fishes: insights from sardines and anchovies and lessons for conservation. J. Hered.. 1998;89(5):415-426.
- [Google Scholar]
- Morphometric relationships for four Scombridae fish species in Australian waters. J. Appl. Ichthyol.. 2017;33(3):583-585.
- [CrossRef] [Google Scholar]
- Genetic diversity in Pangasius spp. collected in Bangladesh based on mitochondrial cytochrome b gene sequence analysis. Aquacult. Rep.. 2020;17:100351
- [CrossRef] [Google Scholar]
- Phylogenetic relationships of the commercial red snapper (Lutjanidae sp.) from three marine regions. J. King Saud Univ. – Sci.. 2022;34(2):101756
- [CrossRef] [Google Scholar]
- Barcoding animal life: Cytochrome c oxidase subunit 1 divergences among closely related species. Proc. R. Soc. B Biol. Sci.. 2003;270(SUPPL. 1):96-99.
- [CrossRef] [Google Scholar]
- DNA barcodes for 1/1000 of the animal Kingdom. Biol. Lett.. 2010;6(3):359-362.
- [CrossRef] [Google Scholar]
- High population connectivity across the Indo-Pacific: Congruent lack of phylogeographic structure in three reef fish congeners. Mol. Phylogenet. Evol.. 2008;49(2):629-638.
- [CrossRef] [Google Scholar]
- Analysis of Various DNA Barcodes on the Turkish Protected Designation of Origin Apricot “ Iğdır Kayısısı ” (Prunus armeniaca cv. Şalak) Turkish J. Agric. - Food Sci. Technol.. 2020;8(9):1982-1987.
- [CrossRef] [Google Scholar]
- Stock identification: materials and methods. Can. J. Fish. Aquat. Sci.. 1981;38(12):1838-1855.
- [CrossRef] [Google Scholar]
- Mitochondrial marker implies fishery separate management units for spotted sardinella, Amblygaster sirm (Walbaum, 1792) populations in the South China Sea and the Andaman Sea. PeerJ 2022
- [CrossRef] [Google Scholar]
- Genetic stock structure and phylogenetic relationship of Kawakawa Euthynnus affinis – Cantor (1849) in the Northern Coastal Waters of Tanzania Using Mitochondrial DNA Control Region. Indian Ocean Tuna Commiss.. 2016;1849:1-17.
- [Google Scholar]
- Jose, D. M., Divya, P. R., Lal, K. K., 2023. Panmictic stock structure of milkfish (Chanos chanos, Forsskål 1775) from Indian waters determined using mtDNA marker. Journal of Genetics, 102(1). DOI: 10.1007/s12041-022-01395-6.
- Recent population expansion of longtail tuna Thunnus tonggol (Bleeker, 1851) inferred from the mitochondrial DNA markers. PeerJ. 2020;8:1-23.
- [CrossRef] [Google Scholar]
- Studies on the elemental profile of otoliths and truss network. Zool. Stud.. 2012;51(7):1195-1206.
- [Google Scholar]
- Calculation of Tajima’s D and other neutrality test statistics from low depth next-generation sequencing data. BMC Bioinf.. 2013;14(1)
- [CrossRef] [Google Scholar]
- Single genetic stock of kawakawa Euthynnus affinis (Cantor, 1849) along the Indian coast inferred from sequence analyses of mitochondrial DNA D-loop region. Conserv. Genet.. 2012;13(4):1119-1131.
- [CrossRef] [Google Scholar]
- Cytochrome Oxidase I (COI) sequence conservation and variation patterns in the yellowfi n and longtail tunas. Int. J. Bioinf. Res. Appl.. 2013;9(3):301-309.
- [CrossRef] [Google Scholar]
- Mitochondrial DNA analysis reveals three stocks of yellowfin tuna Thunnus albacares (Bonnaterre, 1788) in Indian waters. Conserv. Genet.. 2013;14(1):205-213.
- [CrossRef] [Google Scholar]
- POPART: full-feature software for haplotype network construction. Methods Ecol. Evol.. 2015;6(9):1110-1116.
- [CrossRef] [Google Scholar]
- Genetic population structure of Thunnus albacares in the central pacific ocean based on mtDNA COI gene sequences. Biochem. Genet.. 2015;53(1–3):8-22.
- [CrossRef] [Google Scholar]
- The fishing grounds and the exploitation status of kawakawa (Euthynnus affinis) in Java Sea, Indonesia. HAYATI J. Biosci.. 2022;29(2):255-265.
- [CrossRef] [Google Scholar]
- Masazurah, A. R., N, S. A. M., Samsudin, B., 2012. A preliminary study of population structure of kawakawa, Euthynnus affinis (Cantor 1849) in the straits of Malacca. IOTC-2012-WPNT02-23, 1–10.
- Landmark-based geometric analysis of body shape variation and meristic plasticity among populations of Alburnoides idignensis from Tigris River Drainage, Persian Gulf Basin, Iran. Iran. J. Anim. Biosystem.. 2021;17(1):79-88.
- [CrossRef] [Google Scholar]
- Molecular Phylogenetics. New York: Oxford University Press; 2000.
- Supporting regional co-operation in the South China Sea with an initial assessment of the data-limited skipjack tuna fishery. Mar. Policy. 2023;155:105711
- [CrossRef] [Google Scholar]
- Population growth makes waves in the distribution of pairwise genetic differences. Mol. Biol. Evol.. 1992;9(3):552-569.
- [Google Scholar]
- DnaSP 6: DNA sequence polymorphism analysis of large data sets. Mol. Biol. Evol.. 2017;34(12):3299-3302.
- [CrossRef] [Google Scholar]
- A pilot study on the genetic variation of eastern little tuna (Euthynnus affinis) in Southeast Asia. Philipp. J. Sci.. 2010;139(1):43-50.
- [Google Scholar]
- Statistical methods for testing the neutral mutation hypothesis by DNA polymorphism. Gene. Genet. Soc. Am.. 1989;123:585-595.
- [Google Scholar]
- MEGA11: molecular evolutionary genetics analysis version 11. Mol. Biol. Evol.. 2021;1–12
- [CrossRef] [Google Scholar]
- Identification of tuna species in commercial cans by minor groove binder probe real-time polymerase chain reaction analysis of mitochondrial DNA sequences. Mol. Cell. Probes. 2010;24(6):352-356.
- [CrossRef] [Google Scholar]
- Morphometric comparisons of African catfish, Clarias gariepinus, populations in Turkey. Folia Zool.. 2005;54(1/2):165-172.
- [Google Scholar]
- DNA barcoding of marine fish species from Rongcheng Bay, China. PeerJ. 2018;6:1-19.
- [CrossRef] [Google Scholar]
- A comparison of genetic diversity levels in marine, freshwater, and anadromous fishes. J. Fish Biol.. 1994;44:213-232.
- [Google Scholar]
- DNA barcoding Australia’s fish species. Philos. Trans. R. Soc., B. 2005;360:1847-1857.
- [CrossRef] [Google Scholar]
- Population structure of Indian Mackerel (Rastrelliger kanagurta) in Java and Bali Island, Indonesia Inferred from otolith shape. Sains Malaysian.. 2022;51(1):39-50.
- [CrossRef] [Google Scholar]


