

Translate this page into:
Genetic characterization and bottleneck analysis of Maghateer camel population in Saudi Arabia using microsatellite markers
⁎Corresponding author. ahmdhusam@hotmail.com (A.H. Mahmoud)
-
Received: ,
Accepted: ,
This article was originally published by Elsevier and was migrated to Scientific Scholar after the change of Publisher.
Peer review under responsibility of King Saud University.
Abstract
In this study, twenty microsatellite markers were applied to study the genetic polymorphism in Maghateer Camels in the Kingdom of Saudi Arabia. About 50 unrelated Maghateer camels were selected and hair roots were subjected for the extraction of total genomic DNA. The selected microsatellite forward-, and revised-primers amplified 19 SSR markers from the Camels. In the experimental condition, CMS25 and VOLP67 markers did not yield any genomic amplification from the DNA of Camels. A total of nineteen microsatellite loci have been determined as polymorphic nature. In this experiment 155 alleles were obtained by the loci of 19 microsatellites, range of 4 to 16 alleles per locus and the mean of 8.158 alleles per locus. The observed heterozygosity (Ho) range varied from 0.280 to 1.000 and the mean value was determined as 0.717. The mean expected heterozygosity (He) was found to be 0.667 and the range varied between 0.282 and 0.871. In Maghateer population, the effective number (mean) was found to be 3.599. A total of 12 loci were determined in this study. In the selected Camel population no bottleneck in nearest past or no potent heterozygote excess was obtained based on standardized differences, sign and tests such as Wilcoxon tests and L shaped distribution of mode-shift test. The present findings showed the utility of these 19 microsatellite loci for analyzing genetic polymorphism in Camelus dromedarius (dromedary camel).
Keywords
Dromedary
Maghateer
Microsetellite
Heterzygosity

1 Introduction
Camels are unique animals in various aspects and are very difficult to compare with other farm animals based on their adaptation and responses to the environment. Camels are diverse in nature and it is found in Arabian Peninsula, Afghanistan, African deserts and Somalia. Arabian Camels meet the food requirement in various countries than sheep and cattle, which are mainly affected by water scarcity and heat. In Kingdom of Saudi Arabia, Camel population is classified based on morphological characters and area of origin (Al-Hazmi et al., 1994). Generally coat colour is used to classify Camels in Saudi Arabia. Based on coat colour, Saudi Arabian Camels have classified into three types. These include Al-Sofr (brown), Maghateer (white), and Al-Homr and Magaheem (black). In a study, Elamin and Wilcox (1992a,b) classified Camels into four types, including, Omani (used for riding), Al-Hawara (survives in Al-Hawara area), Wadha (survies in Hejaz area) and Najdi or Magaheem. The camels in Saudi Arabia are one humped and dromedaries types. In Saudi Arabia, Camels have various roles in celebrations as the part of Kingdom heritage, and is the typical icon in Kingdom heritage. In Arabian Peninsula, a total of 1.6 million populations are found and this population is about 53% population of entire Saudi Arabia (FAO, 2012). The Camels, Wadha is dominant in Hejaz region and Al-Hawara type camels are predominant in Northern Saudi Arabia. In Najd and AL Dawaser valley, the populations of Maghateer are very high. Maghateer type Camels are white in colour and rigid in nature and is well known to yield milk than other types under range conditions. In Saudi Arabia, studies on genetic variability of Camels are very rare, it is very important to study the Camels using molecular markers to assess the population. This kind of genetic analysis is useful to improve camels and to develop various breeding mechanisms to improve Camels. In Saudi Arabia, the genetic variation of dromedary populations has been poorly documented. In a study, Spencer et al. (2010) studied the genetic variance in Camel population has been studied using the genetic markers like, Randomly Amplified Polymorphic Dimorphism (RAPD) and DNA fingerprinting (DFP). Recently, Musthafa (2015) analyzed genetic diversity in the Camels from Tunisia, Egypt, India, Canary Islands, Saudi Arabia, Kenya and Australia. These Camels from these countries showed range of genetic diversity and analyzed using various microsatellite markers. The microsatellite markers such as, CMS50, CVRL07, CVRL06, CVRL05, CVRL01, LCA66, VOLP67, VOLP32, VOLP10, VOLP08, VOLP03, YWLL59, YWLL44, YWLL38, YWLL09 and YWLL08 were used to analyze the heterozygosity among Camel population. These microsatellite markers have rich of polymorphic information and degree of allelic richness (Musthafa, 2015). It is anticipated that the obtained information from this study can be used in conservation and genetic improvement plans of Maghateer Camel population in Saudi Arabia.
2 Materials and methods
2.1 Samples
In the present study, 50 Camels were selected and hair samples were collected in a clean container. Also registered the history of sample preparations and breed of Camel in all containers. The collected samples were stored at −80 °C for further use. DNA of the hair sample was extracted using QIAgen DNeasy blood and tissue kit according to the manufacture’s instructions (Hildane, Germany). The purified DNA sample was stored immediately at −40 °C. The isolated DNA was checked for its purity and quantified by using a UV–Visible Spectrophotometer (Krackler Scientific Incorporation, USA).
2.2 Primers
In this study, 21 pair of microsatellites was applied to analyze the genotype of the selected 50 Camel (FAO, 2000). The list of primers were tabulated in Table 1.
S.r.
Locus
Primer (5′ → 3′) F – Forward, R – Reverse
Annealing Temp. (°C)
Size range (bp)
1
YWLL08
F-ATCAAGTTTGAGGTGCTTTCC
R-CCATGGCATTGTGTTGAAGAC55 °C
133–180
2
YWLL09
F-AAGTCTAGGAACCGGAATGC
R-AGTCAATCTACACTCCTTGC55 °C
138–180
3
YWLL38
F-GGCCTAAATCCTACTAGAC
R-CCTCTCACTCTTGTTCTCCTC60 °C
174–192
4
YWLL44
F-CTCAACAATGCTAGACCTTGG
R-GAGAACACCGCTGGTGAATA60 °C
86–120
5
YWLL59
F-TGTGCAGCAGTTAGGTGTA
R-CCATGTCTCTGAAGCTCTGGA58 °C
96–136
6
VOLP03
F-AGACGGTTGGGAAGGTGGTA
R-CGACAGCAAGGCACAGGA60 °C
129–206
7
VOLP08
F-CCATTCACCCCATCTCTC
R-TCGCCAGTGACCTTATTTAGA55 °C
142–180
8
VOLP10
F-CTTTCTCCTTTCCTCCCTACT
R-CGTCCACTTCCTTCATTTC55 °C
231–268
9
VOLP32
F-GTGATCGGAATGGCTTGAAA
R-CAGCGAGCACCTGAAAGAA55 °C
192–262
10
VOLP67
F-TTAGAGGGTCTATCCAGTTTC
R-TGGACCTAAAAGAGTGGAG55 °C
142–203
11
LCA66
F-GTGCAGCGTCCAAATAGTCA
R-CCAGCATCGTCCAGTATTCA58 °C
212–262
12
CVRL01
F-GAAGAGGTTGGGGCACTAC
R-CAGGCAGATATCCATTGAA55 °C
188–253
13
CVRL05
F-CCTTGGACCTCCTTGCTCTG
R-GCCACTGGTCCCTGTCATT60 °C
148–174
14
CVRL06
F-TTTTAAAAATTCTGACCAGGAGTCTG
R-CATAATAGCCAAAACATGGAAACAAC60 °C
185–205
15
CVRL07
F-AATACCCTAGTTGAAGCTCTGTCCT
R-GAGTGCCTTTATAAATATGGGTCTG55 °C
255–306
16
CMS13
F-TAGCCTGACTCTATCCATTTCTC
R-ATTATTTGGAATTCAACTGTAAGG55 °C
238–265
17
CMS17
F-TATAAAGGATCACTGCCTTC
R-AAAATGAACCTCCATAAAGTTAG55 °C
135–167
18
CMS18
F-GAACGACCCTTGAAGACGAA
R-AGGAGCTGGTTTTAGGTCCA60 °C
157–188
19
CMS25
F-GATCCTCCTGCGTTCTTATT
R-CTAGCCTTTGATTGGAGCAT58 °C
93–128
20
CMS50
F-TTTATAGTCAGAGAGAGTGCTG
R-TGTAGGGTTCATTGTAACA55 °C
129–190
21
CMS121
F-CAAGAGAACTGGTGAGGATTTTC
R-TTGATAAAAATACAGCTGGAAAG60 °C
128–166
2.3 Amplification of DNA and analyses
To analyze the use of SSR markers (22) in Camel samples, DNA from various Camel samples were applied. Optimum annealing temperature was evaluated using PCR gradient system for every pair of each SSR marker. Genomic DNA was amplified using a Polymerase Chain Reaction 9700 thermocycler machine. Initial denaturation step was set as 2 min at 94 °C, and then 94 °C was maintained for 30. Annealing temperature was set between 50 and 60 °C (30 s) based on the microsatellite primer-pair applied, followed by 72 °C for 30 s. Final extension was performed for 5 min at 72 °C. The purity of the amplified genomic DNA was tested using Agarose gel electrophoresis. Further, the amplified DNA was multiplexed based on their fluorescent dye and the amplified DNA was run in Genetic Analyzer. To the multiplexed PCR products (0.5 µl), 9.25 µl of HiDi formamide and 0.25 µl of GeneScan® LIZ standard have been incorporated. After that, the reaction mixture was denatured immediately at 95 °C (5 min) and kept on ice (5 min). Two microliters samples were used to analyze the DNA. The fluorescent dyes such as, PET, VIC, NED and FAM was used and the obtained results were analyzed using genetic analyzer (software version 3.0).
2.4 Statistical analysis
The important parameters such as, number of alleles (Na), locus, expected (He) heterozygosities, observed (Ho) heterozygosities and effective number of alleles (Ne) were evaluated as suggested by Kalinowski et al. (2007) using Cervus version 3.0.3. GenePop was used to find the deviations from Hardy-Weinburg Equilibrium (HWE). Bottlenecks in the locality of population and population size were evaluated using the bottleneck program (Pritchard et al., 2000) to evaluate population structure based on Bayesian multi-locus clustering. Simulations were run and the results from multiple runs for each K were concatenated by clumpp (Evanno et al., 2005).
3 Results and discussion
All the microsatellite primer-pairs successfully amplified 19 SSR markers from the selected markers from the selected Camels. The tested markers, CMS25 and VOLP67 did not yield any result after altering various PCR conditions. The other nineteen microsatellite loci were all polymorphic. The tested various genetic parameters for the population of Maghateer Camel have been described in Table 2. In the tested Camel population showed various alleles per locus and it varied from 4 to 16 which is a good indicator of genetic polymorphism. The allele range obtained in the result was similar with previous results (Nolte et al., 2005; Vijh et al., 2007). However, the range was higher than observations made previously by various research groups (Mehta et al., 2007; Nolte et al., 2005; Vijh et al., 2007) in the analyzed Camel population. This range was very much higher than the results reported by Al-Swailem et al. (2009) in Saudi Camel population and in Kachchhi camel population (Mehta et al., 2007). In a study, Schulz et al. (2010) found 2 to 22 alleles per locus in the Canarian Camels. Likewise, Spencer and Woolnough (2010) reported 5 to 23 alleles per locus in Australian dromedary Camels. It was previously reported that the microsatellite loci should have more than four alleles per locus to minimize standard error (SE) of distance estimates (Li et al., 2002). In general, the average of alleles in a particular population is mainly depend on size of the sample (n) and the availability of unique alleles of very low frequencies. The number of alleles increases gradually when the sample size increases. In a study, Al-Swailem et al. (2009) found 61 alleles with a mean number of alleles per locus (3.81) in Saudi Camels. In Australian Dromedary Camels, 224 alleles with mean 13.18 alleles per locus was reported by Spencer et al. (2010). In another study, Schulz et al. (2010) reported 10.7 alleles per locus in 139 alleles. Among Camel population, 10.3 alleles per locus in 224 alleles was reported by Nolte (2003). In our study revealed a mean of 8.158 alleles in 155 alleles and this is in between previous findings. The locus CVRL06 showed only four alleles and is the least polymorphic, in the case of locus CVRL01, about 16 alleles and showed the most polymorphic SSR marker. In the present study, the average number of alleles (Ne) was reported as 3.599 and the mean Shannon index value was reported as 1.442, the maximum value of Ne in YWLL08 locus was 7.764, and the lowest value of Ne was1.392 in locus VOLP32.Australian camels displayed higher effective number of alleles of 3.44 whereas Bikaneri camels displayed 4.40 as the highest average number of alleles (Mehta and Sahani, 2007; Vijh et al., 2007). Also, heterozygosity value of the reported effective number of the alleles also found to be high. There is a positive relationship between number of alleles at a given locus and number of dinucleotide repeats (Bishop et al., 1994). Heterozygosities also represent a good indicator of genetic polymorphism within breeds. The hetrozygosity level of a microsatellite varies from species to species and sometimes between breeds of the same species (Fatima, 2006). In present study, the expected heterozygosity value of Maghateer Camels populations was 0.667 (Table 2). This value was very much comparable to that of observed values (0.604) in the South African camels which was reported by Nolte et al. (2005). It was 0.633 in the case of Arabian camels and 0.680 in Sudanese Camels (Schulz et al., 2010; Nolte et al., 2005). In Kenyan Camels, it was 0.530, however reduced value was reported in the case of United Arab Emirates camels (0.51) (Mburu et al., 2003). It was marginally increased in the case of Camelus dromedaries and the reported value was 0.544 (Spencer et al., 2010; Spencer and Woolnough, 2010). Table 2 shows the mean observed heterozygosity of the present study (0.717). This observed heterozygosity value was found to be higher than in Australian camel (0.455) and Tunisian camel (0.460) (Spencer and woolnough, 2010; Ould Ahmed et al., 2010). Moreover, in an earlier report the heterozygosity value was found to be 0.552 in Arabian Camel (Schulz et al., 2010). In Mewari, Kutchi, Jaisalmeri and Bikaneri populations, the observed heterozygosity values were found to be 0.600, 0.560, 0.570 and 0.580, respectively (Vijh et al., 2007). The observed and expected heterozygosities reported by Evdotchenko et al. (2003) and Mariasegaram et al. (2002) in dromedary are quite similar to those of present findings. These values of heterozygosity clearly show a significant level of variability in genetic level among Camel population from four populations from Saudi Arabia. Hardy-Weinberg Equilibrium (HWE) has been frequently used to analyze the genetic variation. HWE is defined as a breed with constant genotype and gene frequencies (Falconer and Mackay, 1996). The inbreeding estimate within the population of Camel, which basically reflects the deviation from HWE and the nonrandom union of gametes, showed that there were various genotypes with many loci that followed HWE (P < 0.05). In this investigation, the number of HWE was found to be 12 loci (Table 3). These markers critically indicated an excess and deficiency of heterozygotes, this does not show the variation from HWE. It is well known fact that the migration of various natural processes of nonrandom mating, mutation, genetic drift and both natural selection and artificial selection are critical factors that are well known to induce variations from HWE. It is reported that some loci were usually derived from Hardy-Weinberg Equilibrium and showed that the loci 6, 6, 5 and 11 were not in HWE in the case of Mewari, Kutchi, Jaisalmeri and Bikaneri and statistically significant (P < 0.01). However, the loci 17, 17, 18 and 12 were followed JWE in Mewaricamel, Kutchi, Jaisalmeri and Bikaneri and the reported results were statistically significant (Vijh et al., 2007). A previous study in SaudiArabia using 16 microsatellite markers in Saudi Camel population indicated that half of the loci in the threepopulations were in Hardy-Weinberg Equilibrium (Al-Swailem et al., 2009). Statistical analysis was made on microsatellite to test the Maghateer population having undergone recent genetic bottleneck. The level of genetic variation, population size and historical population sizes are well known and this is used to detect bottlenecks in the absence of historical data. Maghateer population shows number of loci with gene potent diversity, which includes three tests, such as, “Wilcoxons sign-rank test”, “standardized differences test” and “sign test”. The microsatellite model evaluation methods such as, Two Phase Model (TPM), Stepwise Mutation Model (SPM) and InfiniteAllele Model (IAM) were used. In this study, no significant heterozygote excel was found in the Maghateer Camel population by using InfiniteAllele Model, Wilcoxon tests (TPM), standardized differences (SMM) along with the normal L shaped (Fig. 1) distribution of mode-shifttest. Moreover, the previous tests showed no bottleneck inrecent past in Maghateer population (Table 4). ns = not significant, * P < 0.05, ** P < 0.01, *** P < 0.001. Parameters for T.P.M.: Variance = 30.00 of SMM = 70%, Estimation based on 1000 replications, Hee: Heterozygosity excess expected; Hd: Heterozygosity deficiency; P: Probability; IAM: Infinite Allele Model: Two Phase Model; SMM: Stepwise Mutation Model.
Locus
Na
Ne
I
Ho
He
CMS 121
9.000
4.088
1.710
0.720
0.755
CVRL 05
8.000
3.218
1.424
0.680
0.689
VOLP 08
6.000
1.735
0.763
0.480
0.424
YWLL 08
15.000
7.764
2.296
0.600
0.871
YWLL 38
6.000
2.483
1.181
0.580
0.597
CMS17
5.000
2.725
1.176
1.000
0.633
CMS13
7.000
2.317
1.070
0.480
0.568
CMS18
5.000
3.133
1.311
0.980
0.681
CVRL 06
4.000
2.225
1.039
0.700
0.551
LCA 66
9.000
3.283
1.539
0.620
0.695
VOLP 32
6.000
1.392
0.606
0.280
0.282
VOLP 03
9.000
3.113
1.443
0.840
0.679
CVRL07
11.000
6.935
2.080
0.920
0.856
CVRL 01
16.000
3.685
1.971
0.780
0.729
CMS50
11.000
6.098
1.999
0.840
0.836
YWLL44
8.000
2.707
1.295
0.640
0.631
YWLL59
5.000
3.934
1.429
0.840
0.746
YWLL09
6.000
2.960
1.336
0.920
0.662
VOLP10
9.000
4.583
1.722
0.720
0.782
Mean
8.158
3.599
1.442
0.717
0.667
SE
0.754
0.389
0.102
0.043
0.033
Locus
DF
ChiSq
Prob
Signif
CMS 121
36
31.165
0.698
ns
CVRL 05
28
66.334
0.000
***
VOLP 08
15
2.315
1.000
ns
YWLL 08
105
245.923
0.000
***
YWLL 38
15
79.522
0.000
***
CMS17
10
50.000
0.000
***
CMS13
21
9.890
0.980
ns
CMS18
10
55.457
0.000
***
CVRL 06
6
10.313
0.112
ns
LCA 66
36
96.375
0.000
***
VOLP 32
15
51.389
0.000
***
VOLP 03
36
204.861
0.000
***
CVRL07
55
205.480
0.000
***
CVRL 01
120
77.680
0.999
ns
CMS50
55
49.987
0.666
ns
YWLL44
28
11.623
0.997
ns
YWLL59
10
51.827
0.000
***
YWLL09
15
32.282
0.006
**
VOLP10
36
103.992
0.000
***
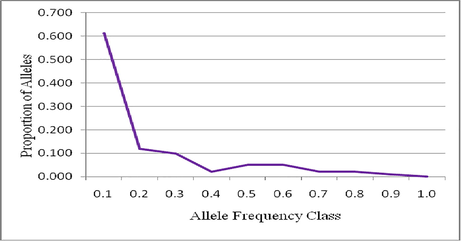
Proportion of alleles and their frequencies in Maghateer population.
Maghateer
Models
Sign test
Standarized
Wilcoxon Test
IAM
Hee = 8.71
T2 = 0.240
P (One tail for H deficiency) 0.80530
Hd = 6
P = 0.40509
P (One tail for H excess)0.21060
He = 9
P (Two Tail for H excess and difiency) 0.42120
P = 0.54817
TPM
Hee = 8.88
T2 = −2.848
P (One tail for H deficiency) 0.08441
Hd = 11
P = 0.0000
P (One tail for H excess) 0.92429
He = 4
P (One tail for H excess and defiency) 0.16882
P = 0.01109
SMM
Hee = 8.85
T2 = -8.550
P(One tail for H deficiency) 0.00021
Hd = 13
P = 0.0000
P(One tail for H excess) 0.99985
He = 2
P(Two tail for H excess and deficiency) 0.00043
P = 0.00037
Structure revealed, for the 50 individuals of Maghateer camel with no prior distribution, that ΔK has a strong peak at K = 4, suggesting that the optimal number of clusters was 4 (Fig. 2a). In the Fig. 2b, the colors represent four clusters. Each bar in the graph represents an animal and its inferred proportion of genome admixture. The proportion of membership in each of the 4 clusters was 20%, 44%, 26% and 10% for the shoun red, green, blue and yellow cluster, respectively. Within the bar plot, the coefficient for each individual indicates clearly unique ancestral genomes for each of the two first cluster. However, the two last ones appear sharing allele frequencies which indicate low of genetic differentiation and extensive gene flow between these two clusters. The values of nucleotide sequences based on frequencies of allele divergence among the selected populations, confirm these observations. In fact, the highest values were recorded between the first cluster and the others (d1-2 = 0.6%, d1-3 = 0.38%, d1-4 = 0.35%). However, the lowest values were recorded between the two last clusters (d3-4 = 0.002%).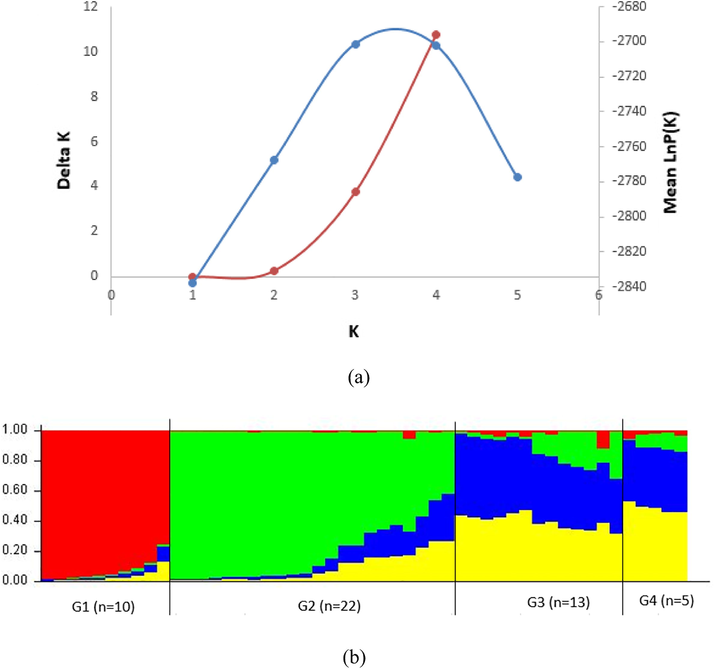
(a) Plot of two graphical methods allowing detection of the true value for K. Blue represent the mean of LnP(k) over 8 runs for each K value analyzed the increase of the variance associated to LnP(D) across different K values tested. Red represents the values of ΔK calculated, based on the methodology proposed by Evanno et al. (14). (b) Bar plot of estimation of the membership coefficient (Q) for each individual of Maghateer camels. Each individual is represented by a thin vertical line, which is partitioned into K colored segments that represent the individual's estimated membership fractions in K clusters. Black lines separate individuals of different clusters based on structure analysis. Population groups are labeled below the figure, with their geographical affiliations above it. The figure shown for K = 5 is based on the highest probability run at that K.
4 Conclusion
Nevertheless, these fifteen microsatellite markers proved useful to detect genetic variability in Majaheem camel populations in Saudi Arabia, thus can be effectively used to analyze the diversity in genetic level in Saudi Arabian Camels. Also, very large sampling of all Camels in Kingdom of Saudi Arabia are required to establish a state of art genetic analysis for genotyping and analyzing the Saudi Arabian Camel population.
Acknowledgement
This Project was funded by the National Plan for Science, Technology and Innovation (MAARIFAH), King Abdulaziz City for Science and Technology, Kingdom of Saudi Arabia, Award Number (12-AGR2924-02).
Declaration of Competing Interest
The authors declare that they have no known competing financial interests or personal relationships that could have appeared to influence the work reported in this paper.
References
- Study of the Biometry of some breeds of Arabian Camel (Camelus dromedarius) in Saudi Arabia. J. King Abdulaziz Univ. Sci.. 1994;6:87-99.
- [Google Scholar]
- Evaluation of the genetic variability of microsatellite markers in Saudi Arabian Camels. J. Food Agric. Environ.. 2009;7:636-639.
- [Google Scholar]
- Detecting the number of clusters of individuals using the software structure: a simulation study. Mol. Ecol.. 2005;14:2611-2620.
- [Google Scholar]
- New polymorphic microsatellite loci for different camel species. Mol. Ecol. Notes. 2003;3:431-434.
- [Google Scholar]
- Falconer, D.S., Mackay, T.F.C., 1996. Introduction to Quanitative Genetics.
- FAO Domestic Animal Diversity Information System (DAD-IS 2.0): http://dad.fao.org/dad- is/home.htm.2000.
- FAO-statistics, 2012. http://faostat.fao.org/.
- Study of Genetic Variability among Gohilwadi, Surti and Zalawadi Goats using Microsatellite Analysis. College of Veterinary Science and Animal Husbandry. Anand Agricultural University; 2006. (MVSc. thesis)
- Revising how the computer program CERVUS accommodates genotyping error increases success in paternity assignment. Mol. Ecol.. 2007;16:1099-11006.
- [Google Scholar]
- Genetic Relationships among twelve Chinese indigenous goat populations based on microsatellite analysis. Genetic Sel. Evol.. 2002;34:729-744.
- [Google Scholar]
- isolation and characterization of eight microsatellite markers in Camelus dromedaries and cross species amplification in C. bactrainus and Lama pacos. Anim. Genet.. 2002;33:385-387.
- [Google Scholar]
- Genetic diversity and relationships of indigenous Kenyan camel (Camelus dromedarius) populations: implications for their classification. Anim. Genet.. 2003;34:26-32.
- [Google Scholar]
- Microsatellite markers for gentic characterisation of Bikaneri camel. Indian J. Anim. Sci.. 2007;77(6):509-512.
- [Google Scholar]
- Microsatellite markers for genetic characterization of Kachchhi camel. Indian J. Biotechnol.. 2007;6:336-339.
- [Google Scholar]
- Musthafa, M.M., 2015. A review of microsatellite marker usage in theassessment of genetic diversity of camelus. Iran. J. Appl. Anim. Sci. 5(1) 1-4.55: (1), 1-4.
- The genetic characterization of Camelus dromedarius in Southern Africa. Department of Zoology, Rand Afrikaans University, Johannesburg; 2003. (MSc thesis)
- Microsatellite markers reveal low genetic differentiation among Southern African Camelus dromedarious population. South Afr. J. Anim. Sci.. 2005;35:152-161.
- [Google Scholar]
- Genetic diversity in Tunisian dromedary (Camelus dromedarius) populations using microsatellite markers. Livest Sci.. 2010;132:182-185.
- [Google Scholar]
- Inference of population structure using multilocus genotype data. Genetics. 2000;155:945-959.
- [Google Scholar]
- Assessment and genetic characterization of Australian camels using microsatellite polymorphism. Livestock Sci.. 2010;129:241-245.
- [Google Scholar]
- Parentage testing of racing camels (Camelus dromedarius) using microsatellite DNA typing. Anim. Genet.. 2010;41:662-665.
- [Google Scholar]
- Genetic Diversity and Differentiation of Dromedarian camel of India. Anim. Biotechnol.. 2007;18:81-90.
- [Google Scholar]


