

Translate this page into:
Genetic analysis of honey bee, Apis dorsata populations using random amplified polymorphic DNA (RAPD) markers
⁎Corresponding author. samianbee@gmail.com (Samina Qamer)
-
Received: ,
Accepted: ,
This article was originally published by Elsevier and was migrated to Scientific Scholar after the change of Publisher.
Peer review under responsibility of King Saud University.
Abstract
The study was planned to evaluate the genetic variation and migration rate among the two populations of giant honey bees “Apis dorsata” from two districts i-e Nankana and Narowal from Punjab, Pakistan at molecular level by using Randomly Amplified Polymorphic (RAPD) DNA marker technique. Worker bee samples of A.dorsata were collected from five different sites of two districts each. Then, DNA was extracted. The data obtained after ten oligonucleotides RAPD primer usage for Polymerase Chain Reaction amplification was subjected to POPGENE (Population Genetic Analysis) software for analysis. The number of amplifications products per primer varied from 5 to 8 bands with molecular weight ranging from 200 to 300 bp with normally 5 bands each primer. Mostly, all the samples showed monomorphic bands except for few samples (Nan1, Nar1 and Nar5). Genetic diversity ranged from 0.147 in Nankana (Nm = 3.356) to 0.181 in Narowal (Nm = 3.751), with total heterozygosity 0.452 (Nm = 0.452). Dendrogram revealed two groups; interestingly Narowal sample, Nar1 showed close relatedness with Nankana samples. The results indicate that there is low level of genetic variation both in and between A. dorsata populations from Nankana and Narowal. In addition, Nm value shows that there is quite small level of migration existed. Further genetic investigations including gene flow and genetic affinity are needed to preserve the biodiversity of A. dorosata of these areas to preserve the biodiversity of the endemic races of honey bees in south East Asian region.
Keywords
Apis dorsata
RAPD maker
Molecular diversity
Molecular markers

1 Introduction
Honey bees are the beneficial insects for the man kind in two aspects. Firstly they produced honey, a natural food, and secondly, carried the most important task of crop pollination and wild flowers for sustainable agriculture and food supply. It is an important model organism for behavioral research because it is a colonial insect with complex social behavior and contains a vast undiscovered genetic diversity and gene pool that can be better explored using molecular marker techniques (Dempster and McLean, 1999, Alattal et al., 2019). Pakistan has four well recognized honey bee species namely A. cerana, A. dorsata, A. florea. While, A. mellifera, was introduced in 1977 for commercial beekeeping in the country. Although, genetically less focused A. dorsata contributes little towards honey production however, its ecological role in pollination cannot be denied. Apis dorsata was first described by Fabricius, 1793 which was later reintroduced by Maa, 1953. Finally Ruttner in 1988 stated that it appeared very homogenous (Radloff et al., 2010). It is found in Pakistan including other south eastern Asian countries and Philippines (Ruttner, 1988; Paar et al., 2004). It forms giant combs usually 3-4ft in length and 2-3ft wider in open places at a height of 1000 m-3000 m (Qamer et al., 2008; Hepburn and Radloff, 2011). This bee is wild in nature and cannot be domesticated. It shows aggressive behaviour. Usually local people harvested it honey by cutting the most part of the comb from the branch as its hives are major source of earnings (Ruttner, 1988). Due to eco-friendly role, knowledge of genetic diversity levels and population subdivisions of A. dorsata in Pakistan is important for understanding, distribution patterns and colonization of this species. Its conservation is also important from a biodiversity perspective, where a priority is laid on preserving the endemic races of honey bees in south East Asian region. Ecological environments are important causes of gene flow restriction, which results in genetic differentiation (Sobierajska et al., 2016; Yu et al., 2019).
RAPD markers are the best and very valuable for the genomic and taxonomic study of insect population (Issa et al., 2013; Slathia et al., 2017) and RAPD-PCR is measured as a modest technique designed for genetic distinction assessment of organisms compared to other molecular methods (Issa et al., 2013). RAPD primers produce several bands fragments, which are normally formed as of different areas of the genome, in this way number of several loci might be detected very quickly (El-Bermawy et al., 2012). RAPDs are mostly important to find hereditary pattern of any inhabitants, as these markers could expose polymorphisms in non-coding parts of the DNA (Jain et al., 2010; Shivashankar et al., 2013). It is also used to differentiate physically and naturally isolated populations (Slathia et al., 2017). The study was planned to discover genetic differentiation in A. dorsata from two districts (Nankana and Narowal) to explore its origin and the evolution of particular characteristics in various ecological environments in order to conserve this natural genetic source.
2 Materials and methods
2.1 Samples collection and identification
Firstly five different locations were selected in both districts (Fig. 1). Then 30 A. dorsata worker bees were obtained per each site from both district (Nankana and Narowal). Plastic bottles containing 50% alcohol were used for sample preservation indicating sample and hive number, collecting site with date and kept at 4 °C for extraction of DNA (Issa et al., 2013). Identification of honey bee species was carried out by using key given in Asian Honey Bees (Oldroyd and Wongsiri, 2006).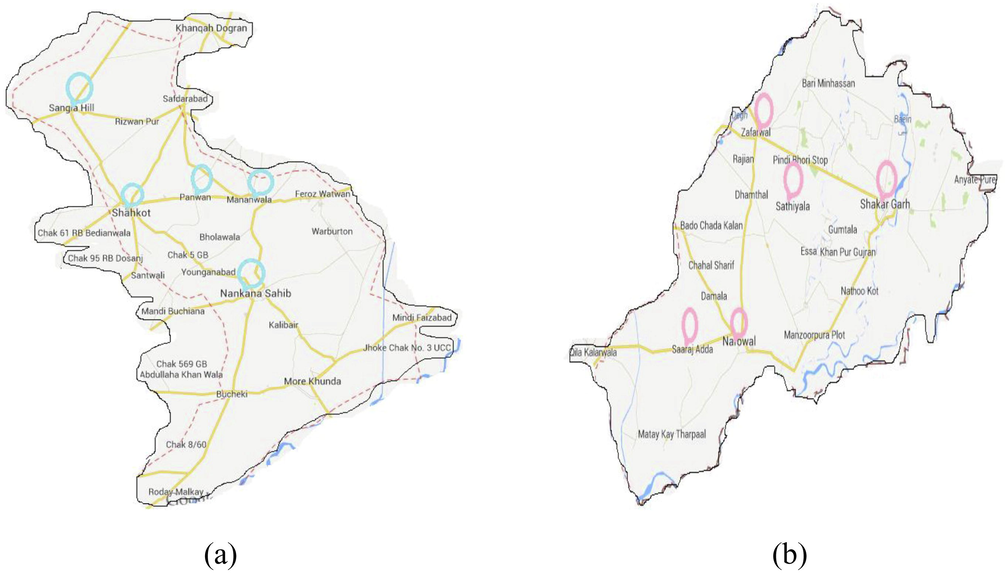
The circled areas are indicating the collection sites from (a) Nankana and (b) Norowal districts.
2.2 DNA extraction
Thorax has been separated and crushed for taking out of DNA according to Kamrani et al., 2012. Lysis solution of 12.5 ml made up of NaCl 100 mM, Tris-HCl 10 mM (pH 8.0), EDTA 1 mM, and 0.5% SDS was added in these each homogenized sample. This mixture was incubated at 37 °C in shaker for 1.5 h after adding 5 µl of 20% Proteinasa-K (Proteinase-K 20 µl/ml). The DNA from sample was extracted two times with 12.5 ml solution of Phenol-Chloroform-Isoamyl (25:24:1), centrifuged at 6000 rpm for 10 min. Cold Isopropanol or two volumes of cold absolute Ethanol was added equally to collect DNA by keeping the tubes at −21° C for 2 h at least. Centrifugation was carried out for 10 min., when the pellet formed, cold Ethanol (70%) was used for wash the DNA pallet and then dried it. DNA obtained was re-suspended in sterile water (50 µl). Wavelength of 260 nm was used to assess DNA quantity whereas, its quality was tested on 1 percent (%) agarose gel electrophoresis (Kamrani et al., 2012; Yu et al., 2019).
RAPD-PCR analysis. PCR amplification was conducted by using Ten Gene Link-A series RAPD primers. For each PCR reaction final volume of 25 µl included nearly 3 mM of MgCl2, 100 mg of genomic DNA, 0.3 mM of each dNTPs, 20 pmol of primer, Taq DNA polymerase (1.0 units) and 2.5 µl buffer. The PCR program consist of 35 rounds for primary DNA denaturing and annealing at 94 ˚C and 36 ˚C for 1 and 1.5 min, respectively. Similarly, initial for 1.5 min and then final extension at 72 ˚C for 10 min was done, then eppendroff tubes were held at 4 ˚C till removed. Gel electrophoresis with1.6% agarose at 80 voltages for one hour were the experimental conditions to run PCR products (Slathia et al., 2017).
2.3 Data analysis
The imprints were studied in UV Transilluminator and took pictures by gel documentation system (SynGene). DNA marker was used to read the position of the amplified bands (loci). The bands were counted as present (1) or absent (0) for each sample. Unclear fragments which were not visibly distinguished were not considered. The bands were counted starting from top to the bottom in all lanes. The RAPD markers were analyzed using the following assumptions: (1) The alleles (RAPD alleles) segregate following a Mendelian genetics fashion; (2) the bands which co-migrate are homologous; (3) different loci segregate independently and (4) populations are in Hardy-Weinberg equilibrium (Ayres et al., 2002). A dendrogram was constructed using unweighted pair-group mean analysis (UPGMA) (Nei 1978). Effective migration rates (Nm) were estimated based on inbreeding indices (GST) where Nm = 0.5 (1-GST)/GST (McDermott and McDonald, 1993). Calculations were performed with the help of the POPGENE (version 1.32) software.
3 Results and discussion
Apis dorsata population’s analysis was carried out by RAPD-PCR method using 10 oligonucleotide primers. Out of these ten, four nucleotide sequences used further as primer to which can create dissimilar and easily noticeable bands (Table 1). Only reproducible bands were used for analysis which formed over repeated PCR reactions. The number of DNA fragments produced by each primer ranged from 6 to 12, with an average of 8.0 bands/primer of molecular weight fluctuating between 2000 and 200 bp size (Table 1 and Fig. 2). Very few amplified fragments discriminated the populations of A. dorsata from Nankana and Narowal (Lane 1–5: Nankana and Lane 6–10: Narowal). The quantity of polymorphic DNA segments amplified by each primer ranged between 17.5 and 27% (data not shown).
Sr No.
Primers
Nucleotide sequence
size (bp)
No
1
OPA-07
5′GCTGCTCGAGT3′
200–3000
8
2
Moh-13
5′GAAACGGGTG3′
200–2500
7
3
A-06
5′AGTCAGCCAC 3′
200–1500
5
4
A-04
5′- AATCGGGCTG 3′
250–1350
6
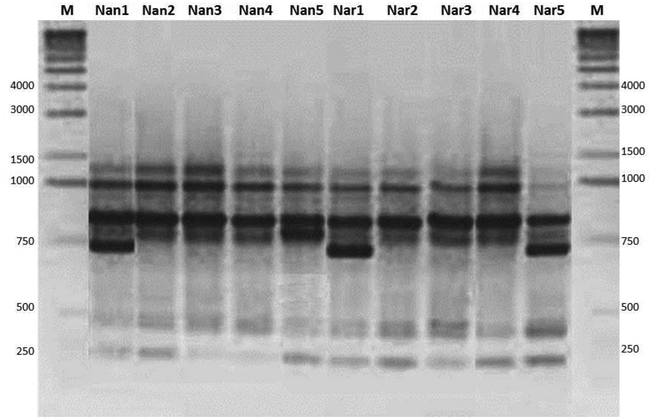
Amplification profile of Apis dorsata populations with primer A-04 by RAPD-PCR from Nankana and Narowal. Marker: 1 Kb ladder. (L1-5: Nankana samples, L6-10: Narowal samples, Lane M = DNA Marker (size 1 kb).
Total 21 randomly polymorphic segments of DNA were recorded from all honey bee samples, at an average of 2.5 polymorphic loci per primer (data not shown). Mostly, the primers produced monomorphic banding pattern with a few polymorphic bands. Nei’s analysis was used to estimate the non-relatedness, flow of gene and the variation between 18 populations of honey bees. The genomic diversity varied from 0.254 in Nankana to 0.320 in Narowal with a total heterozygosity of 0.452. The GST value for all the populations within Nankana was 0.147 (Nm = 3.356), however, for Narowal GST value was 0.181 (Nm = 3.751), respectively. The whole hereditary variation amongst thirty populations presented GST = 0.516 and no. of migrants Nm = 0.814 (Table.2). Gene flow based on Nm values from Nankana and Narowal and the monomorphic loci showed involvement of mutual gene group between unlike populations (at the border of the city). The population samples from the main city showed monomorphic bands compared to the populations at the border of the city. A close level of polymorphism showed low level of deviation in A. dorsata populations, proposing a somewhat homogeneousness in A. dorsata populations from Nankana and Narowal.
Populations
Genetic variations (GST)
Gene flow (Nm)
Heterozygosity (Ht)
Nankana
0.147
3.356
0.254
Narowal
0.181
3.751
0.320
Nankana-Narowal
0.516
0.814
0.452
3.1 Cluster analysis
The UPGMA (Unweighted Pair Group Method and Arithmetic Mean) dendrogram based on similarity matrix of Nei’s genetic distances (1978) demonstrates two groups for all samples (Fig. 3). One group (A) shows six populations and two subgroups, i.e. one subgroup comprising of Nan2 and Nan3; one subgroup of Nan5 and Nan4 from district Nankana. All the collected samples (sites) showed a monomorphic banding pattern with each other except three samples (Nan1, Nar1 and Nar5) (Fig. 2). The other group (B) comprised of one subgroup with Nar2 and Nar3 found closely related. This clade then showed relatedness to Nar4 and Nar5, respectively. Interestingly, Narowal sample, Nar1 showed more closeness to Nankana samples. Thus, the populations of both Nankana and Narowal showed genetic similarity. This relatedness among different populations revealed that Apis dorsata populations are dispersing or migrating among these sites along with a certain level of gene flow (Fig. 2; Nm and GST; Table 2). Most probably, the genetic similarity could be due to the transportation and the dispersal of A. dorsata honey bees in these areas. The relatedness between certain populations in Nankana and Narowal populations and the Nm (gene flow) value for an estimate of gene flow shows that the A. dorsata populations exhibit gene flow. Moreover, mostly the homogeneity pattern was observed in many population samples. Thus, the monomorphic bands indicated low divergence between the sites and more gene flow among all the populations (low polymorphism; Table 2).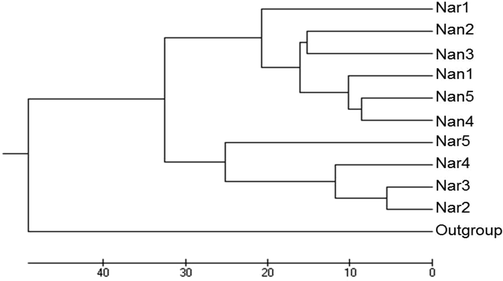
Dendrogram based on Nei’s genetic distances between Apis dorsata populations from Nankana and Narowal. The dendrogram demonstrates two groups. Group A: consists of six populations and two subgroups, i.e. Nan2 and Nan3 from district Nankana were found closely related to each other. Similarly, Nan5 and Nan4 were closely related. This subgroup then related to Nan1. Both subgroups were related to Narowal site Nar1. Group B: comprising of Nar2 closely related to Nar3 and this sub-group related to Nar4 and then sub-group of these 3 sites from district Narowal related to Nar5.
The study of species diversity at molecular level provides the blue print regarding the expressions of genes at intra-colonial genomic variation caused due to different ecological habitats, which in turns gives a clue about the overall health and easy weight gain by honey bees, resistance to disease by honey bee colony, declining the possibility of inviable worker brood and the efficiency of a colony’s labour force. The current work is to a certain extent correlated to the work of Kamrani et al., (2012) of Iran using same primers (Moh-13 and OPA-07). In a related investigation carried out using (OPA-07, 0 PB-01-OPB-09) primers on Turkish populations of A. mellifera by Tunca and Kence (2011) exposed the genomic variety by producing shinny bands. Montero-Mendieta et al., 2019, Yancan et al., 2019, Yu et al., 2019, Chakrabarti et al., 2018, Chen et al., 2018, Diao et al., 2018, conducted molecular studies on A. cerana honey bee. Slathia et al., 2016 used RAPD technique to investigate genetic variation among species of genus Apis including A. dorsata, although by using primers with different nucleotide sequence. AL attal et al., 2019, Yogesh and Khan, 2014, Issa et al., 2013 worked out genetic variation in A. mellifera.
4 Conclusion
The acquired banding pattern from Nankana and Narowal districts revealed polymorphism. Mostly, all the samples showed monomorphic bands except for few samples (Nan1, Nar1 and Nar5). Dendrogram revealed two groups; interestingly Narowal sample, Nar1 showed close relatedness with Nankana samples. Genomic differences were found in the similar species from various areas in terms of polymorphic bands with varying molecular weight and size with same primers. After the present research, it is clear that, increased genetic diversity within colonies provides them with several benefits, and thus should be viewed as a trait with pluralistic sequences. Future work should determine the impact of other parasites and pathogens and the relative fitness benefits on honey bee’s diversity.
Acknowledgements
This study is conducted under the HEC (Pakistan) funded project No 4952-14. The authors also extend their appreciation to the Researchers supporting project number (RSP-2020/94) King Saud University, Riyadh, Saudi Arabia.
Declaration of Competing Interest
The authors declare that they have no known competing financial interests or personal relationships that could have appeared to influence the work reported in this paper.
References
- Characterization of Socotra (Yemen) honey bees (Apis mellifera) using morphometric and genetic markers. Bull. Insectol.. 2019;72(2):281-285.
- [Google Scholar]
- Genetic diversity inBrazilian populations of Aedes albopictus. Memórias do Instituto Oswaldo Cruz. 2002;97(6):871-875.
- [Google Scholar]
- Field populations of wild Apis cerana honey bees exhibit increased genetic diversity under pesticide stress along an agricultural intensification gradient in Eastern India. J. Insect Sci.. 2018;18(3):1-8.
- [Google Scholar]
- Population genomics provide insights into the evolution and adaptation of the eastern honey bee (Apis cerana) Mol. Biol. Evol.. 2018;35(9):2260-2271.
- [Google Scholar]
- Genomic and transcriptomic analysis of the Asian honeybee Apis cerana provides novel insights into honeybee biology. Sci. Rep.. 2018;8(1):1-14.
- [Google Scholar]
- Insect population; In theory and in practice. Boston Massachusetts: Kluwerpublisher; 1999.
- Biochemical and molecular characterization for three subspecies of honey bee worker, Apis mellifera L. (Hymenoptera: Apidae) in Egypt. Egyption Academic Journel of Biological Sciences. 2012;5(2):103-115.
- [Google Scholar]
- Fabricius JC (1793) Entomologia systematica emendata et aucta. Secundum classes, ordines, genera, species adjectis synonimis, locis, observationibus, descriptionibus. Hafniae, Proft [in Latin, cited from Maa 1953]
- Genetic Characterization of Honey bees (Hymenoptera: Apidea) Populations from North West of Iran Using RAPD Markers. Tech. J. Eng. Appl. Sci.. 2012;2(12):430-435.
- [Google Scholar]
- Issa1, M.R.C. , Figueiredo, V.L.C., De Jong, D., Sakamoto, C.H., and Simões, Z.L.P.,(2013). Rapid method for DNA extraction from the honey bee Apis mellifera and the parasitic bee mite Varroa destructor using lysis buffer and proteinase K. Genetics and Molecular Research 12 (4): 4846-4854.
- The genomic basis of adaptation to high-altitude habitats in the eastern honey bee (Apis cerana) Mol. Ecol.. 2019;28(4):746-760.
- [Google Scholar]
- Genetic structure of an Apis dorsata population: the significance of migration and colony aggregation. J. Hered.. 2004;95(2):119-126.
- [Google Scholar]
- Hepburn, H.R and Radloff, S.E. (2011) (eds.), Honeybees of Asia, Springer-Verlag Berlin Heidelberg DOI 10.1007/978-3-642-16422-4_8
- An inquiry into the systematics of the tribus Apidini or honeybees (Hymenoptera) Treubia. 1953;21:525-640.
- [Google Scholar]
- Estimation of average heterozygosity and genetic distance from a small number of individuals. Genetics. 1978;89:583-590.
- [Google Scholar]
- Asian Honey Bees: Biology, Conservation, and Human Interactions. Published by Harvard University Press; 2006.
- Biogeography and Taxonomy of Honeybees. 284: Springer-Verlag; 1988.
- Physicochemical analysis of Apis dorsata honey bee of terai forest, Nepal. Pakistan J. Zool.. 2008;40(1):53-58.
- [Google Scholar]
- Heterogeneity in honeybees populations of india revealed by RAPD analysis. J. Chem. Biol. Phys. Sci.. 2013;3(2):1155-1159.
- [Google Scholar]
- Genetic diversity among bees as detected by random amplified polymorphic DNA marker. World J. Zool.. 2016;11(3):148-153.
- [Google Scholar]
- Effect of the Aegean Sea barrier between Europe and Asia on differentiation in Juniperus drupacea (Cupressaceae) Bot. J. Linn. Soc.. 2016;180(3):365-385.
- [Google Scholar]
- Genetic diversity among bees as detected by random amplified polymorphic DNA markers. J. New Biol. Rep.. 2017;6(1):6-11.
- [Google Scholar]
- Genetic diversity of honey bee (Apis mellifera L.: Hymenoptera: Apidae) populations in Turkey revealed by RAPD markers. Afr. J. Agric. Res.. 2011;6(29):6217-6225.
- [Google Scholar]
- Population genomics and morphological features underlying the adaptive evolution of the eastern honey bee (Apis cerana) BioMed Central Genom.. 2019;20(1):869.
- [Google Scholar]
- Genetic variability of European honey bee, Apis mellifera in mid hills, plains and tarai region of India. Afr. J. Biotechnol.. 2014;13(8):916-925.
- [Google Scholar]
- Genetic differentiation of Eastern Honey Bee (Apis cerana) populations across Qinghai-Tibet Plateau-Valley landforms. Front. Genet.. 2019;10:483.
- [Google Scholar]


