

Translate this page into:
Frequency ratio model for groundwater potential mapping and its sustainable management in cold desert, India
⁎Corresponding author. Fax: +91 22 25525890. gurubala.jtcdm@gmail.com (Balamurugan Guru)
-
Received: ,
Accepted: ,
This article was originally published by Elsevier and was migrated to Scientific Scholar after the change of Publisher.
Peer review under responsibility of King Saud University.
Abstract
Groundwater potential mapping and its sustainable development are an important aspect in Leh valley due to an increase of tourists and the local population. In the present study, the groundwater potential zones were delineated by adopting a frequency ratio (FR) model. Land use and land cover, hydro geomorphology, slope, geology, lineament density, drainage density, spring well locations and ground water level were the thematic factors considered for groundwater potential zone mapping. There are 86 spring wells located in the study area, of which 60 wells were considered for success rate and remaining 26 wells considered for prediction rate in the FR model. The final groundwater potential map was classified into five zones as very high, high, moderate, low, and very low. The success and prediction rates of FR model were measured as 81.25% and 77.23% respectively. Water budget of the valley was also calculated on the basis of consumption, demand and supply of water by taking account of the floating population. There is a huge demand of water supply requirement during the tourist season from May to September months and deficiency of water in the area was calculated as 4,224,557 (in l). Finally, suitable sites for artificial recharge for sustainable groundwater management were identified. The sites were selected on the basis of depth of groundwater level, source of spring well locations and gradient from natural spring to selected recharge wells.
Keywords
Groundwater potential zone mapping
Frequency ratio
Water budget
Sustainable management
Leh valley

1 Introduction
Over the last few decades, areas with varying demographics and economic reliance have been forced into the ‘water crisis’, which has to be topmost among the many crises staring us in the face. In fulfilling the water needs of the majority of the population in India, groundwater resources have the highest priority. Groundwater is less vulnerable than surface water sources to climate fluctuations in an undisturbed aquifer system and therefore, acts as a key buffer against drought and normal variations in rainfall. Reliable supply of groundwater lead input for increasing yields, reducing agricultural risk, stabilizing farm incomes and thus leading to higher levels of social and economic security (Moench, 2003). Groundwater exploration entails delineation and mapping of different lithological, structural and geomorphologic units (Solomon and Quiel, 2006). In fluvio-glacial regions particularly outwash plains, valley fills and buried outwash are indicators for source of groundwater potential (Thornbury, 1969). Groundwater obtained from fluvio-glacial region is utilized for domestic and industrial purposes in many cities among the world such as Champaign, Urbana, Illinois, Canton, Ohio (White et al., 1946), Schenectady, New York (Simpson, 1949) etc. In hard rock terrain, the task of groundwater potential mapping becomes a relatively more complex task involving complex decisions owing to lack of reliable data and the highly variable nature of the geological environment (Kellgren, 2002; Anbazhagan et al., 2011). Groundwater in hard rock aquifers is essentially restricted to fractured horizons as the movement of water is mostly through these fractures. Therefore, extensive hydro geological investigations are required to thoroughly understand groundwater conditions in hard rock region (Krishnamurthy et al., 2000; Solomon and Quiel, 2006; Balamurugan et al., 2008; Pradhan, 2009; Anbazhagan et al., 2015) to delineate the groundwater potential zones (GWPZ) through remote sensing (RS) and Geographical information systems (GIS), which act as powerful tools and several studies have been carried out in different parts of the world (Evans and Myers, 1990; Saraf and Choudhury, 1998; Panagopoulus et al., 2005; Rai et al., 2005; Sener et al., 2005; Singh and Singh, 2009; Yan et al., 2010; Biswas et al., 2012; Hammouri et al., 2012; Kuria et al., 2012; Sharma and Kujur, 2012; Sudarsana, 2012; Anbazhagan and Jothibasu, 2014). The identification of GWPZ using remote sensing and GIS techniques involves interpretation of various themes such as vegetation, land use land cover, hydro geomorphology, drainage, lithology, subsurface lithology, structure, slope etc. which have been used in inferring the occurrence of groundwater (Hung et al., 2002; Xiuwan, 2002; Shaban et al., 2006). In hard rocks, which has low or absence of primary porosity, the intersections of secondary structural features are crucial for productive groundwater well (Kumanan and Ramasamy, 2003; Balamurugan et al., 2008). There are various statistical methods that were adopted for groundwater potential zone mapping such as frequency ratio (Davoodi et al., 2013; Manap et al., 2014; Pourtaghi and Pourghasemi, 2014; Naghibi et al., 2015), multi-criteria decision evaluation (Murthy and Mamo, 2009; Kumar et al., 2014; Rahmati et al., 2014; Machiwal and Singh, 2015; Razandi et al., 2015; Jothibasu and Anbazhagan, 2016), logistic regression model (Ozdemir, 2011; Pourtaghi and Pourghasemi, 2014), weights-of-evidence model (Ozdemir, 2011; Pourtaghi and Pourghasemi, 2014), random forest model (Rahmati et al., 2016; Naghibi et al., 2016; Zabihi et al., 2016; Naghibi and Pourghasemi, 2015), maximum entropy model (Rahmati et al., 2016), boosted regression tree (Naghibi et al., 2016; Naghibi and Pourghasemi, 2015), classification and regression tree (Naghibi et al., 2016), multivariate adaptive regression spline model (Zabihi et al., 2016), certainty factor model (Zabihi et al., 2016), evidential belief function (Pourghasemi and Beheshtirad, 2015; Naghibi and Pourghasemi, 2015), and generalized linear model (Naghibi and Pourghasemi, 2015). These statistical methods were used to carry out the GWPZ based on different influencing parameters, their interconnection and contribution to the groundwater movements and accumulations.
Artificial groundwater recharge is a process by which groundwater reservoir is augmented at a rate exceeding what is the case under natural conditions of replenishment (Bhattacharya, 2010). Augmentation of this natural infiltration of water either from precipitation or surface or snow melting, into underground formations can be achieved by various methods such as water spreading, recharge through pits, shafts, injection wells, trenches, snow harvesting, check dams cum groundwater dams. Many research studies have been carried out on artificial recharge sites selection for aquifer replenishment in various parts of the world (Johnson and Sniegocki, 1967; Warner and Moreland, 1972; Ramasamy and Anbazhagan, 1997). In the last few decades, remote sensing and GIS techniques play an important role for identification of suitable sites for artificial recharge structures for sustainable groundwater resource management (Anbazhagan et al., 2005; Jasrotia et al., 2007; Muthukrishnan and Manjunatha, 2008; Nagarajan and Singh, 2009; Hossein et al., 2014). The geological, subsurface geological, geomorphological, slope, drainage, structures and hydrogeological parameters were analyzed in the process of suitable site selection for artificial recharge.
The present study is focused on GWPZ mapping and its sustainability of Leh valley which has historically been a low precipitation area as <100 mm per annum. In 1974, this area was opened for tourists and since then has seen a steady rise in visitor’s number over the decades, especially during the last few years. As per the tourism and labor department information, the number of the tourist population in 1974 was 527 which has risen to 179,491 in 2011. As an inevitable consequence, the water demand has suddenly gone up and pressure on natural resources of the region, especially groundwater, has increased exponentially. In such a scenario, it becomes important to delineate the GWPZ in the area and identify the suitable sites for artificial groundwater recharge. In an attempt to achieve this target, the study has encompassed several objectives such as to develop groundwater potential zonation map, calculate the water budget and to identify the suitable sites for artificial groundwater recharge based on their relative properties with springs present in the study area. The study was carried out through an integrated Remote Sensing, GIS techniques, and field investigation. The frequency ratio (FR) method was adopted for GWPZ mapping.
2 Study area
The Leh district of the Ladakh region also known as “Cold Desert” is one of India’s most elevated, coldest, mountainous and sensitive places and lies in the higher Himalayan range. Leh is situated in between 34°00′N to 34°20′N latitude and 77°32′E to 77°40′E longitude and at an altitude of 3524 m (11,562 ft). The study area situated at a distance of 434 km from Srinagar and 474 km from Manali. Leh and Srinagar are connected by National Highway (NH) of 1D. It is bounded by Pakistan in the northwest, Kargil in the west, China in the north and eastern part, and Lahaul Spiti of Himachal Pradesh in southeast (Fig. 1). According to the census of 2001, the local population was 117,232 which has gone up to 147,104 in 2011. This region is dominated by both arctic and desert climate and the main features of this “Cold Desert” are wide diurnal and seasonal fluctuations in temperature with −40 °C in winter and +30 °C in summers. The average annual rainfall in this region is less than 100 mm. However, the study area also received the highest rainfall of 142.50 mm in 2008 and the lowest rainfall of 18.20 mm in 2007 (Fig. 2). This study is mainly focused on the area from the lower reaches of the Leh valley starting near the Indus River and upward toward the Gyamtsa and Gangles sides on the upper portions of the valley. Agriculture is the main source of livelihood in the study area and wheat and barley are the main crops.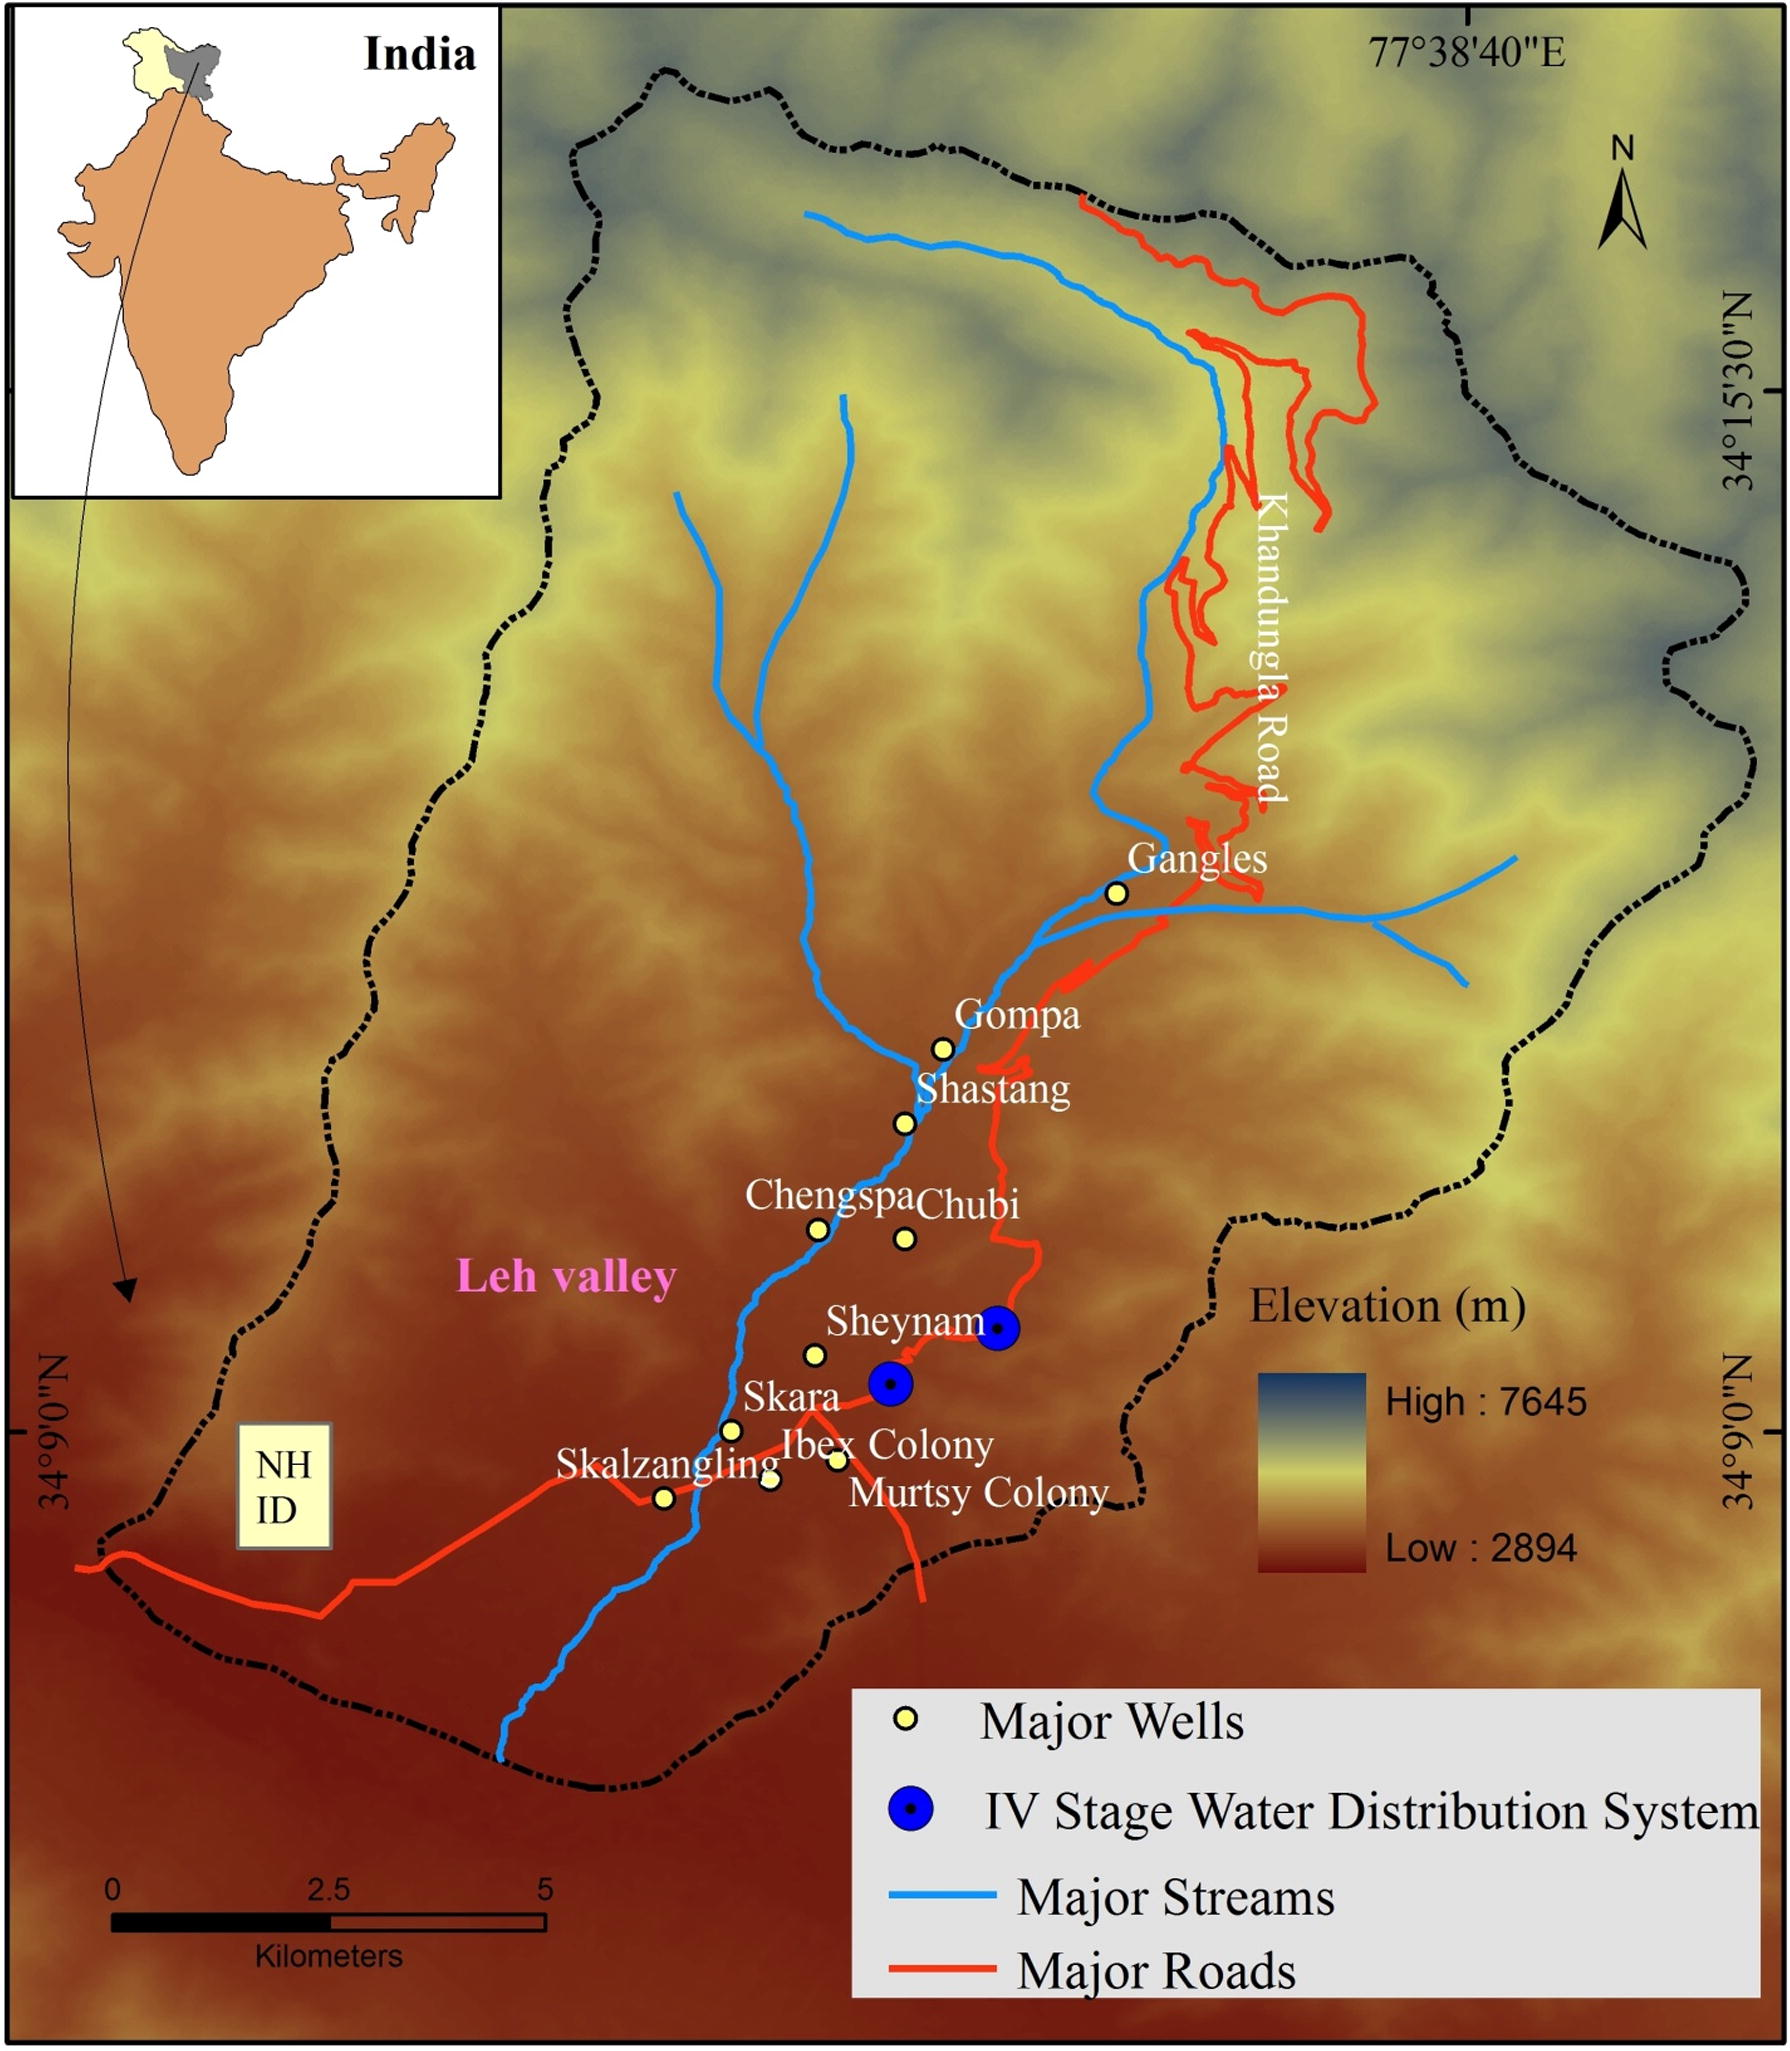
Base map of study area, Leh Valley, Jammu and Kashmir, India.
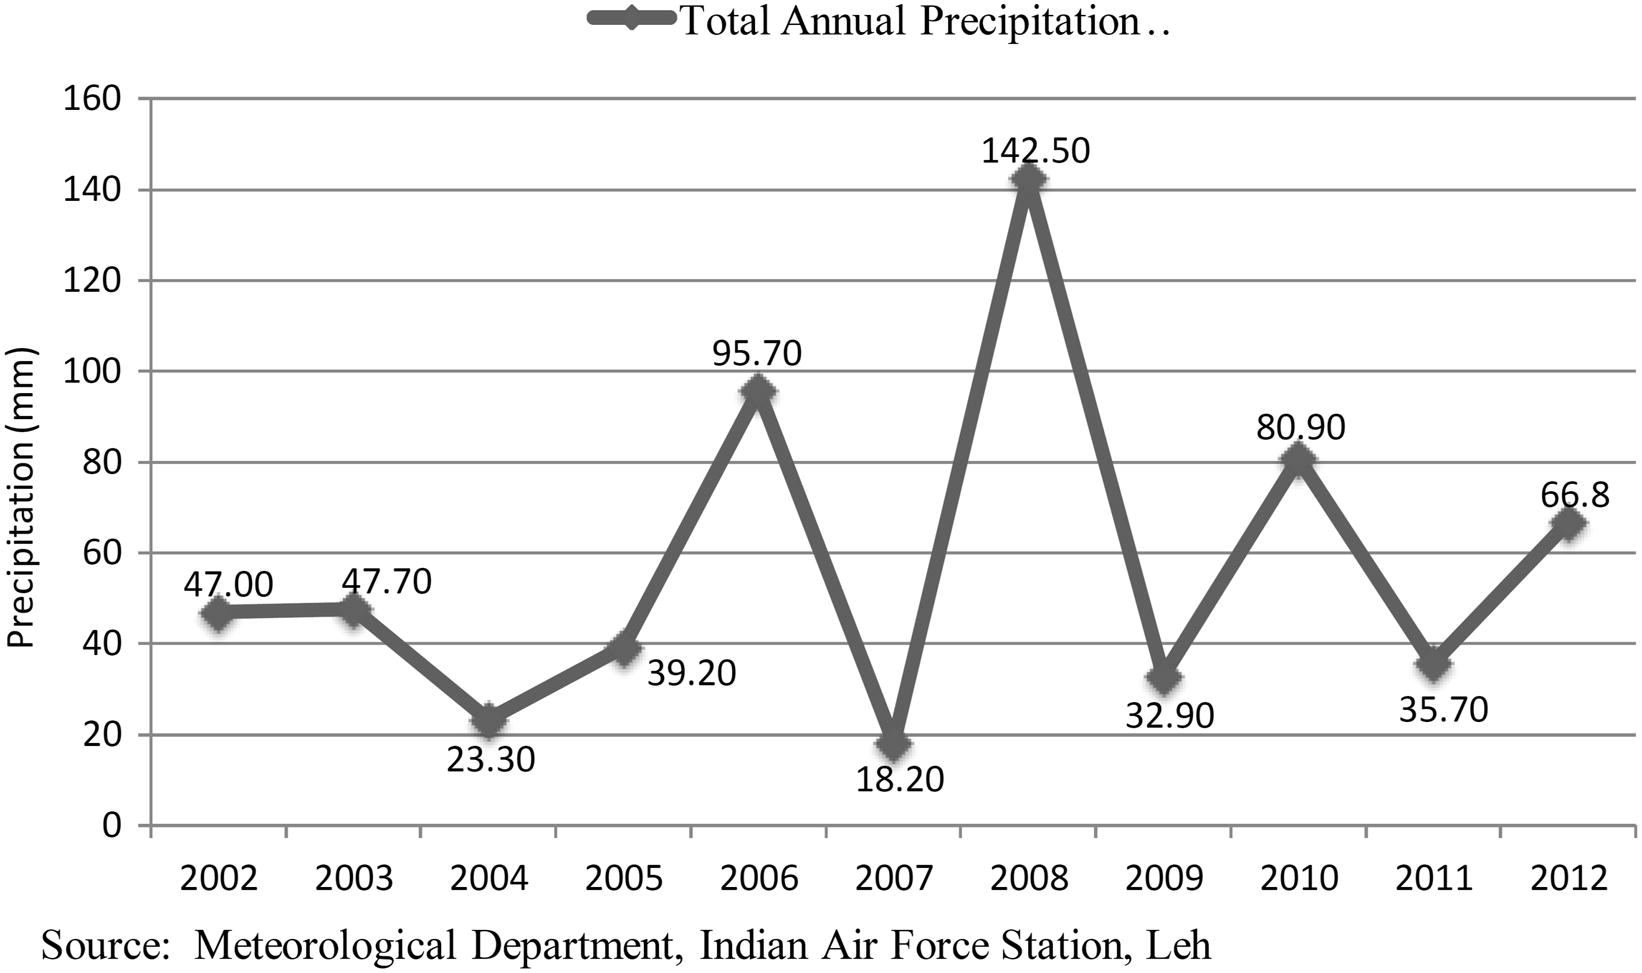
Annual rainfall of Leh area from 2002 to 2012.
3 Materials and methodology
To carry out the GWPZ, various data sets were used in the study viz. satellite images, toposheets, field data and secondary data were collected from different Government departments (Table 1). High resolution Indian Resource Sat-2 satellite image acquired on 29th July 2012 by Linear Imaging Self Scanner IV (LISS IV) sensor with 5.8 m spatial resolution procured from NRSC, India was used to interpret the various groundwater influencing factors such as land use and land cover, hydro geomorphology, lineament and drainage. The ASTER satellite Digital Elevation Model (DEM) with 30 m resolution has been used for preparing slope map. Groundwater level data and rainfall data were obtained from Public Health and Engineering (PHE) and Airforce Stations present in the Leh region respectively. The average monthly water consumption pattern of residential and floating tourist population data was also collected from PHE for water budget analysis. Once all the relevant thematic maps were prepared from satellite data, the field visits was carried to check the accuracy of visual interpretation and also to map the locations of wells and springs. Primarily, determinations of influencing factors play a vital role in preparing the groundwater potential zone map. In various literatures that were referred, it was observed that many researchers have used the different influencing factors viz., slope gradient, slope aspect, altitude, curvature, stream power index, topographic wetness index, rainfall distribution, groundwater level, distance from water body, distance from fault, drainage density, lineament, lineament density, lithology, hydro geomorphology and land use and land cover features, were considered for GWPZ mapping on the basis of data availability, and characteristics of study area. However, in this study total eight major influencing factors namely land use and land cover, hydro geomorphologic features, slope, geology, lineament, lineament density, drainage density, groundwater level were considered for preparing GWPZ map. The different thematic layers were generated in ArcGIS and stored in geodatabase. The accuracy of land use and land cover map was calculated from the Kappa index. All the thematic maps were converted from vector to raster format with 10 m × 10 m grid cell for further integration analysis for GWPZ using FR model. After the identification of GWPZ, the validation was carried out by area under curve (AUC) method considering cumulative percentage of spring wells and percent of groundwater potentiality index value. The materials and methodology adopted in the present study are shown in Fig. 3.
Data and source
Resolution and scale
Thematic layers
IRS P6 LISS IV Satellite Image, date of acquisition on 29th July 2012. Procured from National Remote Sensing Centre (NRSC), India
5.8 m
Land use and land cover
Hydro geomorphology
Lineament
Aster DEM dated 17th Oct 2011, earthexplorer.usgs.gov
30 m
Slope
Drainage
Geology map, (Geological survey of India, 2005)
1: 200,000
Geology
Public Health and Engineering (PHE), 2013
–
Groundwater level
Wells location
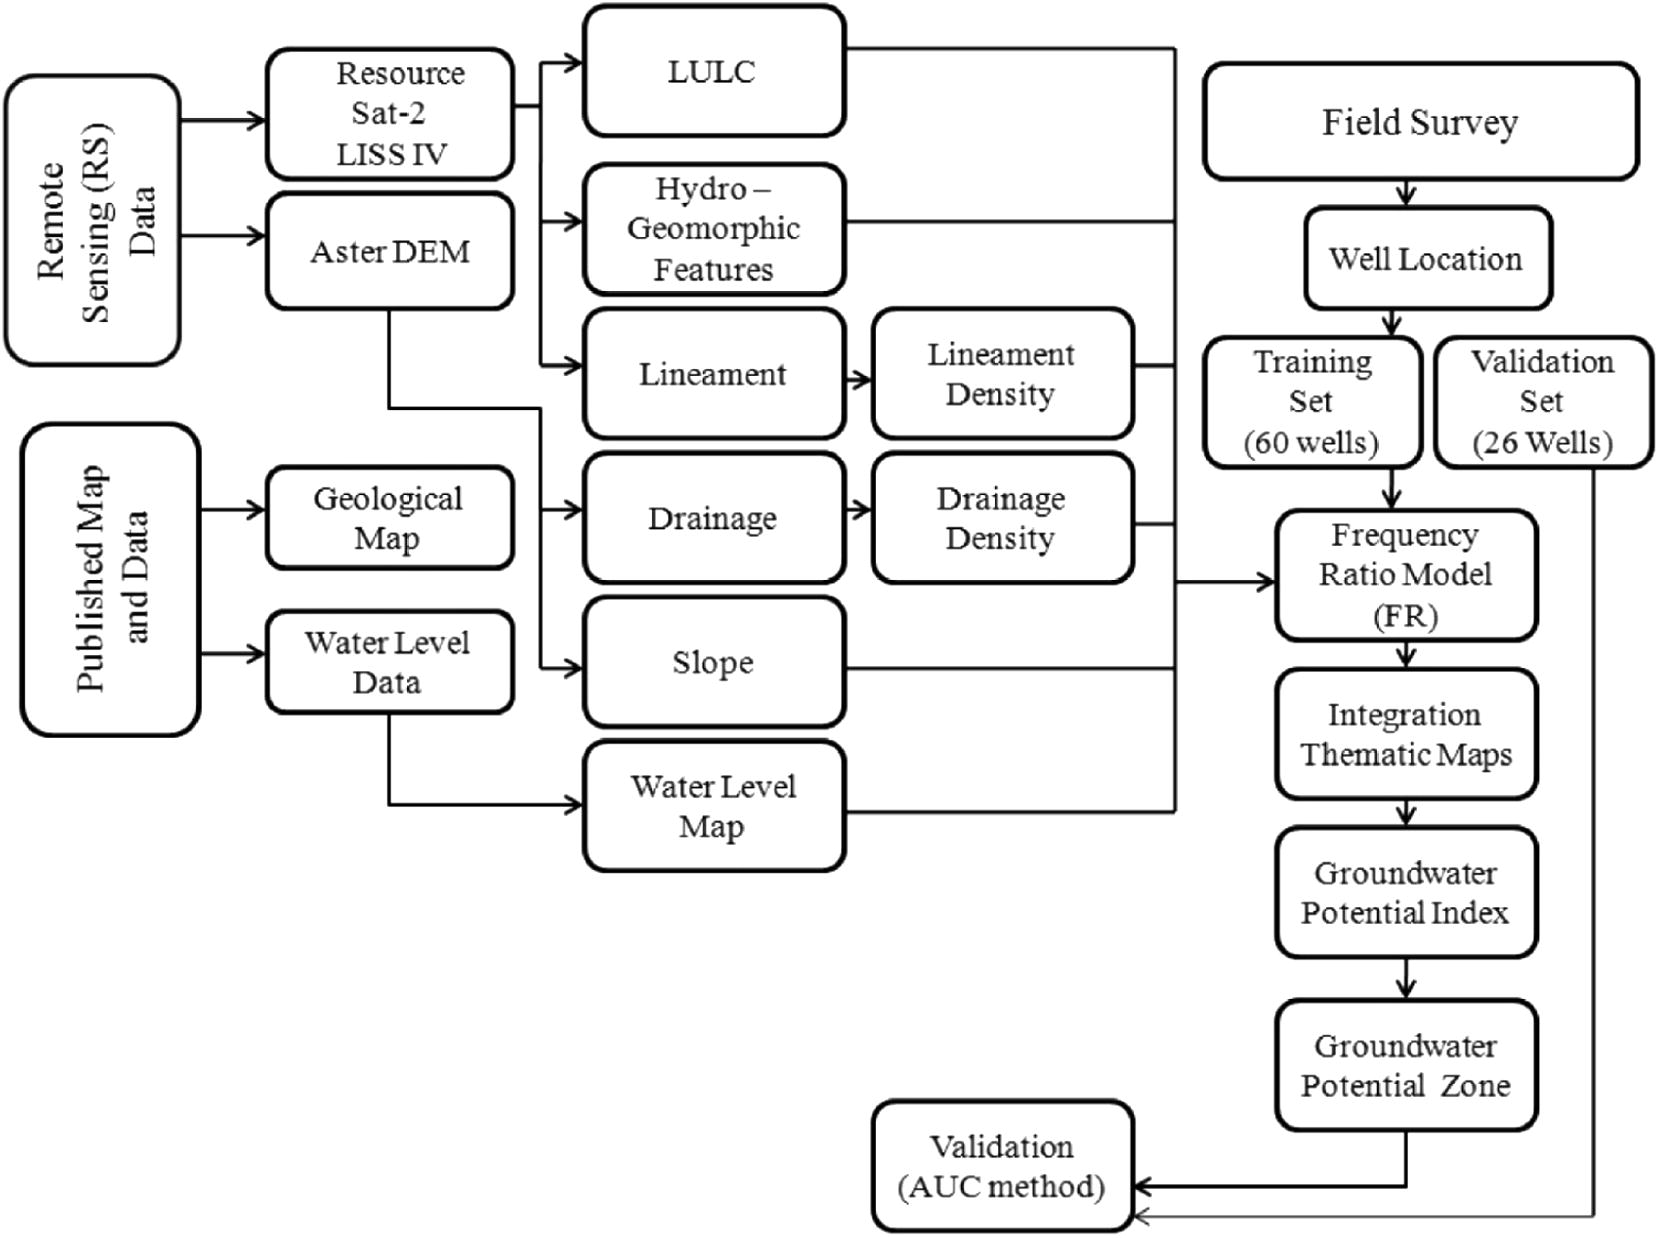
Flow chart shows materials and methodology adopted in the research study.
3.1 Frequency ratio model
The FR is a bivariate statistical approach and used to determine probability of groundwater potential areas on the basis of relationships between dependent variable viz., spring wells and independent variables viz., groundwater influencing factors (Oh et al., 2011; Naghibi et al., 2016). FR is defined as;
The FR value was derived from each thematic layer on the basis of relationship with spring wells of training set data using Eq. (1). The accuracy of FR model was validated using receiver operating characteristic (ROC) curve in form of success rate curve and prediction rate curve were used (Nandi and Shakoor, 2009 and Zabihi et al., 2016). The area under curve (AUC) value indicates the prediction accuracy (Pradhan and Lee, 2010). In the present study, AUC were determined by using the training set of 60 spring wells for measuring the success rate curve and remaining 26 spring wells retained as test data set.
3.2 Thematic maps generation
3.2.1 Land use and land cover (lu)
Land use and land cover of any region play an important role in runoff, infiltration, and recharge of groundwater (Anbazhagan et al., 2005 and Bhattacharya, 2010). The land use and land cover of the study area were demarcated into five categories such as rocky terrain, mixed agricultural land, built up land, sandy area, and river bed by visual interpretation of Resourcesat2 LISS IV satellite image (Fig. 4a). The accuracy of land use and land cover map was calculated from Kappa index method (Gómez et al., 2008; Gómez and Montero, 2011; Ronny et al., 2015). In this process of accuracy measurements there are 139 sample locations (collected from field) of different land use and land cover features and the land cover classified output was considered as input. Finally, accuracy of land use and land cover map was calculated as 88.7%.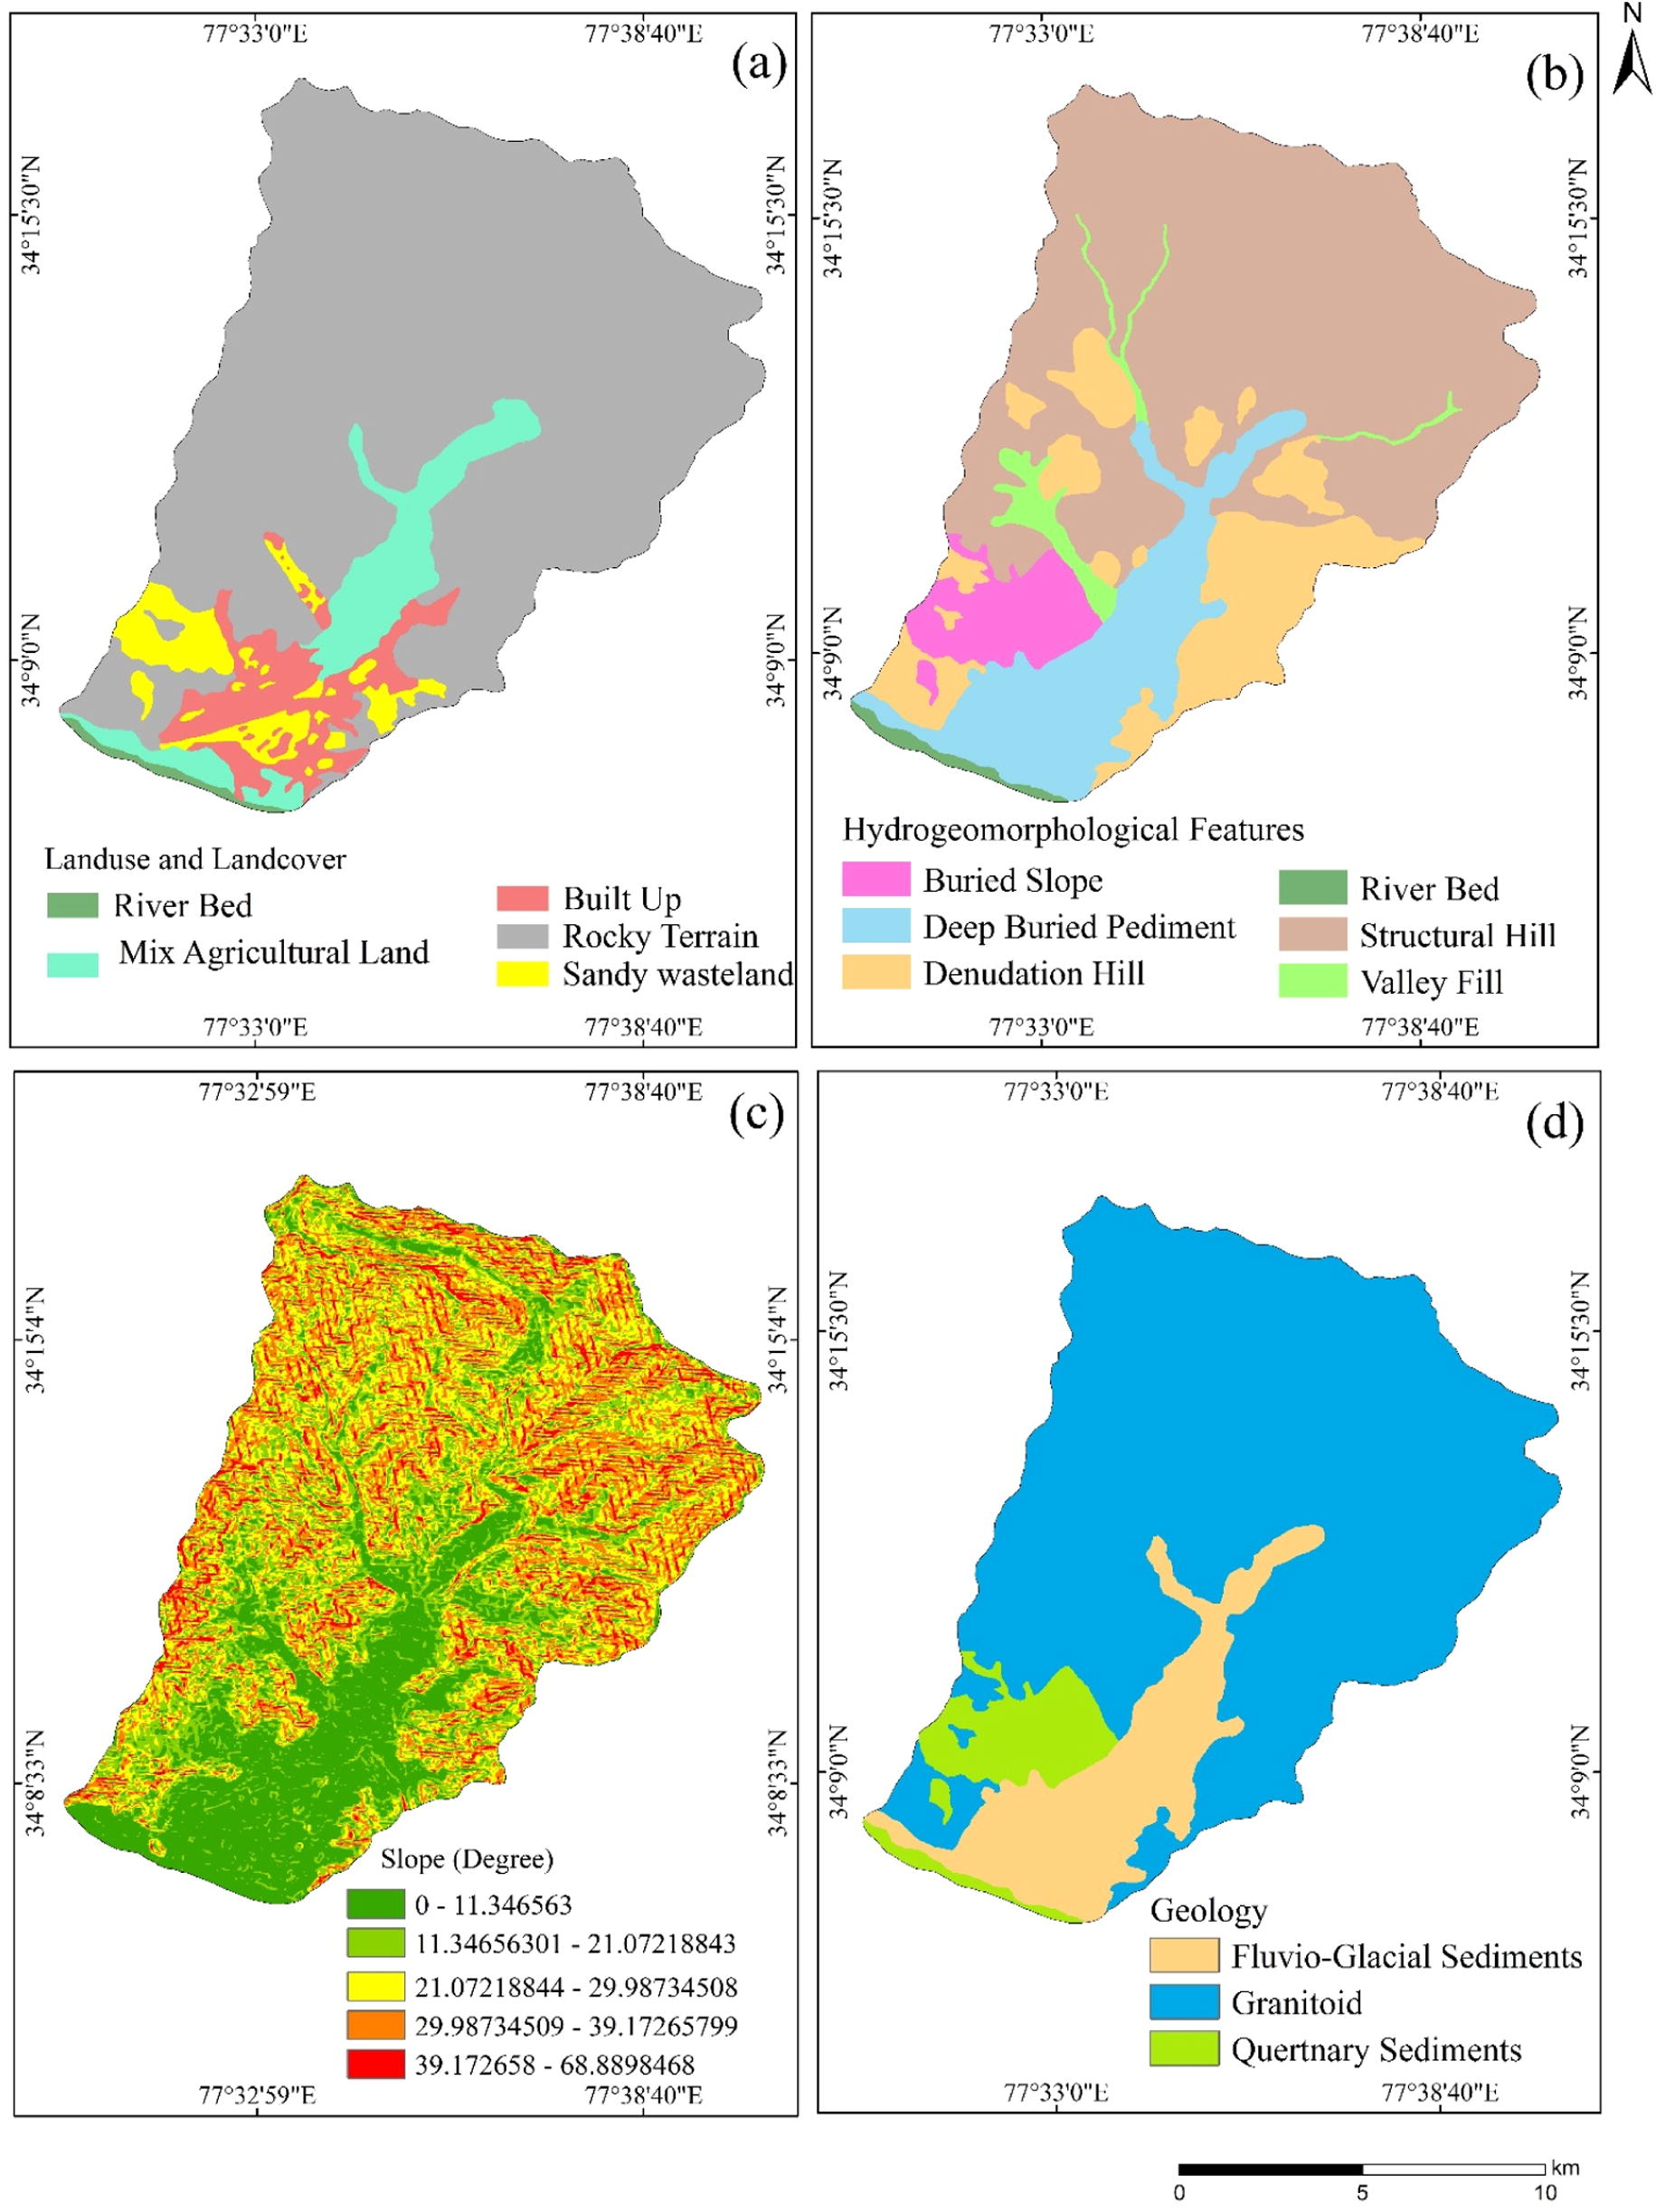
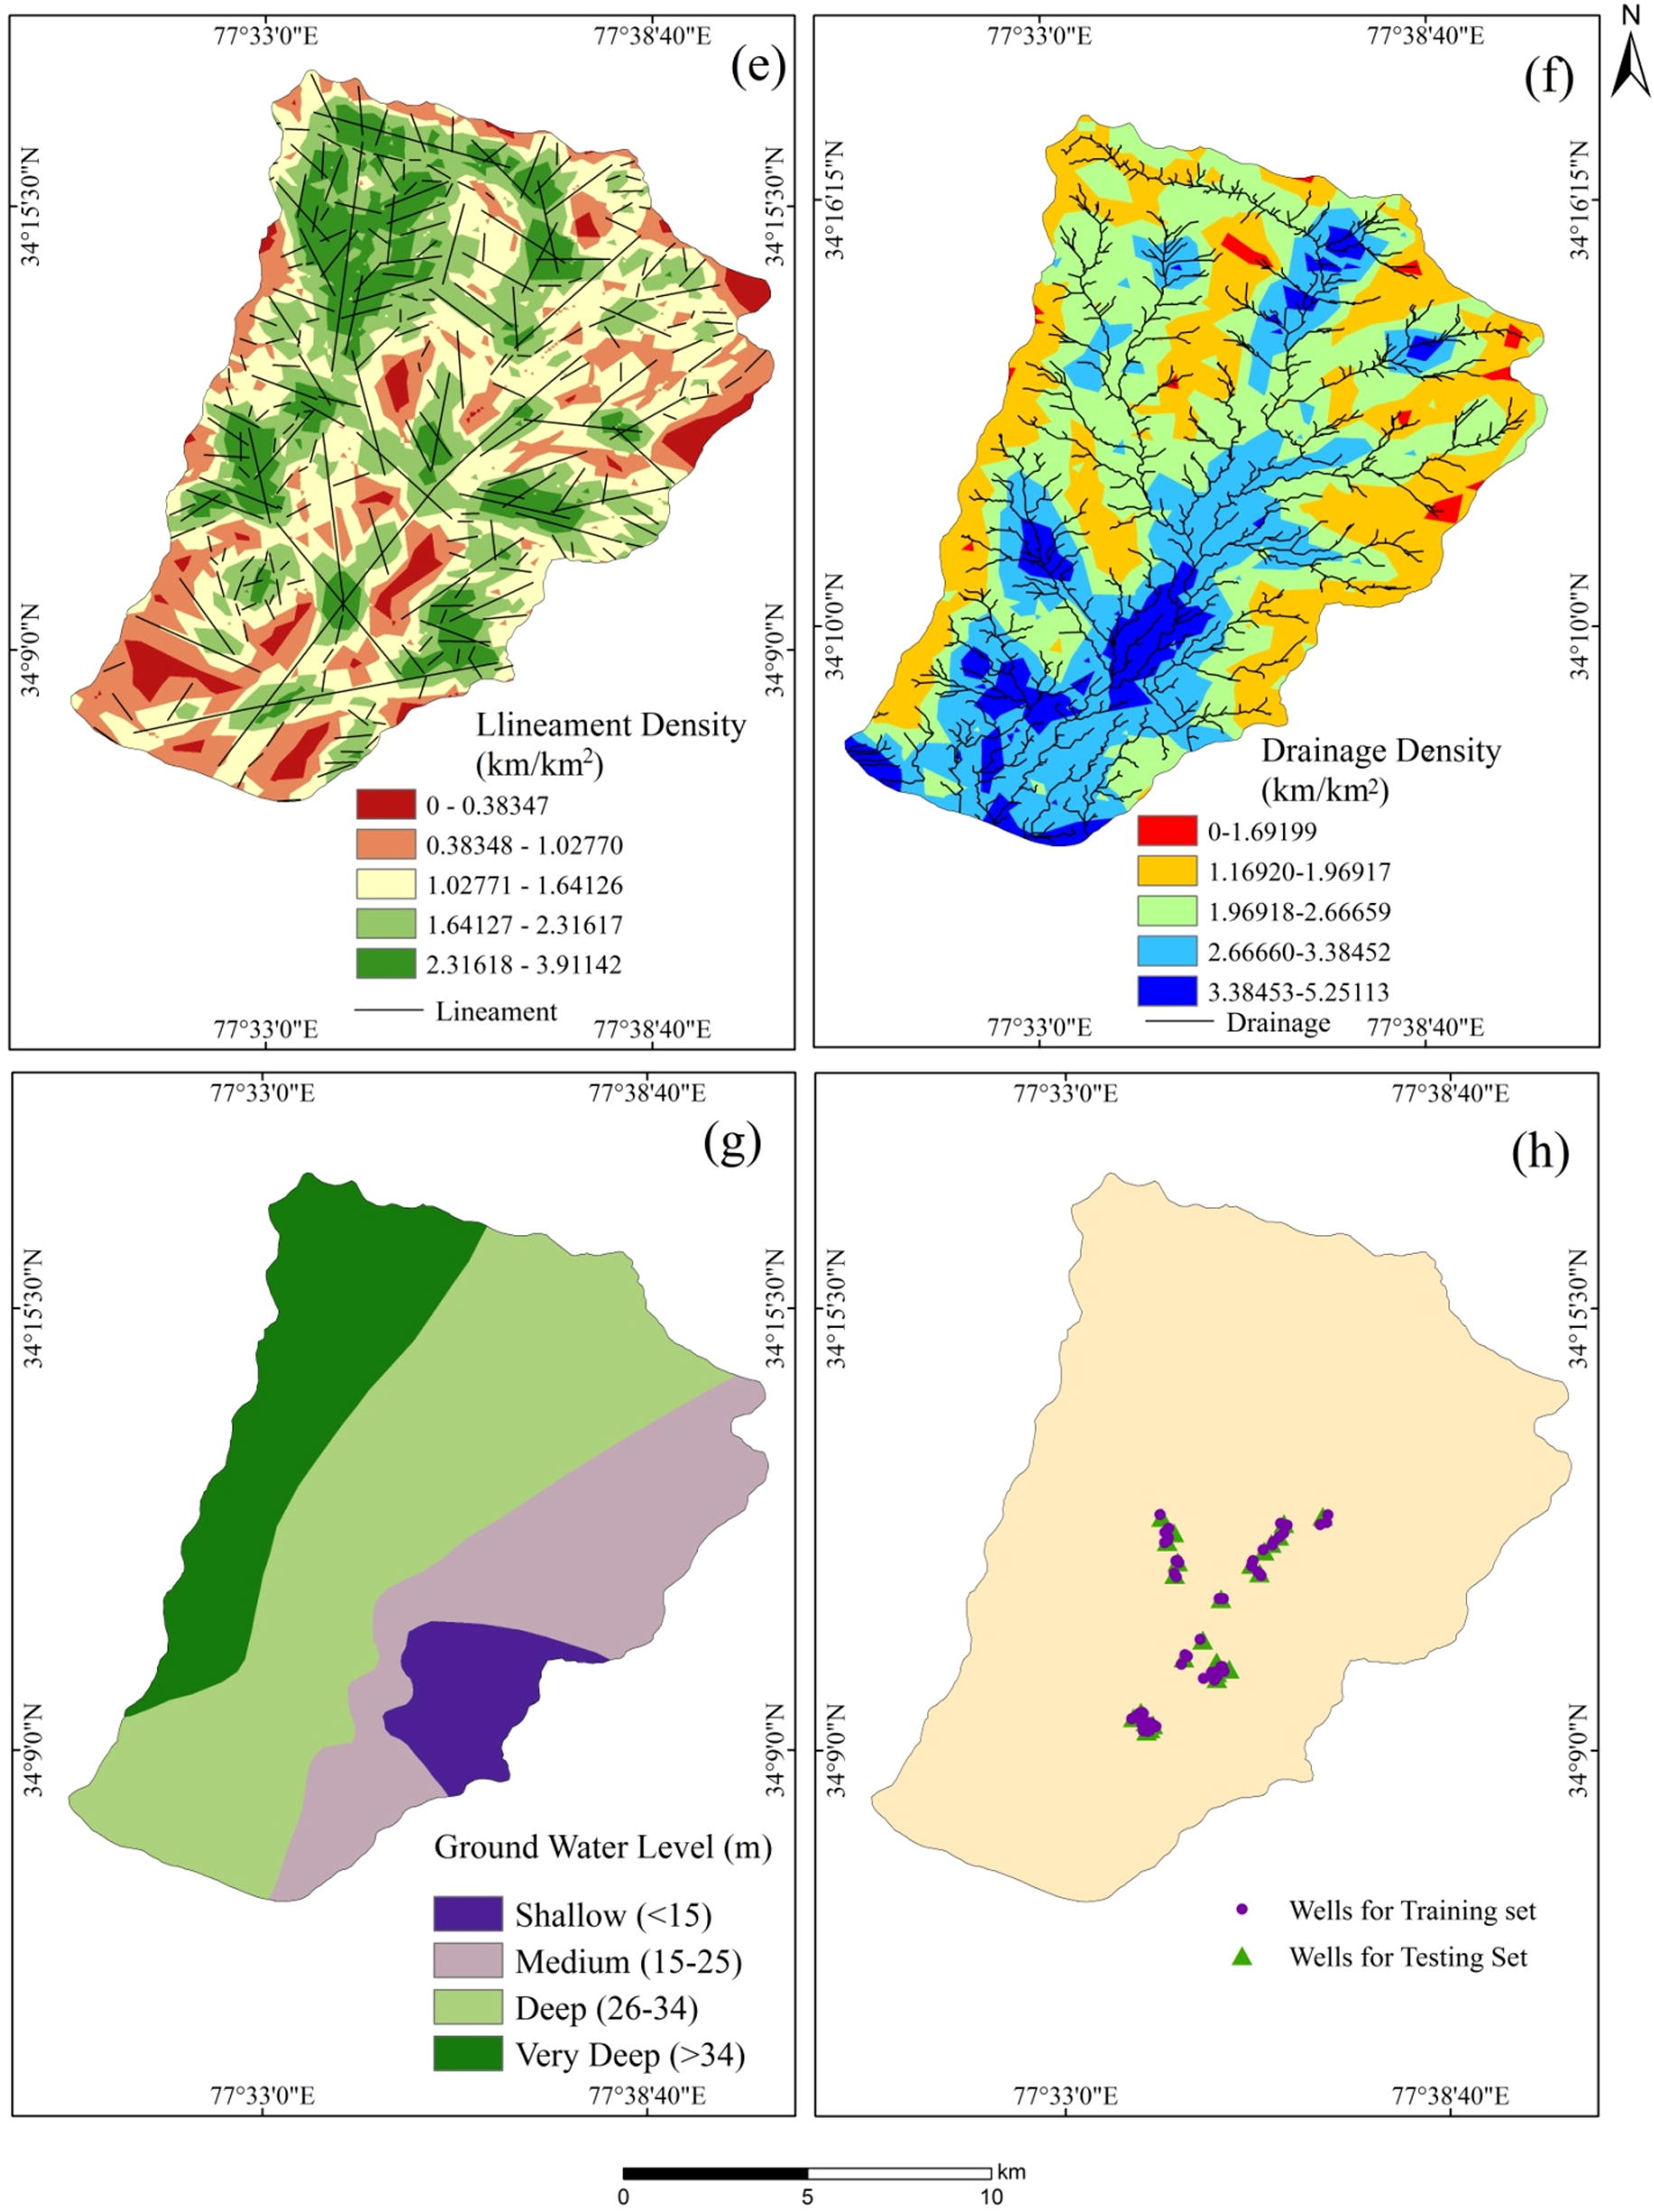
Thematic maps (a) land use and land cover, (b) hydro geomorphic features (c) slope, (d) geology, (e) lineament density, (f) drainage density, (g) groundwater level, (h) wells for training set and testing set.
Thematic maps (a) land use and land cover, (b) hydro geomorphic features (c) slope, (d) geology, (e) lineament density, (f) drainage density, (g) groundwater level, (h) wells for training set and testing set.
3.2.2 Hydro geomorphological features (hg)
Hydro geomorphological features have an important role to play in percolation and recharging of groundwater into the subsurface (Ramasamy and Anbazhagan, 1997; Balamurugan et al., 2008). On the basis of field data and satellite image (Resources at LISS IV), the hydro geomorphological features were interpreted. Six categories of features such as – deep buried pediment, river bed, valley fill, buried slope, denudation hill and structural hill were interpreted and mapped (Fig. 4b).
3.2.3 Slope (sl)
Slope defines the variation of elevation in a particular area which influences the runoff (Naghibi et al., 2016). Generally, in gentle slopes, the movement of water is slow which allows more percolation into the ground. On the other hand, there was steep slope increase runoff and decrease in the percolation and infiltration into the ground. Slope map was produced from ASTER DEM with 30 m resolution (Fig. 4c). The slope degree varies from 0° to 68.88° and classified into five classes viz., 0–11.34656°, 11.34657–21.07219°, 21.07220–29.98734°, 29.98735–39.17266°, and 39.17267–68.88984° on the basis of natural breaks classification method (Jenks, 1967).
3.2.4 Geology (ge)
The study area is geologically composed with granitoid, fluvio-glacial deposits, and quaternary sedimentary rocks (Fig. 4d). The different lithological units were demarcated and delineated on the basis of published geology map (GSI, 2005) and also necessary field checks were carried out. Unconsolidated sedimentary and fractured granitoid rocks were more favorable for groundwater movement and accumulation than massive rock.
3.2.5 Lineament density (ld)
Lineaments control the groundwater infiltration and act as a transmitting medium, especially in hard rock fractured aquifer terrain (Kumanan and Ramasamy, 2003 and Balamurugan et al., 2008). The lineaments were extracted from Resource sat LISS IV image by visual interpretation method on the basis of existence of fracture features, tonal contrast in images. Lineament density was prepared using Line Density tool in ArcGIS10 per km2. The density map was classified as five categories using natural breaks method (Jenks, 1967) viz., 0–0.38347, 0.38348–1.02770, 1.02771–1.64126, 1.64127–2.31617, and 2.31618–3.91142. Fig. 4e shows the lineament density of the area overlaid with lineament feature.
3.2.6 Drainage Density (dd)
Drainage carries water from the mountain region from precipitation or glacial or snow melt to the plains. It plays a major role as the groundwater source in a given area. The drainage systems are controlled by structural features like faults and fractures in the area and hence forth drainage acts as transmitting medium for glacial melt water movement into the subsurface.
Drainage of study area was extracted from ASTER DEM data and verified with satellite image i.e. Resourcesat2 LISS IV. Drainage density per km2 was calculated by line density tool in Arc GIS 10 and it was classified into five zones viz., <1.16919, 1.16920–1.96917, 1.96918–2.66659, 2.66660–3.38452, and 3.38452–5.25113 using natural breaks method (Jenks, 1967) (Fig. 4f).
3.2.7 Groundwater Level (gl)
The groundwater data were collected from Public Health and Engineering (PHE) Department, Leh. The gl were measured from 17 observed wells. These data were used to plot the groundwater level contour map which was classified into four classes i.e. shallow (<15 m), medium (15–25 m), deep (26–34 m), and very deep (>34 m) (Fig. 4g). Generally, shallow groundwater levels indicate high groundwater potentiality whereas the deeper groundwater levels indicate less groundwater potential.
3.2.8 Spring wells
Based on the field visit and PHE data, the natural springs were identified in different parts of the study area. During the field visit, it was observed that in some locations, the PHE had constructed artificial wells for collecting the spring water as open or closed tanks for the drinking water purposes. At many places, the agricultural irrigation depends on the spring water source. The springs discharge water at different rates depending on the season and local climatic conditions, for example, in the winter season the area is covered by snow while in summer, the spring wells discharge water (ranging from 50 l/min to 200 l/min). There are total 86 spring well locations in the area and these wells are located at various altitudes ranging from 3300 m to 3900 m at the Leh valley (Fig. 4h). Among the spring wells, 70% (60 wells) were selected as training data set for GWPZ mapping using FR model and remaining 30% (26 wells) were selected as testing data set for validation of model on the basis of random dividing method (Lee et al., 2012).
3.3 Groundwater potential zone mapping
The groundwater potential zone (GWPZ) indicates the groundwater potentiality in quantitative form i.e. high GWPI indicates high groundwater potentiality whereas low GWPI indicates low groundwater potentiality. In this study the GWPI were derived by integration of all thematic data layer using raster calculator tool in Arc GIS 10 using Eq. (2):
luFR – frequency ratio of land use and land cover; hgFR – frequency ratio of hydro geomorphic feature; slFR – frequency ratio of slope; geFR – frequency ratio of geology; ldFR – frequency ratio of lineament density; ddFR – frequency ratio of drainage density; glFR – frequency ratio of groundwater level.
4 Results and discussion
The various categories in each thematic map as well as their distributions are as follows; in land use and land cover category, the most part of the study area is covered by rocky terrain (80%), mix agricultural land (7.49%), built up land (6.85%), and sandy area (5.01). The hydro geomorphological features are an important input to the FR model. In this category, the structural hills cover a larger part of the study area (59.31%), whereas denudational hills cover 16.75% and the river bed occupied 0.87% of the area. Lithologically, maximum area was covered by granitoid rocks (74.48%) and the remaining area covered by recent sedimentary formations. In the study area, the groundwater level is varying from shallow to deep. However, most of the area falls in moderate to deep groundwater level ranging from 15 m to 34 m respectively. The steep and moderate slope categories cover totally 69.92% of the area and gentle slope covers 30.08%. In lineament density, the high lineament density covers 51.43% of the area which indicates that these lineaments are acting as a transmitting medium for groundwater. The high, medium and low classes of drainage density covered the area of about 9.19%, 19.48%, and 71.59% respectively. Structural features like faults and fractures controlled the drainage systems in the study area and these drainages act as a transmitting medium for glacial melted water movement into the subsurface.
FR values were estimated from each thematic layer on the basis of the relationship with spring wells. The relationship between hydro geomorphic features and groundwater potentiality shows deep buried pediment region having the high FR value of 6.47 than other features. The results also show the FR value of lineament density of 9.78. The FR value of the slope is found to be gradually decreasing with the increasing the degree of slope. Among the geological units fluvio-glacial deposits have highest FR value of 6.47 and indicated the high possibility of the presence of groundwater in this feature. The relationship with drainage density reveals that high FR value is concentrated among the high and very high density zones. The relation with groundwater level also shows the FR value is decreasing with the increasing of depth of the groundwater level. The FR value of different thematic layers and its classes are shown in Table 2. From the FR model the GWPZ mapping is prepared in the study area and the details are discussed in the following in sub headings.
Thematic maps
Attribute details
No of pixel in a class
% of pixel in a class
No of pixel of wells
% of pixel of wells
Frequency ratio
Land use and land cover
River bed
11,090
0.63
0
0.00
0.00
Mixed agricultural land
130,864
7.49
54
90.00
12.02
Built up land
119,714
6.85
4
6.67
0.97
Rocky terrain
1,398,377
80.02
2
3.33
0.04
Sandy wasteland
87,543
5.01
0
0.00
0.00
Hydro geomorphic features
Deep buried pediment
256,466
14.68
57
95.00
6.47
River bed
15,216
0.87
0
0.00
0.00
Valley fill
48,270
2.76
0
0.00
0.00
Buried slope
98,298
5.62
0
0.00
0.00
Denudation hill
292,883
16.76
0
0.00
0.00
Structural hill
1,036,455
59.31
3
5.00
0.08
Slope
0–11.34656
408,257
23.36
47
78.33
3.35
11.34657–21.07219
380,010
21.74
8
13.33
0.61
21.07220–29.98734
452,615
25.90
4
6.67
0.26
29.98735–39.17266
365,731
20.93
1
1.67
0.08
39.17267–68.88984
140,975
8.07
0
0.00
0.00
Geology
Granitoid
1,377,608
78.83
3
5.00
0.06
Fluvio-glacial deposits
256,466
14.68
57
95.00
6.47
Quaternary sedimentary
113,514
6.50
0
0.00
0.00
Lineament density
0–0.38347
77,451
4.43
26
43.33
9.78
0.38348–1.02770
342,828
19.62
10
16.67
0.85
1.02771–1.64126
594,345
34.01
12
20.00
0.59
1.64127–2.31617
483,111
27.64
11
18.33
0.66
2.31618–3.91142
249,853
14.30
1
1.67
0.12
Drainage density
<1.16919
17,018
0.97
0
0.00
0.00
1.16920–1.96917
496,013
28.38
0
0.00
0.00
1.96918–2.66659
639,701
36.60
8
13.33
0.36
2.66660–3.38452
464,859
26.60
23
38.33
1.44
3.38452–5.25113
129,997
7.44
29
48.33
6.50
Groundwater level
Shallow
122,673
7.02
9
15.00
2.14
Medium
428,857
24.54
21
35.00
1.43
Deep
821,718
47.02
30
50.00
1.06
Very deep
374,340
21.42
0
0.00
0.00
4.1 FR Model for groundwater potential zone mapping
FR model provides values of GWPI ranging from 0.21999 to 46.72999. It was classified into five potential classes based on Jenks (1967) natural breaks classification method, i.e., very low, low, moderate, high and very high (Fig. 5) and each class is occupied in the study area 71.66%, 12.05%, 8.51%, 4.59%, 3.19% of total study area respectively (Table 3). The mean and standard deviation of this model are 6.99325 and 9.21219. It is notable that most of the high and very high potential zones are located in the central part of this study area due to the presence of high lineament density, high drainage density, lower slope, and porous nature of surface and subsurface which was composed of boulder, gravel, sand in deep buried pediment deposit (Agarwal and Garg, 2016; Kolawole et al., 2016; Liu et al., 2015; Kumar et al., 2014; Khodaei and Nassery, 2013; Nag and Ghosh, 2013). The high lineament density and low slope categories influence the infiltration of water into the ground in the presence of deep buried pediment deposit in the study area. The deep buried pediment formation is acting as a groundwater accumulation zone in the study area that receives water from snow or glacial covered area through fractures and drainages. The results also show that very high and high groundwater potential zones fall in high drainage density class, since the drainage systems in the study area were controlled by structural features like fractures/joints. These structural features were acting as a transmitting medium for infiltration of groundwater in the Leh valley. However, some of the earlier studies (Mogaji et al., 2011; Chowdary et al., 2009) show that the high drainage density has possibility of low groundwater potential, which is due to the presence of massive rock or an impervious layer beneath it. However, the present study area is covered by fractured rock formation and drainage systems were controlled by those fractures moreover the drainage systems are acting as a source of groundwater recharge medium. The low and very low potential zones are found in the surroundings of this central part, where higher slope and the presence of lower drainage density made the region unfavorable for groundwater potentiality.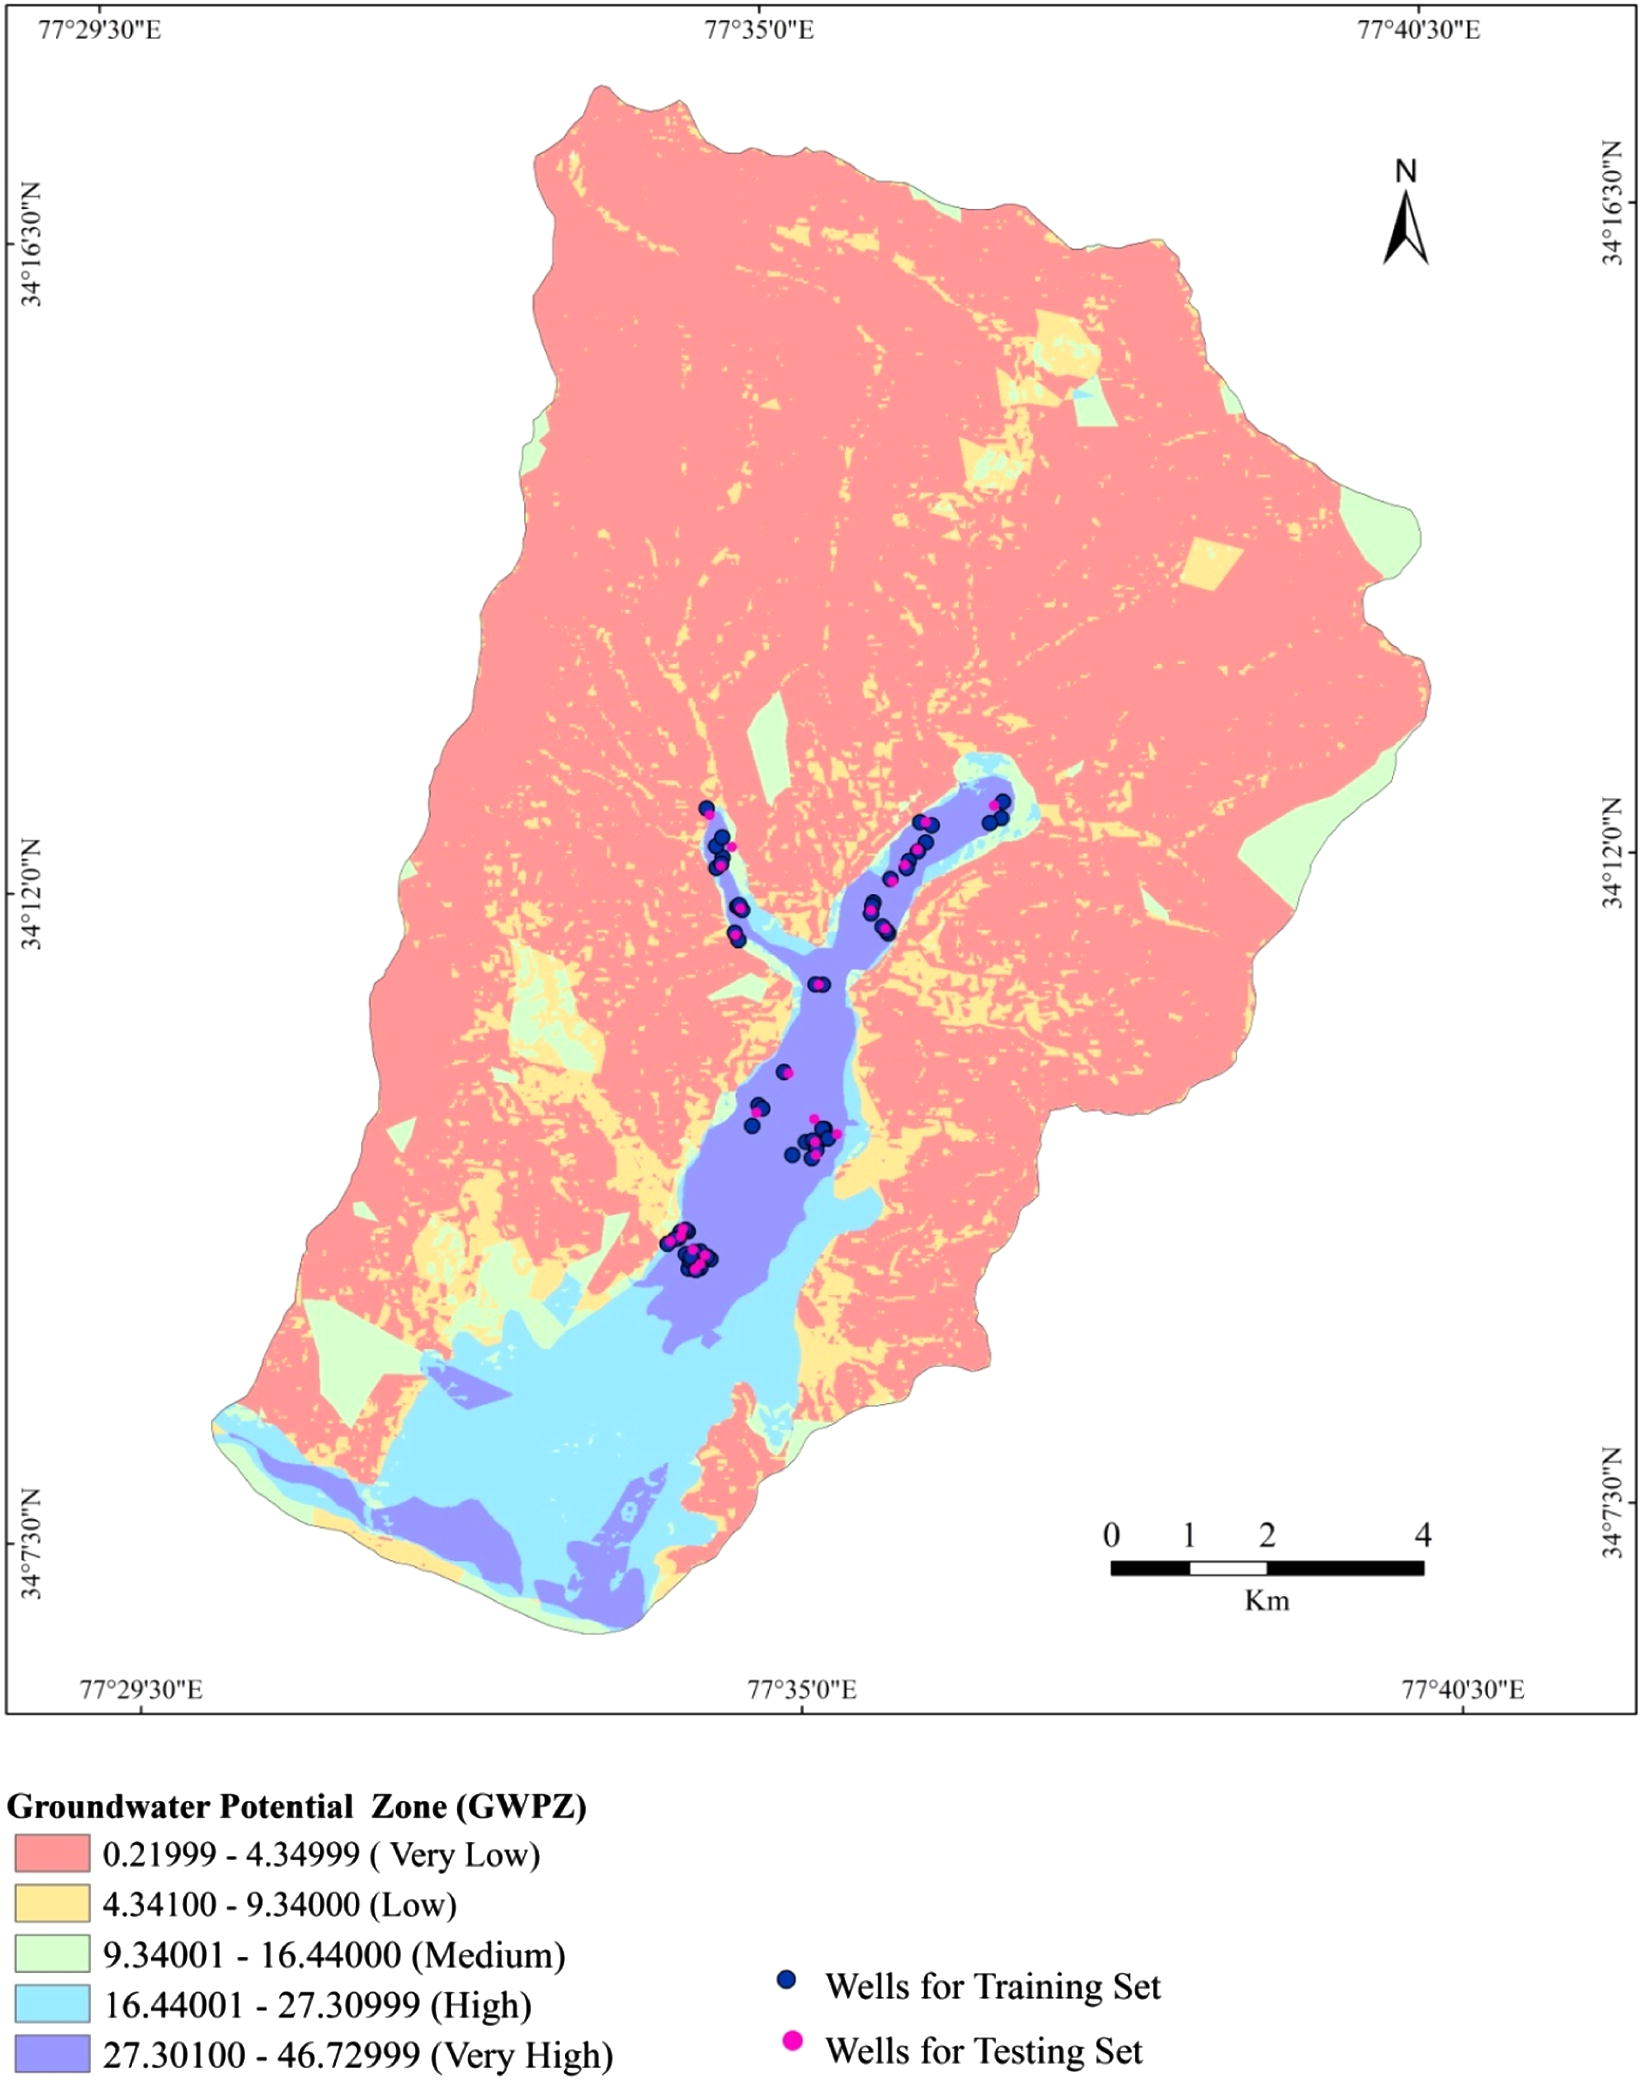
Groundwater potential zonation map derived from FR method.
Groundwater potential zone
Class
No of pixel
Percentage (%) of area
Very high potential zone
27.31000–46.72999
55,669
3.19
High potential zone
16.44001–27.30999
80,058
4.59
Moderate potential zone
9.34001–16.44000
148,636
8.51
Low potential zone
4.35000–9.34000
210,360
12.05
Very low potential zone
0.21999–4.34999
1,250,875
71.66
The integration was taken up both with all thematic data layers and also with its different combinations to evaluate the influence of different causative factors on groundwater potentiality index of the study area (Table 4). Standard Deviation (SD) values indicate that parameters which have high influence of groundwater potential are groundwater level (SD = 9.052), followed by lineament density (SD = 8.812), slope (SD = 8.392), drainage density (SD = 8.292), hydro geomorphology (SD = 7.265), geology (SD = 7.263), and land use and land cover category (SD = 6.968).
GWPZ parameters
Minimum
Maximum
Mean
Standard deviation
Excluding land use and land cover
0.17999
34.70999
5.99340
6.96896
Excluding hydro geomorphological features
0.21999
40.25999
5.99535
7.26510
Excluding slope
0.21990
43.38000
5.99419
8.39271
Excluding geology
0.15999
40.25999
5.99551
7.26315
Excluding lineament density
0.00000
36.95000
5.99276
8.81278
Excluding drainage density
0.21999
40.22999
5.99255
8.29210
Excluding groundwater level
0.21999
44.59000
5.99315
9.05292
Adding all parameters
0.21999
46.72999
6.99325
9.21219
4.1.1 Validation of FR model
The AUC values range from 0.5 to 1.0, in which a value near to 1.0 indicate highest degree of accuracy and a value near to 0.5 indicates inaccuracy in the model (Fawcett, 2006). On the basis of the relationship of AUC value and prediction accuracy, it can be divided into the following classes: 0.9–1.0 (excellent), 0.8–0.9 (very good) 0.7–0.8 (good), 0.6–0.7 (average) and 0.5–0.6 (poor) (Naghibi et al., 2015). In the present study, the success and prediction rate curves were measured using area under curve value (AUC) method (Fig. 6). From the AUC values calculated by using a training set of 60 spring wells to measure the success rate curve, it was observed that the success rate measured as 0.8125. However, success rate alone is not a suitable method to determine the prediction capacity of any model because success rate is calculated on the basis of training data set which has been already used for constructing the GWPZ model (Zabihi et al., 2016). Hence, the prediction rate curve was derived using test data set of 26 spring wells which were not utilized for preparation of GWPZ in the FR model. The prediction rate indicates the prediction capacity of the model as well as predictor variables to predict GWPZ (Lee and Pradhan, 2007). The AUC value of prediction rate curve is 0.7723. Thus, considering AUC value of success rate curve and prediction rate curve, it can be concluded that the model gives very good results in the present research.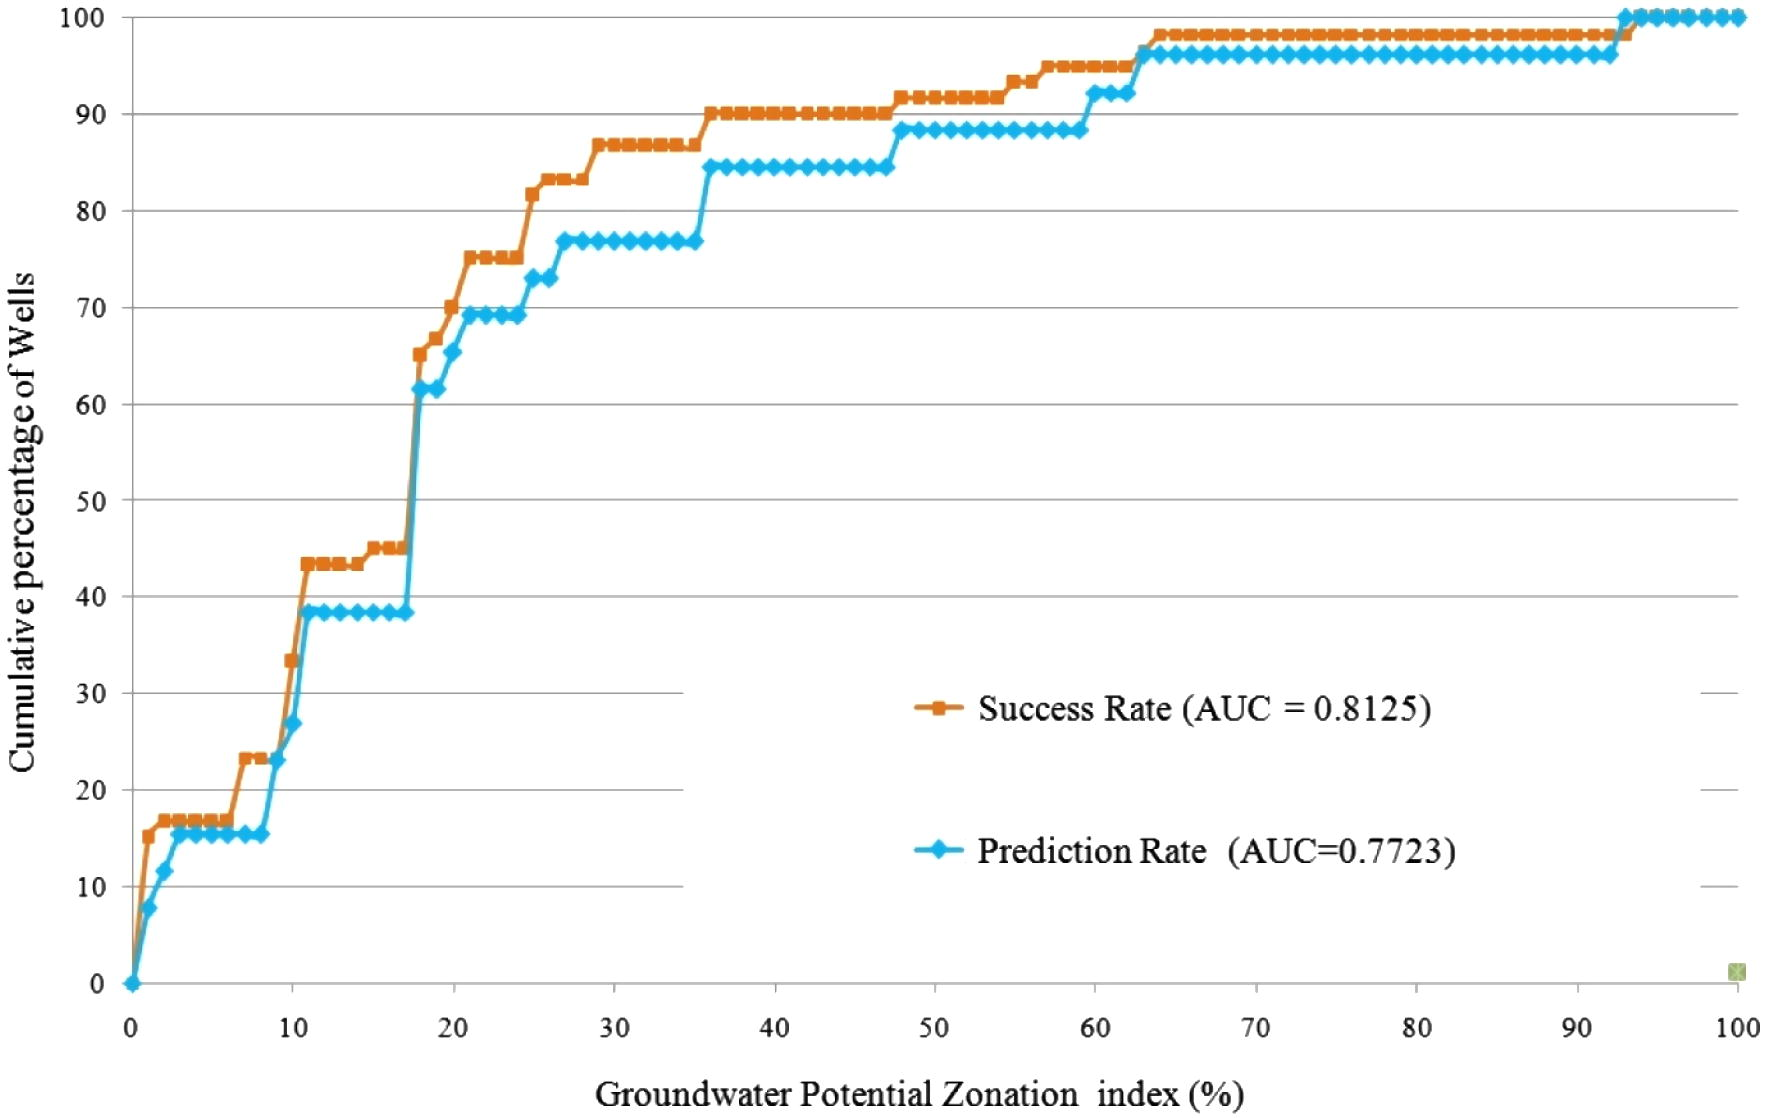
Validation derived from AUC method.
4.2 Water budget of Leh valley
Traditionally, Ladakh systems water consumption and sanitation are in harmony with nature. The compost pit toilets used by local community required no water and hence, no drains either. Contemporary lifestyles require high consumption of water and consumption for people from outside this ecologically sensitive region is exponentially more than what it would be for the native Ladakh community. For example, flush toilets, which are non-existent till a decade or so back, use as much as 15 l of water per use and are most certainly a contributor to the growing demand for water in the Leh town. The guesthouse owners meet the increase in water demand by indiscriminate and uncontrolled digging of bore wells, as observed in fields. According to Public Health and Engineering (PHE) Department of Ladakh Autonomous Hill Development Council (LAHDC) Leh, the daily demand of water would be around 50 l/d for the resident population. But it could rise to 75 l/d on average due to increase of incoming tourists. Since, the floating tourist population is fluctuating; determination of exact figure of water consumption is very difficult. For the water budget calculation, average monthly supply of water and average monthly demand of water are taken into consideration. Total demand of water in May, June, July, August, and September months are 79,794,964, 83,984,400, 92,644,242, 85,558,842, and 75,495,857 l respectively. The total supply of water to the local communities by PHE for each month from May to September was 82,650,750 l/month. So, the total demand for water is higher than the total water supply in June, July and August months. The probability of water deficiency is high in August and less in September. The probability for water deficiency in the Leh valley due to increased influx of tourist population is roughly estimated to 58.71% (Table 5). To meet the demand of water during the tourist season the local community mainly depends on groundwater, observed to be extracted from bore or tube wells. In these circumstances there is requirement for sustainable development of groundwater resources in the area.
Months
May
June
July
August
September
May–September
No. of tourists
26,310
33,908
46,843
37,756
20,883
165,650
Average minimum days of stay
5
5
5
5
4
4.8
Most likely number of days of stay
7
7
8
7
6
7
Average maximum days of stay
9
10
10
9
8
9.2
Water consumption by tourists (in l)
13,248,694 ± 2,723,343
17,438,400 ± 4,262,651
26,098,242 ± 6,368,261
19,012,842 ± 3,908,117
8,949,857 ± 2,161,595
83,061,642 ± 18,861,044
Total demand (in l)
79,794,964
83,984,400
92,644,242
85,558,842
75,495,857
417,478,307
Total water supply (in l)
82,650,750
82,650,750
82,650,750
82,650,750
82,650,750
413,253,750
Water deficit⁎ (in l)
−2,855,786
−1,333,650
−9,993,492
−29,082,092
+7,154,893
−4,224,557
4.3 Sustainable groundwater management
The present scenario at the Leh area calls for implementation of sustainable aquifer replenishment program in the valley. In this situation, constructing artificial recharge structures is an important method of groundwater harvesting. Based on the parameters such as groundwater level, natural gradients from spring well source to artificial recharge locations, groundwater exploitation from existing wells, and subsurface lithology, seven highly favorable locations were identified for artificial recharge for sustainable groundwater management (Table 6). The groundwater level in these sites varies from 6 m to 24 m which are falling in shallow and medium groundwater level zones. The shallow water level area is also considered for long term sustainable development of groundwater of Leh. The deep and very deep groundwater level zones can be suggested to minimize the utilization of groundwater resources. To fulfill the water demand of locals in such unfavorable regions, the water should be distributed through motor pumps from springs or shallow aquifers. The subsurface information was obtained from bore well cross-section to be considered to develop the artificial recharge through a natural process. The source of artificial recharge from springs to recharge wells are identified using proximity analyses and the considered distance between both locations <1600 m. The spring locations are located at higher elevations than the artificial recharge wells, so that, the recharge wells get water through a slope gradient by natural processes. The elevation difference between the spring and the recharge wells varies from 5 m to 60 m. Considering the above condition, Ibex Colony, Skalzangling, Chengspa, Hospital, Skara-Yokma are ideal locations for recharging water naturally from springs.
Sl. No.
Well location
Ground water potential
Well elevation (in m)
Nearest spring elevation (in m)
Difference of elevation (in m)
Distance between nearest spring and well (in m)
1
Ibex Colony
Moderate
3370
3420
50
1075.73
(12.68–23.78)
2
Skalzanglig
Very high
3340
3400
60
1531.72
(34.10–46.13)
3
Chengspa
Very high
3535
3540
5
716.71
(34.10–46.13)
4
Skara Yokma
Very high
3395
3400
5
221.56
(34.10–46.13)
5
Skara
Very high
3380
3400
20
540.83
(34.10–46.13)
6
Karzo
Very high
3525
3530
5
104.80
(34.10–46.13)
7
Chubi
Very high
3530
3540
10
112.70
(34.10–46.13)
5 Conclusions
Based on this study, it is concluded that the very high and high GWPZ in the region is located in the valley portion of Leh. During the field visits, it has been observed that there is a possibility of more development in this sensitive region in terms of construction of built-up area in the near future due to migration of local and tourist populations. In this regard, to get the drinking and domestic usable water, they will depends on bore or tube wells. Now a days drilling of bore wells is an unregulated activity in Leh, and this needs to be brought under LAHDC regulations with a thorough and efficient monitoring of bore wells. The spring well locations need to be conserved and protected and these sources should be optimally utilized in order to meet the water requirement of the community living in its vicinity. Spring maintenance and management should be a community based process that means local community should take necessary step to conserve it along with local government agent. The Leh community has historically led a life of self-subsistence and probably it is just the right time to make a proper action for community based groundwater management in this region.
Acknowledgements
The authors wish to sincerely thank to Prof. S Parasuraman, Director of TISS, The PHE Department of Ladakh Autonomous Hill Development Council, Assistant Executive Engineer (Mech) Mr. Wangyal Phunsog, Mr. Sudharsan, Mr. Sonam and Mr. Lobsang, Mr. Paltan of LAHDC-TISS, Meteorological Department, Indian Air Force Station, Chairperson’s of JTCDM, TISS Accounts and other supporting staff for providing us immense support to successfully carry out this research in difficult weather conditions.
References
- Remote sensing and GIS based groundwater potential & recharge zones mapping using multi-criteria decision making technique. Water Resour. Manage. 2016;30(1):243-260.
- [Google Scholar]
- Geoinformatics in groundwater potential mapping and sustainable development: a case study from southern India. Hydrol. Sci. J. 2014
- [CrossRef] [Google Scholar]
- Remote sensing and GIS for artificial recharge study, runoff estimation and planning in Ayyar basin, Tamil Nadu, India. Environ. Geol.. 2005;48:158-170.
- [CrossRef] [Google Scholar]
- Remote sensing in delineating deep fracture aquifer zones. In: Anbazhagan S., Subramanian S.K., Yang X., eds. Geoinformatics in Applied Geomorphology. CRC Press: Taylor and Francis; 2011. p. :205-229.
- [Google Scholar]
- Electrical resistivity survey and shallow sub surface geological study in hard rock terrain, South India. J. Geol. Soc. India. 2015;85:305-312.
- [CrossRef] [Google Scholar]
- Remote sensing for delineating deep aquifer zones, Hosur-Rayakottai region, India. In: 2008, ed. National Symposium on Advances in Remote Sensing Technology and Applications with Special Emphasis on Microwave Remote Sensing and Annual Convention of Indian Society of Remote Sensing (ISRS). 2008. Ahmedabad, Gujarat, India
- [Google Scholar]
- Artificial ground water recharge with a special reference to India. Int. J. Res. Rev. Appl. Sci.. 2010;4:214-221.
- [Google Scholar]
- Delineation of groundwater potential zones using satellite remote sensing and geographic information system techniques: a case study from Ganjam district, Orissa, India. Res. J. Recent Sci.. 2012;1(9):59-66.
- [Google Scholar]
- Integrated water resource development plan for sustainable management of Mayurakshi watershed, India using remote sensing and GIS. Water Resour. Manage. 2009;23(8):1581-1602.
- [Google Scholar]
- Groundwater spring potential mapping using bivariate statistical model and GIS in the Taleghan watershed Iran. Arab. J. Geosci. 2013
- [CrossRef] [Google Scholar]
- A GIS-based approach to evaluating regional groundwater pollution potential with DRASTIC. J. Soil Water Conserv.. 1990;45(2):242-245.
- [Google Scholar]
- An introduction to ROC analysis. Pattern Recogn. Lett.. 2006;27:861-874.
- [CrossRef] [Google Scholar]
- Geological Survey of India, 2005. Geological map of Jammu and Kashmir.
- Determining the accuracy in image supervised classification problems. EUSFLAT. 2011;1:342-349.
- [Google Scholar]
- Accuracy statistics for judging soft classification. Int. J. Remote Sens.. 2008;29(3):693-709.
- [Google Scholar]
- An integrated approach to groundwater exploration using remote sensing and geographic information system. J. Water Resour. Prot.. 2012;4(9):717-724.
- [Google Scholar]
- Artificial recharge by floodwater spreading estimated by water balances and groundwater modelling in arid Iran. Hydrol. Sci. J.. 2014;60(2):336-350.
- [CrossRef] [Google Scholar]
- Remote sensing and GIS-based analysis of cave development in the Suoimuoi Catchment (Son La-NW Vietnam) J. Cave Karst Stud.. 2002;64(1):23-33.
- [Google Scholar]
- Delineation of groundwater recharge sites using integrated remote sensing and GIS in Jammu district. Int. J. Remote Sens.. 2007;28:5019-5036.
- [Google Scholar]
- The data model concept in statistical mapping. Int. Year Book Cartogr.. 1967;7:186-190.
- [Google Scholar]
- Comparison of laboratory and field analysis of aquifer and well characteristics at an artificial recharge well site. In: Symposium of Haifa, Artificial Recharge and Management of Aquifer. Vol vol. 72. International Association of Scientific Hydrology; 1967. p. :182-192. March 19–26
- [Google Scholar]
- Modeling groundwater probability index in Ponnaiyar River basin of South India using analytic hierarchy process. Model. Earth Syst. Environ.. 2016;2:109.
- [CrossRef] [Google Scholar]
- Applicability of Remote Sensing Techniques to Groundwater Exploration in Semi-Arid Hard Rock Terrain-A Systematic Approach. Chalmers Publication Library-Chalmers University of Technology; 2002.
- Groundwater exploration using remote sensing and geographic information systems in a semi-arid area (Southwest of Urmieh, Northwest of Iran) Arab. J. Geosci.. 2013;6(4):1229-1240.
- [Google Scholar]
- Lineament mapping and groundwater occurrence within the vicinity of Osara Dam, Itakpe-Okene area, North Central Nigeria, using landsat data. J. Geosci. Geomat.. 2016;4(3):42-52.
- [Google Scholar]
- Groundwater resources development in hard rock terrain – an approach using remote sensing and GIS techniques. Int. J. Appl. Earth Obs. Geoinf.. 2000;2(3–4):204-215.
- [Google Scholar]
- Fractures and transmissivity behaviour of the hard rock aquifer system in parts of Western Ghats, Tamil Nadu, India. Water Resour. J. 2003:53-59.
- [Google Scholar]
- Appraising the accuracy of GIS-based Multi-criteria decision making technique for delineation of Groundwater potential zones. Water Resour. Manage.. 2014;28:4449-4466.
- [CrossRef] [Google Scholar]
- Mapping groundwater potential in Kitui District, Kenya using geospatial technologies. Int. J. Water Resour. Environ. Eng.. 2012;4(1):15-22.
- [Google Scholar]
- Landslide hazard mapping at Selangor, Malaysia using frequency ratio and logistic regression models. Landslides. 2007;4:33-41.
- [Google Scholar]
- Regional groundwater productivity potential mapping using a geographic information system (GIS) based artificial neural network model. Hydrogeol. J.. 2012;20:1511-1527.
- [CrossRef] [Google Scholar]
- Extract relevant features from DEM for groundwater potential mapping. Int. Arch. Photogramm. Remote Sens. Spatial Inf. Sci.. 2015;40(7):113-119.
- [Google Scholar]
- Comparing GIS-based multi-criteria decision-making and Boolean logic modelling approaches for delineating groundwater recharge zones. Arab. J. Geosci. 2015
- [CrossRef] [Google Scholar]
- Application of probabilistic-based frequency ratio model in groundwater potential mapping using remote sensing data and GIS. Arab. J. Geosci. 2014
- [CrossRef] [Google Scholar]
- Groundwater and poverty: exploring the connections. In: Llamas M.R., Custodio E., eds. Intensive Use of Groundwater: Challenges and Opportunities. B V, Lisse. The Netherlands: Swets and Zeitlinger; 2003. p. :441-456.
- [Google Scholar]
- Mapping of lineaments for groundwater targeting in the basement complex region of Ondo State, Nigeria, using remote sensing and geographic information system (GIS) techniques. Int. J. Water Resour. Environ. Eng.. 2011;3(7):150-160.
- [Google Scholar]
- Multi-criteria decision evaluation in groundwater zones identification in Moyale-Teltele subbasin, South Ethiopia. Int. J. Remote Sens.. 2009;30:2729-2740.
- [Google Scholar]
- Role of remote sensing and GIS in artificial recharge of the groundwater aquifer in the Shanmuganadi sub water shed in the Cauvery River Basin, Tiruchirappalli District, Tamil Nadu. In: International Symposium on Geoinformatics for Spatial Infrastructure Development in Earth and Allied Sciences. 2008.
- [Google Scholar]
- Delineation of groundwater potential zone in Chhatna Block, Bankura District, West Bengal, India using remote sensing and GIS techniques. Environ. Earth Sci.. 2013;70(5):2115-2127.
- [Google Scholar]
- Assessment of groundwater potential zones using GIS technique. J. Indian Soc. Remote Sens.. 2009;37:69-77.
- [Google Scholar]
- A comparative assessment between three machine learning models and their performance comparison by bivariate and multivariate statistical methods for groundwater potential mapping in Iran. Water Resour. Manage. 2015;29(14):5217-5236.
- [CrossRef] [Google Scholar]
- Groundwater qanat potential mapping using frequency ratio and Shannon’s entropy models in the Moghan watershed, Iran. Earth Sci. Inf.. 2015;1(8):171-186.
- [Google Scholar]
- Groundwater spring potential using boosted regression tree, classification and regression tree, and random forest machine learning models in Iran. Environ. Monit. Assess.. 2016;188:44.
- [CrossRef] [Google Scholar]
- A GIS-based landslide susceptibility evaluation using bivariate and multivariate statistical analyses. Eng. Geol.. 2009;110:11-20.
- [Google Scholar]
- GIS mapping of regional probabilistic groundwater potential in the area of Pohang City, Korea. J. Hydrol.. 2011;399:158-172.
- [Google Scholar]
- GIS-based groundwater spring potential mapping in the Sultan Mountains (Konya, Turkey) using frequency ratio, weights of evidence and logistic regression methods and their comparison. J. Hydrol.. 2011;411(3–4):290-308.
- [Google Scholar]
- Optimization of the DRASTIC method for groundwater vulnerability assessment via the use of simple statistical methods and GIS. Hydrogeol. J.. 2005;14(6):894-911.
- [Google Scholar]
- Assessment of a data-driven evidential belief function model and GIS for groundwater potential mapping in the Koohrang watershed, Iran. Geocarto Int.. 2015;30(6):662-685.
- [CrossRef] [Google Scholar]
- GIS-based groundwater spring potential assessment and mapping in the Birjand Township, southern Khorasan Province, Iran. Hydrogeology. 2014;22:643-662.
- [CrossRef] [Google Scholar]
- Groundwater potential zonation for basaltic watersheds using satellite remote sensing data and GIS techniques. Cent. Eur. J. Geosci.. 2009;1(1):120-129.
- [Google Scholar]
- Delineation of landslide hazard areas on Penang Island, Malaysia, by using frequency ratio, logistic regression, and artificial neural network models. Environ. Earth Sci.. 2010;60:1037-1054.
- [CrossRef] [Google Scholar]
- Groundwater potential mapping at Kurdistan Region of Iran using analytic hierarchy process and GIS. Arab. J. Geosci. 2014
- [CrossRef] [Google Scholar]
- Application of GIS-based data driven random forest and maximum entropy models for groundwater potential mapping: A case study at Mehran Region, Iran. Catena. 2016;137:360-372.
- [CrossRef] [Google Scholar]
- Identification of groundwater prospective zones by using remote sensing and geoelectrical methods in Jharia and Raniganj coalfields, Dhanbad district, Jharkhand state. J. Earth Syst. Sci.. 2005;114(5):515-522.
- [Google Scholar]
- Integrated terrain analysis in site selection for artificial recharge in Ayyar basin, Tamil Nadu, India. Water Resour. J. 1997:43-48. Bangkok. ST/ESCAP/SER-C/190
- [Google Scholar]
- Application of analytical hierarchy process, frequency ratio, and certainty factor models for groundwater potential mapping using GIS. Earth Sci. Inf.. 2015;8(4):867-883.
- [CrossRef] [Google Scholar]
- A multivariate geostatistical approach for landscape classification from remotely sensed image data. Stoch. Env. Res. Risk Assess.. 2015;29(2):369-378.
- [Google Scholar]
- Integrated remote sensing and GIS for groundwater exploration and identification of artificial recharge sites. Int. J. Remote Sens.. 1998;19(10):1825-1841.
- [Google Scholar]
- An integration of GIS and remote sensing in groundwater investigations: a case study in Burdur, Turkey. Hydrogeol. J.. 2005;13(5–6):826-834.
- [Google Scholar]
- Use of remote sensing and GIS to determine recharge potential zones: the case of Occidental Lebanon. Hydrogeol. J.. 2006;14(4):433-443.
- [Google Scholar]
- Application of Remote Sensing and GIS for groundwater recharge zone in and around Gola Block, Ramgargh district, Jharkhand, India. Int. J. Sci. Res. Publ.. 2012;2(2):1-6.
- [Google Scholar]
- Buried preglacial groundwater channels in the Albany-Schenctady area in New York. Econ. Geol.. 1949;34:654-673.
- [Google Scholar]
- Water resource evaluation and management for Morar River Basin, Gwalior district, Madhya Pradesh, Using GIS. Earth Sci. India. 2009;2(III):174-186. e-journal
- [Google Scholar]
- Groundwater study using remote sensing and geographic information systems (GIS) in the central highlands of Eritrea. Hydrogeol. J.. 2006;14(5):1029-1041.
- [Google Scholar]
- Delineation of groundwater prospects zones in and around Kadiri, Anathapur District, Andhra Pradesh, India. Int. J. Geomat. Geosci.. 2012;2(3):759-769.
- [Google Scholar]
- Principles of Geomorphology. New York: John Wiley; 1969.
- Artificial recharge in the Waterman Canyoun—East Twin Creek area, San Bernardino county, California. 1972. Open file report, November U. S. Geological Survey, Menlo Park, California
- White, W.G., van Tuyl, W.D., Schaefer, E.J., 1946. The Ground-water Resources of the Glacial Deposits in the Vicinity of Canton, Ohio. Bulletin no. 2, Columbus, Ohio.
- Using remote sensing and GIS to analyse land cover change and its impacts on regional sustainable development. Int. J. Remote Sens.. 2002;23(1):107-124.
- [Google Scholar]
- Remote-sensing based approach to improve regional estimation of renewable water resources for sustainable development. In: US-Egypt workshop on Space Technology and Geo-information for Sustainable Development. 2010. Cairo, Egypt
- [Google Scholar]
- GIS-based multivariate adaptive regression spline and random forest models for groundwater potential mapping in Iran. Environ. Earth Sci.. 2016;75:665.
- [CrossRef] [Google Scholar]


