

Translate this page into:
Fractal-like kinetics for adsorption of Pb (II) on graphene oxide/hydrous zirconium oxide/crosslinked starch bio-composite: Application of Taguchi approach for optimization
⁎Corresponding author. nafisurrahman05@gmail.com (Nafisur Rahman)
-
Received: ,
Accepted: ,
This article was originally published by Elsevier and was migrated to Scientific Scholar after the change of Publisher.
Peer review under responsibility of King Saud University. Production and hosting by Elsevier.
Abstract
Abstract
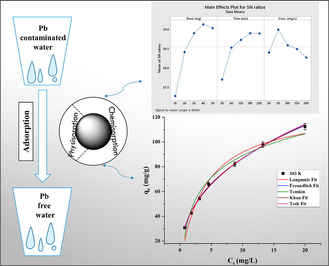
This study deals with the decontamination of Pb (II) from aqueous environment using graphene oxide/hydrous zirconium oxide/crosslinked starch bio-composite (GZS-BC). Various instrumental techniques were used to characterize the GZS-BC. The main factors of Pb (II) sorption were optimized by Taguchi method. Under optimum conditions, (adsorbent dose: 40 mg, contact time: 180 min and initial Pb (II) concentration: 50 mg/L) maximum removal efficiency (98.50%) was achieved at pH 6. Various isotherm models were tested to fit the adsorption data and Freundlich isotherm model was the best fit model with high R2 values (0.9977–0.9983) and low values of χ2 (0.01–0.02) and APE (0.90–1.14). The kinetic data were investigated using classical and fractal-like kinetic equations. The fractal-like mixed 1,2-order kinetic model was the best fit model which pointed towards heterogeneous surface of GZS-BC with more than one type of sorption sites. Thermodynamic study shows that Pb (II) sorption onto GZS-BC was spontaneous and endothermic in nature. The values of ΔG° indicated that physisorption together with chemisorption was responsible for uptake of Pb (II).
Keywords
Graphene oxide/hydrous zirconium oxide/crosslinked starch bio-composite (GZS-BC)
Pb (II)
Sorption
Taguchi approach
Classical and fractal kinetics
Thermodynamics

1 Introduction
Water pollution generated by toxic metals and organic pollutants has disturbed the ecological systems and posing severe hazard to public health. Lead (Pb) is a toxic heavy metal which is discharged from various industrial operations into the environment. The human body may take up heavy metals including Pb (II) from polluted water, food and air. Inorganic lead enters human body through inhalation (about 20–80%) and ingestion (5–15%) (Matta and Gjyli, 2016). World Health Organization (WHO, 2017) has set 0.01 mg/L as the maximum limit of lead in drinking water. Moreover, the accumulated Pb (II) in body is believed to disturbing the hemoglobin synthesis and functioning of renal, nervous, reproductive and immune systems. Therefore, the scientific community has taken interest to develop technologies for removing Pb (II) from contaminated water. Several water treatment techniques (oxidation, chemical precipitation, ion exchange, adsorption and biological methods) have been developed to eliminate Pb (II) from wastewater (Maftouh, et al., 2023; Bayuo, et al., 2022; Argun, et al., 2008; Rahman et al., 2021a; Rahman et al., 2021b). Among them, adsorption is considered as the most suitable technique due to easy handling, economical and reusability of adsorbents (Rahman and Varshney, 2020; Azmi, et al., 2020).
Graphene oxide (GO) is frequently used as an adsorbent because of its high surface area (Kyzas, et al., 2014). GO contains numerous oxygen containing functional groups. However, it is tough task for GO to reach the enormous theoretical surface area due to its nature of stack and agglomeration through the strong Van der Waals interaction (Wang, et al., 2012). Additionally, high dispersibility of GO made inconvenient to be isolated from the sample solution after adsorption. To overcome aggregation/separation, GO based composite materials have been developed with enhanced removal efficiency (Rahman and Raheem, 2022a). Madadrang et al. have synthesized ethylenediaminetetraacetate-GO which exhibited improved capacity for Pb (II) (Madadrang, et al., 2012). GO strengthened by chitosan was utilized to remove Pb (II) (Najafabadi, et al., 2015) due to functional groups present in chitosan moiety. The aggregation of GO sheets can be prevented by modification of GO surface with poly-3-aminopropyltriethoxysilane oligomers (Huang, et al., 2015). Literature survey revealed that the composite materials based on zirconium oxide could be an interesting option for water purification due to their chemical and thermal stability and non-toxicity (Rahman and Nasir, 2019). Further, starch, a cost effective second plentiful polysaccharide, was utilized widely because of its high biodegradability, non-harmful nature, eco-friendliness and structural functionality (Oluwasina, et al., 2019). The appearance of numerous functionalities on the starch molecule can be utilized to enhance the number of active sites for the adsorption purpose (Mohiuddin, et al., 2021). The binding of starch molecule with graphene oxide and zirconium should synergistically enhance the physical and chemical properties of the composite material with higher removal efficiency than would be expected from the addition of their individual components.
For the kinetic study, several classical kinetic models have been tested for the prediction of rate controlling steps in the uptake of pollutants by adsorbents. The classical-kinetic models provide time independent rate constants. However, Kopelman suggested that the rate coefficients for the pollutant adsorption on adsorbent is time-dependent (Kopelman, 1988). The fractal-like concept was applied to determine the rate coefficients which were time-dependent (Brouers and Sotolongo-Costa, 2006; Haerifar and Azizian, 2014). Moreover, the variables of adsorption process have been optimized for obtaining the maximum efficiency using one-variable-at-a-time and design of experiment (DOE) approaches. Among several DOE, Taguchi design of experiment was employed to gain more knowledge via less experimental runs. Taguchi method utilized the orthogonal array (OA) design for the optimization purpose (Rahman and Raheem, 2022b).
The aim of this work was to synthesize graphene oxide/hydrous zirconium oxide/crosslinked starch bio-composite (GZS-BC) using N,N’-methylene bis-acrylamide (MBA) as a cross-linking agent and to explore the potential as adsorbent to remove Pb (II). The material was characterized by Fourier transform infrared spectroscopy (FTIR), scanning electron microscopy (SEM) coupled with energy-dispersive X-ray spectroscopy (EDX), transmission electron microscopy (TEM), and X-ray diffraction (XRD). Taguchi method was applied to optimize the variables of Pb (II) adsorption onto GZS-BC. The kinetic data were analyzed by fractal-like kinetic approach to determine time-dependent rate coefficient.
2 Experimental
2.1 Materials and method
Graphite fine powder (CDH, India), sodium nitrate (Merck, India), lead (II) nitrate (Merck, India), starch (SRL, India), zirconium oxychloride (Otto, India), N,N'-methylene bis-acrylamide (MBA) (Otto, India), potassium persulfate (Fisher Scientific, India), sodium hydroxide (Fisher Scientific, India), potassium permanganate (Merck, India), hydrogen peroxide (30%, Fisher Scientific, India) were used in this study.
2.2 Synthesis of graphene oxide (GO)
GO was prepared by our previously reported method (Rahman and Raheem, 2022a).
2.3 Synthesis of graphene oxide/hydrous zirconium oxide (GZ)
GO (0.5 g) was dispersed in distilled water (100 mL) and stirred for 30 min. Then 50 mL of 0.5 M ZrOCl2·8H2O was added in GO suspension in drop-wise manner followed by stirring. After complete addition, the pH was brought to ∼ 10 by adding NaOH (2.5 M) and magnetically stirred for 8 h at 80 °C. Finally, the material was obtained after filtration and dried in an oven at 60 °C. The same procedure was also adopted for the synthesis of hydrous zirconium oxide (HZO) without addition of GO.
2.4 Synthesis of graphene oxide/hydrous zirconium oxide/crosslinked starch bio-composite (GZS-BC)
Starch (4.5 g) was hydrolyzed in 100 mL of sodium hydroxide solution (0.15 M) by stirring at 60 °C for 1 h. The prepared GZ (1.5 g) was sonicated in distilled water for 30 min and then added to hydrolyzed starch. The reaction mixture was stirred for 1 h at 60 °C. In a separate beaker, 2.25 g potassium persulfate was dissolved in distilled water at 70 °C. In another beaker, 675 mg MBA was dissolved in distilled water at 40 °C. The solutions of potassium persulfate and MBA were added to the reaction mixture containing GZ and starch and stirred continuously at 70 °C for 3 h. After sonication for 1 h, the material was collected by filtration and dried at 60 °C.
2.5 Characterization of the GZS-BC.
The instrumentation details are presented in supplementary file (Text S1).
2.6 Taguchi method for optimization
Taguchi method was adopted for obtaining the optimum conditions for Pb (II) removal by adsorption. The effect of three factors, each at five levels, on the percent removal of Pb (II) was investigated. The selected factors (A: adsorbent dose, B: contact time and C: initial Pb (II) concentration) and their levels (1, 2, 3, 4 and 5) are given in Table S1.
[L25 (54)] orthogonal array (OA) for three factors, each at five different levels, are given in Table 1. The experiments were conducted according to [L25 (54)] design. Experimental results were analyzed using signal to noise
ratio. Three types of
ratio (nominal-the-better, smaller-the-better, and larger-the-better) were utilized for data evaluation. In this study maximum response (% removal) is required and thus, larger-the-better category was adopted to probe the experimental data. The larger the better
ratio is presented as:
Runs
Dose (mg)
Time (min)
Conc. (mg/L)
%R Observed
(S/N) ratio observed
1
10
30
30
63.74
36.09
2
10
60
50
77.37
37.77
3
10
120
100
75.32
37.54
4
10
180
150
76.02
37.62
5
10
200
200
73.92
37.38
6
20
30
50
79.98
38.06
7
20
60
100
83.01
38.38
8
20
120
150
84.06
38.49
9
20
180
200
83.76
38.46
10
20
200
30
85.76
38.67
11
30
30
100
80.73
38.14
12
30
60
150
86.86
38.78
13
30
120
200
86.91
38.78
14
30
180
30
90.71
39.15
15
30
200
50
96.11
39.66
16
40
30
150
82.02
38.28
17
40
60
200
87.15
38.81
18
40
120
30
91.30
39.21
19
40
180
50
98.50
39.87
20
40
200
100
94.30
39.49
21
50
30
200
78.92
37.94
22
50
60
30
88.15
38.90
23
50
120
50
95.70
39.62
24
50
180
100
93.30
39.40
25
50
200
150
92.20
39.29
where n and y represent the replicating number of experiment and Pb (II) removal (%R), respectively. The analysis of variance (ANOVA) was adopted to reveal the impact of process variables on Pb (II) removal.
2.7 Adsorption studies
For adsorption isotherm studies, the optimum value of adsorbent (40 mg) was added to different conical flasks holding 25 mL of Pb (II) solution of varying concentrations (30–200 mg/L, pH 6) and agitated on a water shaker for 180 min at 303, 313 and 323 K. After separation of adsorbent, Pb (II) concentration was determined in the solution phase. The amount of Pb (II) adsorbed per unit mass of GZS-BC (
mg/g) and removal (%) were quantified as:
Where C0 and Ce denote initial and equilibrium concentration (mg/L), respectively. V and m are solution volume (L) and mass of GZS-BC (g).
For kinetic studies, adsorbent (40 mg) was added to Pb (II) solution (25 mL, 50 mg/L; pH 6) and stirred for different time intervals at three temperatures (303, 313 and 323 K). After filtration, Pb (II) concentration was determined in aqueous phase and capacity was calculated at different time intervals.
2.8 Error analysis
Values of Chi-square (
) and average percentage error (APE) were estimated using Eqs. (4) and (5) to judge the fitness of isotherm and kinetic models.
where and are measured capacity and capacity (simulated) from the model, respectively.
3 Results and discussion
3.1 Synthesis of bio-composite
To increase the chemical stability of the bio-composite in an aqueous solution, it was cross-linked using MBA as a cross-linking agent and potassium persulfate as radical initiator. The synthesis procedure is shown in Scheme 1.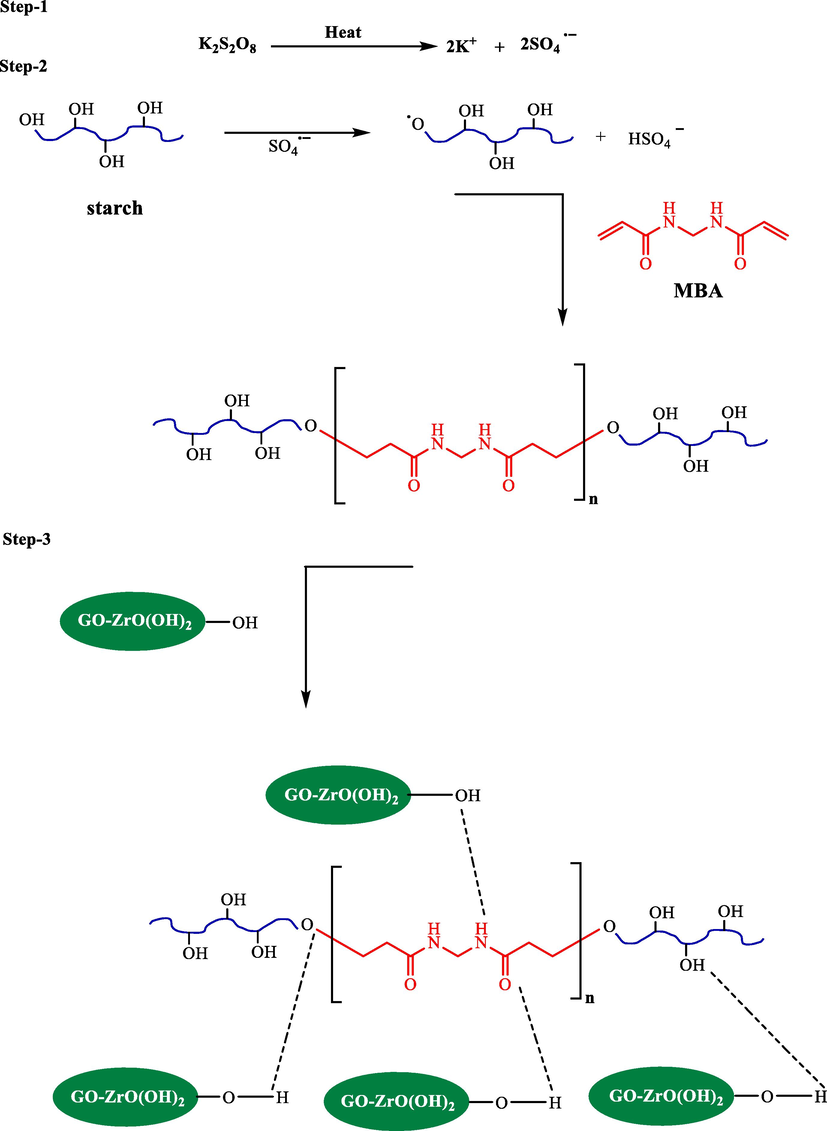
Systematic procedure for the synthesis of GZS-BC.
3.2 FTIR studies
Fig. 1a represents the FTIR spectra of MBA, GO, HZO, GZ, starch and GZS-BC. FTIR spectrum of GO gives a broad peak centered at 3399 cm−1 which represented the O–H stretching vibration. The peak at 1174 cm−1 indicated the C-O-C (epoxy) vibration. Further, the bands at 1722 cm−1, 1624 cm−1 and 1068 cm−1 are designated to the stretching of C = O (carboxylic acid), C = C (aromatic) and C-OH, respectively (Huang, et al., 2016). In the FTIR spectrum of HZO, a broad band (3300–3600 cm−1) centered at 3410 cm−1 represents the stretching mode of O–H vibration of coordinated water on hydrated zirconium oxide (Cho, et al., 2016). Band at 1630 cm−1 and 1576 cm−1 are due to O–H vibration of water molecule (Pérez, et al., 2016; Mohammadi and Fray, 2011). Further, lattice vibration of Zr-O was identified by the peaks at 850 cm−1 and 484 cm−1 (Rahman and Nasir, 2018). The band at 1341 cm−1 was due to bending mode of Zr-OH (Wang, et al., 2019). However, in the FTIR spectrum of GZ, the peak at 1722 cm−1 (C = O) disappeared which may be due to incorporation of zirconium oxide on the GO surface. Other peaks of GO were weakened which further illustrated the formation of GZ. In the FTIR spectrum of starch, band at 1650 cm−1 is associated with bending vibration of water molecule (Kibar and Us, 2014). In case of GZS-BC, the intensity of the band in the range 3300–3600 cm−1 increases as compared to GZ, and shifting in peak was observed from 3408 cm−1 to 3371 cm−1 which may be due to H-bond formation of starch molecule with GZ. A new peak at 1456 cm−1 appears in bio composite which confirmed the C-N linkage (Nesic, et al., 2016; Anirudhan and Rejeena, 2014). These results indicated the successful formation of bio composite GZS-BC.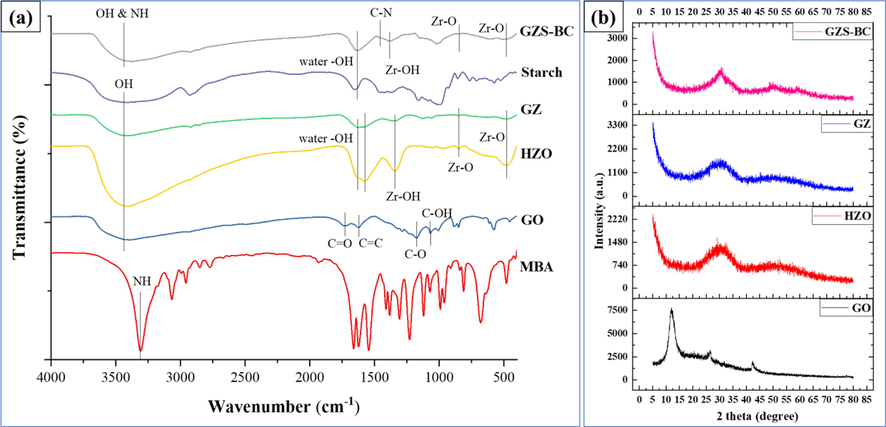
(a) FTIR spectra of MBA, GO, HZO, GZ, starch and GZS-BC, and (b) XRD spectra of GO, HZO, GZ and GZS-BC biocomposite.
3.3 XRD data
XRD patterns of GO, HZO, GZ and GZS-BC are shown in Fig. 1b. In the case of GO, a sharp peak is obtained at 2θ = 12.12° which is the characteristic peak of GO (Rahman and Raheem, 2022a). In case of HZO, a broad peak was observed from 20°-40° confirming its amorphous nature (Luo, et al., 2013). The GO peak disappeared in the GZ which may be because of incorporation of HZO on the GO surface. There is no change in XRD pattern of GZS-BC except sharpness of peak nearly at 30° which may be due to linkage of starch molecules with HZO.
3.4 Morphological study
SEM images of GZ and GZS-BC are shown in Fig. 2a and 2b, respectively. In the SEM image of GZ (Fig. 2a), the surface of GO sheet is covered with HZO particles which makes the surface irregular shaped. The SEM image of GZS-BC shows small pores which suggested the incorporation of starch molecules on GZ. The EDX spectrum of the bio-composite (Fig. 2c) indicated the presence of Zr (38.02%), O (31.89%), C (24.67%) and N (5.42%). The SEM results confirm that the starch molecules are successfully incorporated on the GZ surface. TEM images of bio-composite are shown in Fig. 2d, which clearly shows the amorphous nature of the material and successful synthesis of bio-composite.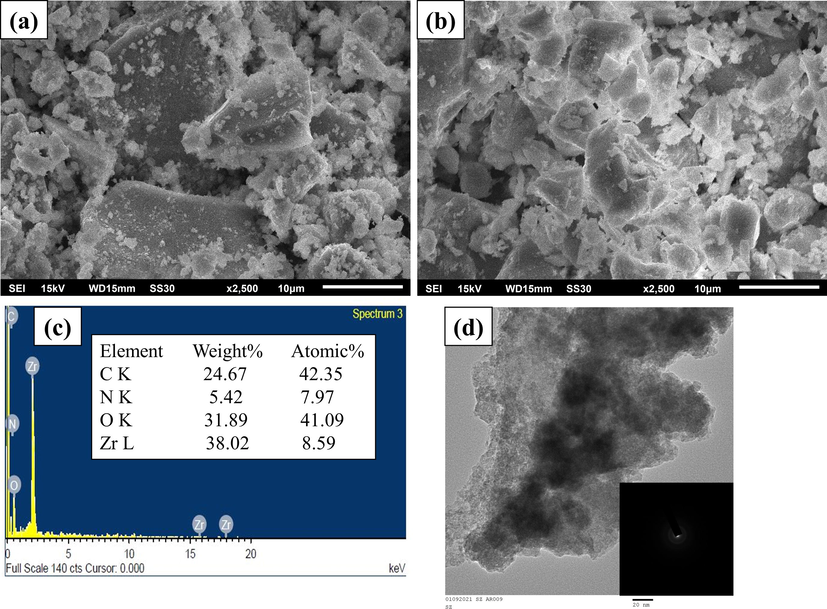
SEM images of (a) GZ (b) GZS-BC (c) EDX spectrum of GZS-BC, and (d) TEM image of GZS-BC.
3.5 Taguchi design for optimization
Experiments were conducted according to [L25 (54)] orthogonal array and percent removal as well as the
ratio are presented in Table 1. Optimum value of controlling factor was determined based on the highest
ratio (Fig. 3a). Estimated value of max–min (Δ) was used to address the impact of controlling factor on the removal efficiency (Table S2). The optimum combination was obtained as A4-B4-C2 with corresponding
ratio as 39.13, 38.90 and 38.99 for Pb (II), respectively.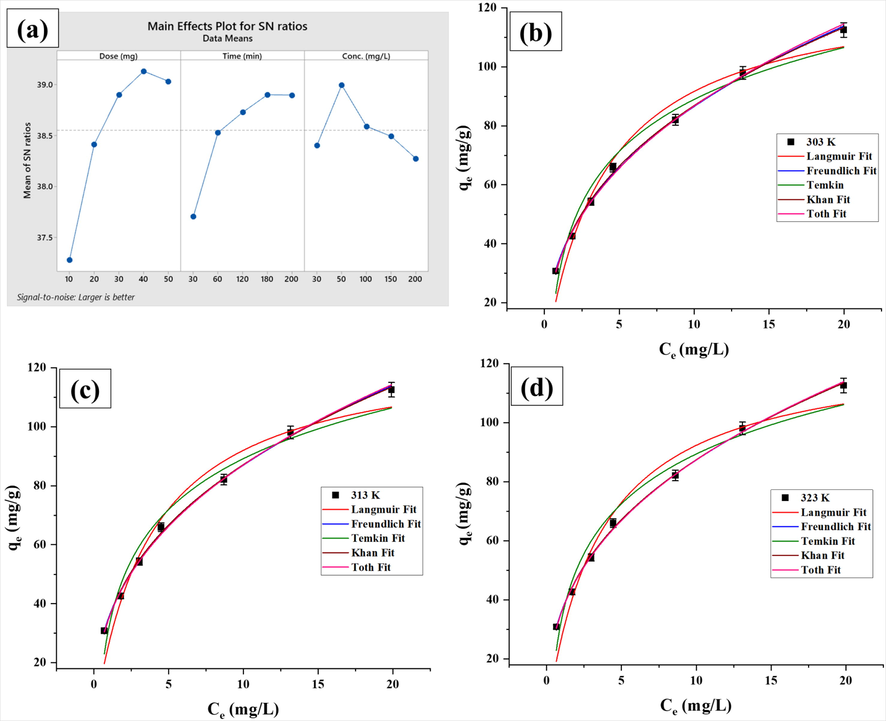
(a) Plot of controlling factors for
ratios utilizing larger is better category through Taguchi model, and (b, c, d) Non-linear isotherm plots for adsorption of Pb (II) onto GZS-BC.
ANOVA was performed to validate the design model using F-value, p-value, predicted
and adjusted
values (Table 2). The chosen factors i.e., adsorbent dose, contact time and initial concentration influence the removal efficiency because F-value of the controlling factors > critical value
. All controlling factors are statistically significant since their p-values were < 0.05.
Source
df
Adj SS
Adj MS
F-Value
P-Value
% Contribution
adsorbent dose (mg)
4
1023.09
255.772
6394.30
0.000
62.96
contact time (min)
4
448.30
112.074
2801.86
0.000
27.59
initial conc. (mg/L)
4
153.00
38.250
956.25
0.000
9.42
error
12
0.48
0.040
0.03
Total
24
1624.87
100.00
Percent contribution of each controlling factor to the removal efficiency was assessed using Eq. (6) (Rahman et al., 2021).
Where and are individual sum of square and overall sum of square values, respectively. The order of percent contribution (Table 2) was obtained as: adsorbent dose (62.96%) > contact time (27.59%) > initial concentration (9.42%). The controlling factors i.e. A: adsorbent dose, B: contact time and C: initial concentration at the selected levels 4, 4, and 2, respectively, are significant and the optimum combination is: adsorbent dose-40 mg, contact time-180 min and initial concentration-50 mg/L for obtaining the highest removal efficiency.
3.6 Effect of pH
Solution pH played the dominant role for Pb (II) adsorption on adsorbent surfaces. The impact of pH was studied in the pH range 3–7 using the optimal values of other factors (A: adsorbent dose, B: contact time and C: initial Pb (II) concentration) obtained from Taguchi method. It was noticed that the removal efficiency increases with increasing pH and maximum removal of Pb (II) was obtained at pH 6. Beyond pH 6, decreasing trend in removal efficiency was noticed (Fig. S1). Further, adsorption experiments were carried out at pH 6.
3.7 Adsorption isotherm
The adsorption data were assessed by Langmuir, Freundlich, Temkin, Khan, and Toth isotherm models and Table S3 shows their non-linear equations The non-linear regression analysis using Origin 2023 software yielded the isotherm parameters (Table 3). The plots of
(mg/g; experimental and estimated from isotherm models)) against the Ce (mg/L) of Pb (II) at 303, 313 and 323 K for the studied isotherm models are displayed in Fig. 3 (b, c and d). The best fitting of isotherm model was judged based on highest R2 and lowest χ2 and APE values (Table 3). Based on R2, χ2 and APE values, the fitting of isotherm models with measured data followed the sequence: Freundlich > Temkin > Langmuir > Toth > Khan. Thus, the Freundlich isotherm model was able to explain more accurately the measured data as it provided highest R2 (0.9977–0.9983) and lowest χ2 (0.01 – 0.02) and APE (0.90–1.14) values. The adsorption capacity of GZS-BC for Pb (II) was found to be 112.52 mg/g at 303 K. The best fitting of Freundlich isotherm model demonstrated that multi-layer adsorption took place on heterogeneous surface of GZS-BC. The Freundlich constant (n) is referred as heterogeneity factor. The value of n > 1 is indicative of favourable adsorption and the adsorption intensity increases with increase in n value (Rahman and Haseen, 2014). Herein, the values of n were 2.53, 2.56, and 2.61 at 303, 313 and 323 K, respectively, which illustrated the uptake of Pb (II) onto GZS-BC is favourable. The increase in heterogeneity factor (n) with the rising temperature suggested the improvement in adsorption intensity and endothermic nature of uptake of Pb (II) onto GZS-BC. Experimental adsorption capacities were obtained as 112.52 mg/g, 112.56 mg/g and 112.60 mg/g at 303 K, 313 K and 323 K, respectively.
Isotherm model
Parameter
303 K
313 K
323 K
Langmuir
(mg/g)
128.03
127.13
125.71
KL (L/mg)
0.25
0.26
0.28
R2
0.9635
0.9596
0.9546
χ2
2.14
1.89
1.53
APE
13.78
12.94
1.53
Freundlich
KF ((mg/g)/(mg/L)n)
34.85
35.42
36.13
n
2.53
2.56
2.61
R2
0.9977
0.9977
0.9983
χ2
0.02
0.01
0.01
APE
1.14
1.08
0.90
Temkin
β
25.38
24.91
24.34
(L/g)
3.33
3.59
3.94
R2
0.9702
0.9675
0.9658
χ2
0.32
0.34
0.38
APE
5.30
5.53
5.58
Khan
(mg/g)
16.67
13.83
10.77
8.06
13.05
25.89
0.62
0.62
0.62
R2
0.9981
0.9979
0.9983
χ2
81.65
86.60
92.09
APE
85.18
87.71
90.44
Toth
(mg/g)
34.35
35.04
35.90
1 × 10-16
1 × 10-16
1 × 10-16
t
1.67
1.65
1.63
R2
0.9974
0.9972
0.9978
χ2
54.31
53.39
52.25
APE
69.47
68.87
68.12
3.8 Adsorption kinetics
3.8.1 Classical kinetic model
The kinetic data were investigated by the classical kinetic models (pseudo-first order (PFO), pseudo-second order (PSO), mixed 1,2 order (MO) and exponential (Exp)) and fractal-like (f) kinetic models (f-PFO, f-PSO, f-MO and f-Exp). The equations for the classical kinetic models are expressed as:
Where is the adsorbed amount of Pb (II) in mg/g at time t (hour), are the rate constants of PFO (hour−1), PSO (g mg−1 hour-1) and Exp (mg g−1 hour-1) kinetic models, respectively.
which determines the contribution of second order term.
3.8.2 Fractal-like kinetic modeling
The fractal-like approach is utilized to describe the adsorption of Pb (II) on GZS-BC/solution interface. The rate coefficient with temporal “memories” is defined as:
where
and
are the instantaneous and time independent rate coefficients, respectively. h is the fractal exponent determining the heterogeneity of adsorbent surface and is related to fractional time index α as:
According to Eq. (11), the concept of fractal dependence for the adsorption coefficient has permitted to develop rate equations for fractal-like kinetic models which are expressed as:
Where are the rate coefficients of f- PFO, f- PSO, and f- exponential equations; where ,.
The modeling of kinetic data for adsorption of Pb (II) onto GZS-BC was carried out by non-linear regression of
profiles according to classical kinetic (Eq. (7), 8, 9 and 10) and fractal-like kinetic equations (Eq. (13), 14, 15 and 16). The kinetic plot of classical and fractal kinetic models are shown in Fig. 4 (a, c, e) and Fig. 4 (b, d, f), respectively and their parameters are listed in Table 4. When classical kinetic models are considered, the PSO model gives best data fitting as compared to PFO, MO and Exp models because it is associated with high R2 values, and low χ2 value with respect to MO model. For PSO model, the value of time independent rate coefficient (
was 0.12 g mg−1 hour-1 at the studied temperatures (303–323 K). On the other hand, each fractal kinetic model provides improved adsorption dynamics prediction in comparison to its classical model because of higher R2 values. When fractal-like kinetic models are taken into account, the f-MO model fits best to the kinetic data with high R2 values (0.9906–0.9911) and low χ2 value (0.01) and thus, it is the appropriate model for narrating the Pb (II) uptake at all temperatures studied. For f-MO model, the values of
were found in the range 1.76–1.78 hour-(1-h) (1-h = 0.60 to 0.61). At initial stage (t < 2 hour), the adsorption of Pb (II) mainly takes place on the external surface and therefore, the hypothesis of uniform adsorbate concentration is reasonably valid. In this stage, both the classical and fractal-like kinetic models would be suitable to explain the uptake of Pb (II). At later stage (t > 2 hour), intraparticle diffusion occurred where uniform distribution of adsorbate concentration in inner pore with blind and open spaces is not possible which is responsible for fractal-like behaviour. Experimental adsorption capacities were obtained as 30.78 mg/g, 30.81 mg/g and 30.85 mg/g at 303 K, 313 K and 323 K, respectively.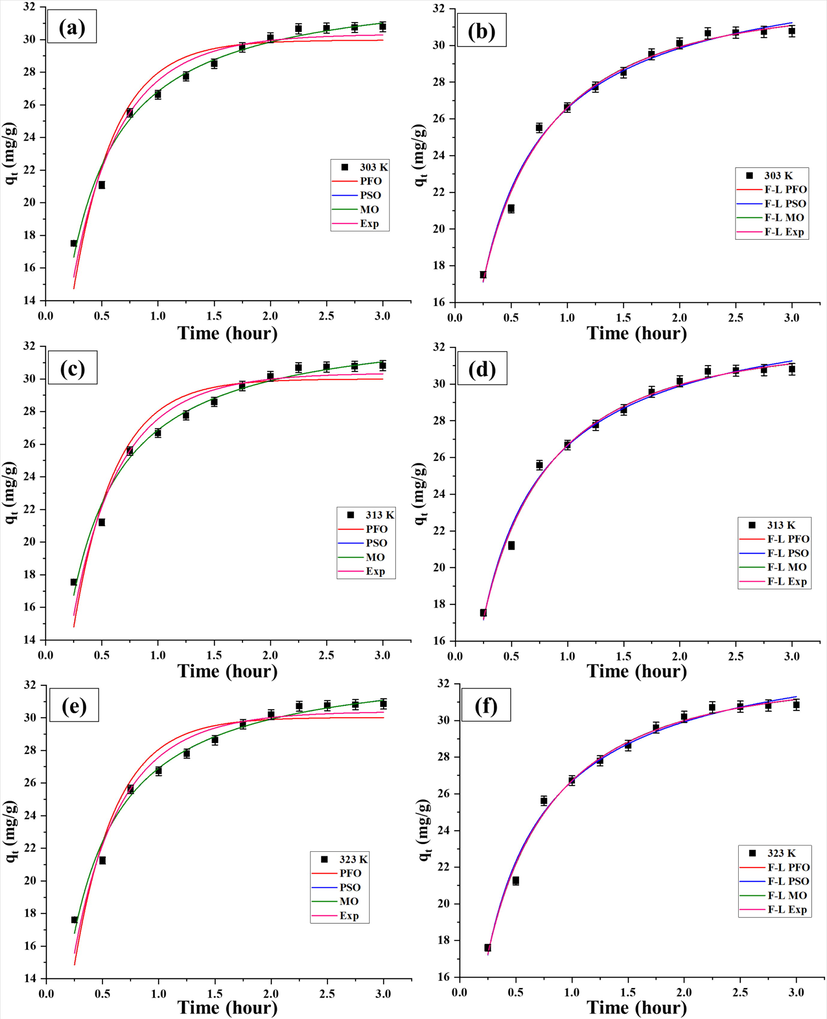
Classical and fractal- like PFO, PSO, MO and Exp kinetic models for adsorption of Pb (II) onto GZS-BC.
Kinetic model
303 K
313 K
323 K
Kinetic model
303 K
313 K
323 K
PFO
f-PFO
(mg/g)
29.48
29.52
29.55
(mg/g)
31.47
31.48
31.53
2.71
2.72
2.73
1.76
1.78
1.78
R2
0.9194
0.9205
0.9197
α
0.60
0.61
0.60
χ2
0.05
0.05
0.05
R2
0.9906
0.9911
0.9911
APE
4.21
4.18
4.21
χ2
0.02
0.01
0.01
APE
2.23
2.19
2.19
PSO
f- PSO
(mg/g)
34.01
34.01
34.04
(mg/g)
33.74
33.73
33.77
0.12
0.12
0.12
0.09
0.09
0.09
R2
0.9858
0.9866
0.9865
α
0.85
0.86
0.86
χ2
0.34
0.33
0.33
R2
0.9884
0.9889
0.9889
APE
10.49
10.40
10.33
χ2
0.28
0.28
0.28
APE
9.62
9.48
9.48
MO
f- MO
(mg/g)
34.52
34.49
34.52
(mg/g)
31.37
31.45
31.49
0.09
0.09
0.09
1.76
1.78
1.78
0.98
0.98
0.98
3.32 × 10⁻¹³
1 × 10-14
9.20 × 10⁻¹⁶
R2
0.9858
0.9865
0.9865
α
0.60
0.61
0.60
χ2
0.45
0.44
0.44
R2
0.9906
0.9911
0.9911
APE
12.14
11.98
11.90
χ2
0.01
0.01
0.01
APE
1.90
2.07
2.06
Exp
f- Exp
(mg/g)
29.93
29.96
29.99
(mg/g)
32.81
32.76
32.80
1.95
1.97
1.97
1.39
1.40
1.40
R2
0.9571
0.9580
0.9575
α
0.70
0.70
0.70
χ2
0.02
0.02
0.02
R2
0.9904
0.9909
0.9909
APE
3.00
2.76
2.79
χ2
0.13
0.12
0.12
APE
6.61
6.34
6.34
3.9 Thermodynamic studies
The uptake of Pb (II) by GZS-BC was investigated at 303, 313 and 323 K and thermodynamic parameters (ΔGo, ΔHo and ΔSo) were assessed using Eqs. (17) and (18) (Rahman and Haseen, 2014):
The value of
, equilibrium constant as a dimensionless quantity, was obtained as (Milonjić, S.K., 2007):
Where R and T are known as universal gas constant (J K−1 mol−1) and temperature (Kelvin), respectively. The values of ΔHo and ΔSo were assessed from the plot of versus (Fig. S2). The values of Δ G0 (-26.76, −27.82 and −28.96 kJ mol−1 at 303, 313 and 323 K, respectively) elucidated the spontaneity in the uptake of Pb (II) on GZS-BC. Based on ΔG° values, the nature of sorption can be predicted. ΔG° values falling in the range of −20 to 0 kJ mol−1 pointed towards physisorption whereas −20 to −80 kJ−1 mol suggested the involvement of both physisorption and chemisorption (Kumar, et al., 2014). On the basis of Δ G0 values, it is suggested that both physisorption and chemisorption processes are involved in the uptake of Pb (II) onto GZS-BC. Positive values of ΔHo (6.53 kJ mol−1) and ΔSo (109.84 J mol−1 K−1) are indicative of endothermic nature of Pb (II) sorption and randomness at solution/GZS-BC interface, respectively.
3.10 Application of GZS-BC for removal of Pb (II) from natural water
For the removal of Pb (II) from natural water samples (surface water and municipal wastewater), a fixed concentration of Pb (II) was added (50 mg/L) and sorption experiment was conducted in batch mode using GZS-BC as adsorbent. The percentage removal of Pb (II) was obtained as 97.85% and 98.02% from surface water and municipal wastewater, respectively. Therefore, the prepared material is a potential adsorbent for removal of Pb (II) from natural water samples.
4 Conclusion
The prepared bio-composite GZS-BC was found as an efficient adsorbent for removal of Pb (II) from aqueous environment. Various analytical techniques confirm the synthesis of bio-composite. The optimization of dependent variables was done with the help of Taguchi approach and optimum conditions were obtained as: adsorbent dose = 40 mg; contact time = 180 min and initial Pb (II) concentration = 50 mg/L. The maximum removal of Pb (II) was obtained at pH 6. The maximum sorption capacity was obtained as 112.52 mg/g at 303 K. Freundlich model was fitted well among various isotherm models based on high R2 values (0.9977–0.9983) and low error functions χ2 (0.01–0.02), APE (0.90–1.14). Kinetic study shows that the adsorption was done in fractal manner confirming the heterogeneity of the adsorbent and existence of more than one adsorption sites. The values of ΔG° (-26.76, −27.82 and −28.96 kJ mol−1 at 303, 313 and 323 K, respectively) indicated that the sorption was occurring through physisorption along with chemisorption.
Acknowledgement
The authors are highly thankful to Department of Chemistry, AMU assisted through UGC DRS-SAP, DST-PURSE and DST-FIST programs for providing necessary facilities. The authors extend their sincere appreciation to the Researchers Supporting Project Number (RSP2023R266) King Saud University, Riyadh, Saudi Arabia for the support.
Declaration of Competing Interest
The authors declare that they have no known competing financial interests or personal relationships that could have appeared to influence the work reported in this paper.
References
- Poly (acrylic acid-co-acrylamide-co-2-acrylamido-2-methyl-1-propanesulfonic acid)-grafted nanocellulose/poly (vinyl alcohol) composite for the in vitro gastrointestinal release of amoxicillin. J. Appl. Polym. Sci.. 2014;131
- [CrossRef] [Google Scholar]
- Activation of pine cone using Fenton oxidation for Cd (II) and Pb (II) removal. Bioresour. Technol.. 2008;99:8691-8698.
- [Google Scholar]
- Adsorptive removal of Pb(II) ions from groundwater samples in Oman using carbonized Phoenix dactylifera seed (Date stone) J. King Saud Univ. Sci.. 2020;32:2931-2938.
- [Google Scholar]
- A comprehensive review on the decontamination of lead (II) from water and wastewater by low-cost biosorbents. RSC Adv.. 2022;12:11233-11254.
- [Google Scholar]
- Generalized fractal kinetics in complex systems (application to biophysics and biotechnology) Phys. A: Stat. Mech. Appl.. 2006;368:165-175.
- [Google Scholar]
- Synthesis of hydrous zirconium oxide-impregnated chitosan beads and their application for removal of fluoride and lead. Appl. Surf. Sci.. 2016;372:13-19.
- [Google Scholar]
- Fractal-like kinetics for adsorption on heterogeneous solid surfaces. J. Phys. Chem. C. 2014;118:1129-1134.
- [Google Scholar]
- 3-Aminopropyl-triethoxysilane functionalized graphene oxide: a highly efficient and recyclable catalyst for Knoevenagel condensation. Catal. Lett. 2015;145:1000-1007.
- [Google Scholar]
- Graphene oxide-based composite hydrogels with self-assembled macroporous structures. RSC Adv.. 2016;6:3561-3570.
- [Google Scholar]
- Evaluation of structural properties of cellulose ether-corn starch based biodegradable films. Int. J. Polym. Mater. Polym. Biomater.. 2014;63:342-351.
- [Google Scholar]
- Adsorption of brilliant green by surfactant doped polyaniline/MWCNTs composite: evaluation of the kinetic, thermodynamic, and isotherm. Ind. Eng. Chem. Res.. 2014;53:7167-7175.
- [Google Scholar]
- Graphene oxide and its application as an adsorbent for wastewater treatment. J. Chem. Technol. Biotechnol.. 2014;89:196-205.
- [Google Scholar]
- Nanocomposites of graphene oxide-hydrated zirconium oxide for simultaneous removal of As (III) and As (V) from water. Chem. Eng. J.. 2013;220:98-106.
- [Google Scholar]
- Adsorption behavior of EDTA-graphene oxide for Pb (II) removal. ACS Appl. Mater. Interfaces.. 2012;4:1186-1193.
- [Google Scholar]
- Comparative review of different adsorption techniques used in heavy metals removal in water. Biointerface Res. Appl. Chem.. 2023;13:397.
- [Google Scholar]
- Mercury, lead and arsenic: impact on environment and human health. J Chem. Pharm. Sci.. 2016;9:718-725.
- [Google Scholar]
- A consideration of the correct calculation of thermodynamic parameters of adsorption. J. Serb. Chem. Soc.. 2007;72:1363-1367.
- [Google Scholar]
- Synthesis and characterisation of nanosized TiO2–ZrO2 binary system prepared by an aqueous sol–gel process: Physical and sensing properties. Sens. Actuators B: Chem.. 2011;155:568-576.
- [Google Scholar]
- Starch-Mg/Al layered double hydroxide composites as an efficient solid phase extraction sorbent for non-steroidal anti-inflammatory drugs as environmental pollutants. J. Hazard. Mater.. 2021;401:123782
- [Google Scholar]
- Removal of Cu2+, Pb2+ and Cr6+ from aqueous solutions using a chitosan/graphene oxide composite nanofibrous adsorbent. RSC Adv.. 2015;5:16532-16539.
- [Google Scholar]
- Physical-chemical behavior of novel copolymers composed of methacrylic acid and 2-acrylamido-2-methylpropane sulfonic acid. Mater. Chem. Phys.. 2016;174:156-163.
- [Google Scholar]
- Influence of oxidized starch on physicomechanical, thermal properties, and atomic force micrographs of cassava starch bioplastic film. Int. J. Biol. Macromol.. 2019;135:282-293.
- [Google Scholar]
- Organic–inorganic interpenetrated hybrids based on cationic polymer and hydrous zirconium oxide for arsenate and arsenite removal. Chem. Eng. J.. 2016;287:744-754.
- [Google Scholar]
- Equilibrium modeling, kinetic, and thermodynamic studies on adsorption of Pb (II) by a hybrid inorganic–organic material: polyacrylamide zirconium (IV) iodate. Ind. Eng. Chem. Res.. 2014;53:8198-8207.
- [Google Scholar]
- Application of Box-Behnken design and desirability function in the optimization of Cd (II) removal from aqueous solution using poly (o-phenylenediamine)/hydrous zirconium oxide composite: equilibrium modeling, kinetic and thermodynamic studies. Environ. Sci. Pollut. Res.. 2018;25:26114-26134.
- [Google Scholar]
- N-(((2-((2-Aminoethyl) amino) ethyl) amino) methyl)-4-sulfamoylbenzamide Impregnated Hydrous Zirconium Oxide as a Novel Adsorbent for Removal of Ni (II) from Aqueous Solutions: Optimization of Variables Using Central Composite Design. ACS Omega. 2019;4:2823-2832.
- [Google Scholar]
- Graphene oxide/Mg-Zn-Al layered double hydroxide for efficient removal of doxycycline from water: Taguchi approach for optimization. J. Mol. Liq.. 2022;354:118899
- [Google Scholar]
- Fabrication of graphene oxide/inulin impregnated with ZnO nanoparticles for efficient removal of enrofloxacin from water: Taguchi-optimized experimental analysis. J. Environ. Manage.. 2022;318:115525
- [Google Scholar]
- Assessment of ampicillin removal efficiency from aqueous solution by polydopamine/zirconium (IV) iodate: optimization by response surface methodology. RSC Adv.. 2020;10:20322-20337.
- [Google Scholar]
- Synthesis of 2-mercaptopropionic acid/hydrous zirconium oxide composite and its application for removal of Pb (II) from water samples: central composite design for optimization. J. King Saud Univ. Sci.. 2021;33:101280
- [Google Scholar]
- Efficient removal of Pb (II) from water using silica gel functionalized with thiosalicylic acid: Response surface methodology for optimization. J. King Saud Univ. Sci.. 2021;33:101232
- [Google Scholar]
- Synthesis and characterization of polydopamine/hydrous zirconium oxide composite and its efficiency for the removal of uranium (VI) from water. Environ. Nanotechnol. Monit. Manag.. 2021;15:100458
- [Google Scholar]
- Modified hydrous zirconium oxide/PAN nanofibers for efficient defluoridation from groundwater. Sci. Total Environ.. 2019;685:401-409.
- [Google Scholar]
- Reduced graphene oxide/ZnO composite: reusable adsorbent for pollutant management. ACS Appl. Mater. Interfaces. 2012;4:3084-3090.
- [Google Scholar]
- Guidelines for drinking-water quality. Geneva: Fourth edition incorporating the first addendum; 2017.
Appendix A
Supplementary data
Supplementary data to this article can be found online at https://doi.org/10.1016/j.jksus.2023.102712.
Appendix A
Supplementary data
The following are the Supplementary data to this article:


